THE CONVERSION OF THE OLD WACHOVIA OFFICE TOWER IN DOWNTOWN
←
→
Page content transcription
If your browser does not render page correctly, please read the page content below
THE CONVERSION OF THE OLD
WACHOVIA OFFICE TOWER IN DOWNTOWN
           GREENSBORO

           A Report Prepared for

          The Carroll Companies

          G. DONALD JUD, PH.D.
           JUD & ASSOCIATES
            722 Rollingwood Drive
            Greensboro, NC 27410

            Phone: (336) 294-3655
        E-mail: gdonaldjud@yahoo.com

                March 2006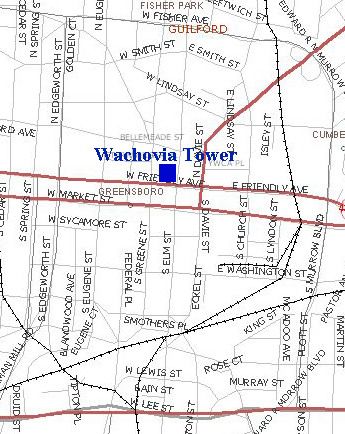
Table of Contents

                                                                        Page Number

Executive Summary …………………………………………..………………..………..                             iii

I.     Introduction …………………………………………….………………………                                 1

II.    Downtown Greensboro   …………………………………………..……………                           1

III.   Downtown’s Residential Real Estate Market …………..……….....…………...         3
       1. National Demographic Change ……………………………………………                        3
       2. Demand for Downtown Living ……………………………….……………                        5

IV.    Economic Impact of the Wachovia Building Conversion ………………………           7

V.     Financial Feasibility of the Wachovia Building Conversion …………………...    9

VI.    Rationale for Public Sector Participation ……………………………………….             11

Background of the Principal Investigator ………………………………….……...……... 12

                                         ii                        JUD & ASSOCIATES
Executive Summary
This report prepared for The Carroll Companies examines Carroll’s plan to renovate and upgrade
the old Wachovia office tower in downtown Greensboro to provide 156 condominium units on 13
floors. The old Wachovia building occupies a central position in the heart of Downtown
Greensboro, situated on the corner North Elm and West Friendly Avenue, directly across the
street from the new Center City Park. The effective reuse of this building will transform the
center of downtown and be a strong catalyst for continued downtown revitalization.
Since 2000, the downtown population has grown rapidly, reflecting the increased availability of
downtown housing. Between 2000 and 2005, the population of downtown jumped 10 percent
annually, and the number of households rose 9.5 percent per year. The number of persons living
downtown has grown much more rapidly than the population of Guilford County as a whole.
Although the resident population is small (estimated at 1,204 in 2005), Downtown Greensboro is
an important employment center. Some 21,318 persons worked downtown in 2005 (7.8 percent
of the county-wide total).
An increase in Greensboro’s downtown population of 100 percent to 2,413 is very likely given
the large number of people who work downtown. A downtown resident population of 2,413
would represent only 11.3 percent of the downtown workforce and would be a smaller fraction
than in other southeastern cities.
Current market trends suggest that the demand for residential property is strong and rising quite
rapidly. The growing market for downtown living in Greensboro is part of a strong national
demographic trend that is leading to increasing downtown residential development in cities across
the country. The residential market in downtown Greensboro is currently behind the curve but is
likely to experience a substantial advance over the next few years.
The Carroll Companies anticipate that conversion of the Wachovia tower to residential
condominiums will require the expenditure of $34,295,764 over a period of 18 months. The
converted building will have external balconies, an exercise room, and a modern security system.
The units will range in size from 613 to 1,655 square feet and will be priced in the neighborhood
of $246 per square foot. This price is about 20 above the average of much of what is available
downtown now, but the unique nature of the high-rise apartments located in the heart of
downtown should give the project a substantial competitive edge over what is now available.
The economic impacts that will accrue to the county economy because of the building conversion
are substantial. During the occupancy phase of the project, economic impact analysis reveals that
the county economy will gain $6.7 million in additional annual output (or business receipts), 58
net new jobs, and $0.4 million in tax revenues annually, of which a substantial portion is likely to
be in the downtown area.
To draw forth the entrepreneurial talent needed in a large-scale, innovative project such as that
anticipated by the Carroll Conpanies conversion of the Wachovia building, investors must be able
to anticipate a competitive market return. RealtyRate.com estimates of the discount rates
(internal rates of return) on properties in the southeast reveals that high-rise condominium
projects earned an average 16.61 percent, with rates that ranged from 11.52 percent to 22.38
percent.
iii JUD & ASSOCIATESThe most likely estimate of project cash flows associated with conversion of the Wachovia tower
shows a breakeven point of 3.12 years and an expected internal rate of return of 7.70 percent.
The net present value of the cash flows at 16.61 percent, the estimated equivalent return available
in the market, is ($2,945,397). For this project to provide a market-level return requires a subsidy
of $2,945,397.
Focusing only on the additional revenues to the City of Greensboro, the building conversion
would add $38,484,160 to the city tax rolls, assuming that 156 the units are assessed at an
average value of $246,693. Given the downtown city tax rate of $0.6575 per $100 valuation, the
converted building would yield $253,033 in additional tax revenue annually. Under the most
likely scenario, if the city were to provide a subsidy of $2,945,397, it would break even from the
additional tax revenue in 11.6 years.
Economic impact analysis shows that the present value of all additional city and county tax
revenues generated by the project through the 1st 10 years of occupancy is $3,193,612. This
figure is larger than the anticipated subsidy of $2,945,397, showing that the project is a profitable
investment of municipal and county funds. Given the catalytic character of the Wachovia tower
project with all its potential linkage effects to further downtown growth and development,
subsidies in the range of $2.9 million seem a rational investment for a city looking to significantly
invigorate its downtown center.
iv JUD & ASSOCIATESI. Introduction
Real estate development transforms ideas and visions into bricks and mortar, creating the
neighborhoods in which we work, live, and play. This report prepared for The Carroll Companies
examines Carroll’s plan to renovate and upgrade the old Wachovia office tower in downtown
Greensboro to provide 156 condominium units on 13 floors. The average square footage of the
new units is anticipated to be 1,003 square feet, with units ranging from 613 to 1,655 square feet.
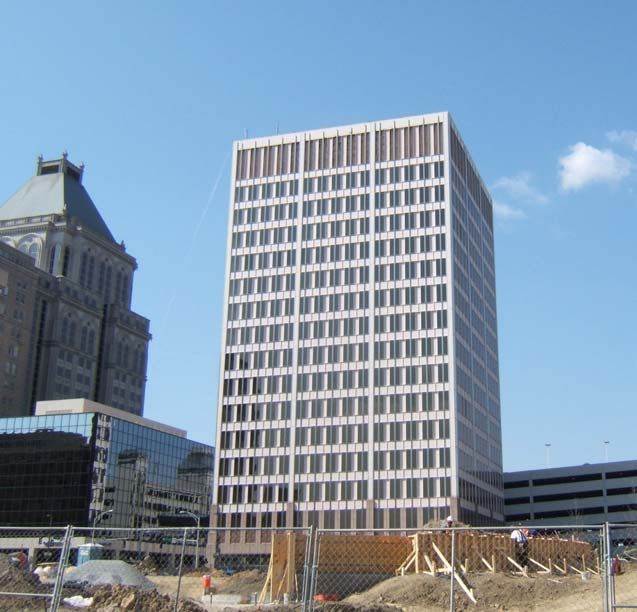
The old Wachovia building occupies a central position in the heart of Downtown Greensboro.
The effective reuse of this building will transform the center of downtown and be a strong
catalyst for continued downtown revitalization. The first section of this report discusses
downtown Greensboro. The second section looks at the downtown residential real estate market
and the demand for downtown living space. The third section assesses the economic impact of
the project, and the fourth section reviews its financial feasibility. The final section addresses the
rational for public participation in the project.
II. Downtown Greensboro
Greensboro’s downtown area is officially delimited by Fisher Avenue on the north, Murrow
Boulevard on the east, Lee Street to the south and Spring Street to the west.1 The Wachovia
tower is situated in the heart of downtown on the corner North Elm and West Friendly Avenue,
directly across the street from the new Center City Park.
Figure 1: Downtown Greensboro
1
This definition is taken from Downtown Greensboro, Inc., http://www.downtowngreensboro.net/
1 JUD & ASSOCIATESThe number of persons living downtown in 2005 is small. An estimated 1,204 persons currently
live in the downtown area. Of these, about 220 live in the Gateway Plaza retirement community.
However, since 2000, the downtown population has grown rapidly, reflecting the increased
availability of downtown housing (Table 1).2 Between 2000 and 2005, the population of
downtown jumped 10 percent annually and the number of households rose 9.5 percent per year.
The number of persons living downtown has grown much more rapidly than the population of
Guilford County as a whole.
Table 1: Downtown Population Growth, 2000-2005
Ave. Ann.
Area: 2000 2005 % Chg.
Downtown Greensboro:
Population 748 1,204 10.0%
Households 478 754 9.5%
Average Household Size 1.56 1.60 2.6%
Guilford County:
Population 421,048 452,657 1.5%
Households 168,667 184,048 1.8%
Average Household Size 2.50 2.46 -1.6%
Source: ESRA, see http://www.esri.com/.
In 2005, the median age of those living downtown was 41.5 years, compared to a county-wide
average of 36.2 years. Median annual household income is estimated at $25,242, with 11 percent
of households making more than $75,000.
Although the resident population is small, Downtown Greensboro is an important employment
center (Table 2). Some 21,318 persons worked downtown in 2005 (7.8 percent of the county-
wide total).
2
The expansion of housing downtown is part of a national trend. The demand for downtown housing, which has long been dormant,
is rising substantially in areas across the country. See, for example, Sheila Muto, “Apartment Builders Set Sights in Los Angeles,
Wall Street Journal, Wednesday, March 14, 2001, p. B8.
2 JUD & ASSOCIATESTable 2: Downtown Employment Growth, 2000-2005
Percent
Ave. Ann. Share
Sector: 2000 2005 % Chg. 2005
Construction 781 854 1.8% 4.0%
Manufacturing 1,761 1,868 1.2% 8.8%
Wholesale trade 248 262 1.1% 1.2%
Retail trade 537 375 -6.9% 1.8%
Transportation & warehousing 361 364 0.2% 1.7%
Information 1,528 1,109 -6.2% 5.2%
Finance & insurance 3,118 4,567 7.9% 21.4%
Real estate & rental & leasing 478 520 1.7% 2.4%
Professional, scientific & technical services 2,342 1,882 -4.3% 8.8%
Management of companies & enterprises 911 1,172 5.2% 5.5%
Admin, support, waste mgt, remediation ser 1,220 812 -7.8% 3.8%
Educational services 778 790 0.3% 3.7%
Health care and social assistance 3,843 4,657 3.9% 21.8%
Arts, entertainment & recreation 569 400 -6.8% 1.9%
Accommodation & food services 870 940 1.6% 4.4%
Other services (except public administration) 901 748 -3.7% 3.5%
Unclassified establishments 183 3 -57.6% 0.0%
Total 20,425 21,318 0.9% 100.0%
Source: U.S. Bureau of the Census, Census of Business (2003) and the author.
Most of the employment downtown is concentrated in the non-manufacturing sector, which
accounts for 91 percent of the total. The largest downtown employment sectors are health care and
social assistance (22 percent) and financial services (21 percent). The fastest growing employment
sector since 2000 has been finance and insurance, which has surged 7.9 percent annually since
2000.
III. Downtown’s Residential Real Estate Market
Since the 1950s, the residential population of Greensboro and most other cities has been
expanding away from downtown, as more and more city residents have sought the amenities of
suburban living. The number of residents in downtown Greensboro today (estimated at 1,204 in
2005) reflects this trend.
National Demographic Change
A number of demographers have come to believe, however, that the long-running trend of
increasing suburban populations in cities across the U.S. has changed.3 It is being replaced by a
new trend of downtown living that is being propelled by powerful demographic forces which
reflect the increasing number of households without children. According to Census estimates,
between 2000 and 2004, households without children in the nation at large grew 2.1 percent
3
See, for example, Jennifer Moulton, “Ten Steps to a Living Downtown,” (Washington, DC: The Brookings Institution, Center on
Urban and Metropolitan Policy, Discussion Paper, October 1999).
3 JUD & ASSOCIATESannually, while the number with children rose only 0.9 percent annually (Table 3). In 2004,
households without children accounted for 68 percent of all households. Households without
children are the very group that is likely to be most attracted to living downtown. Many in this
group are trying to simplify and enhance their lives by eliminating the journey to work commute,
reducing the time spent on home up-keep, and moving closer to cultural and entertainment
activities often found downtown.
According to a recent study by the Bookings Institute, the number of childless households living
downtown is growing rapidly because about one-third of baby boomers whose children have
grown want a change from their “bland, car-dependent way of life in homogenous suburbs.”4
This segment of the boomer population sees downtown living as an invigorating alternative. At
the same time, a substantial portion of generation Xers who have delayed having children are
looking to live in places that offer more bracing alternatives than traditional suburbs. Educated,
creative, childless Xers are drawn to a more cosmopolitan lifestyle, focused on career and self-
fulfillment.
Table 3: National Demographic Change, 2000-2005
(in 1,000s)
% Chg.
Demographic Groups: 2000 2004 2000-04
Number of Households 104,705 112,000 1.7%
Number of Family Households 72,025 76,217 1.4%
With Own Children under 18 34,605 35,915 0.9%
Households Without Own Children under 18 70,100 76,085 2.1%
Ave. Household Size 2.69 2.62 -0.6%
Total Population 281,422 293,657 1.1%
Source: U.S. Bureau of the Census.
4
Jeff Hawkes, “Downtown Revival: A Matter of Heart,” Intelligencer Journal, January 26, 2006, p. 1.
4 JUD & ASSOCIATESDemand for Downtown Living
The demand for downtown living as expressed through the market for residential space is robust.
From 2000 through 2005, the county tax records show 82 sales of condominium/town home
properties. The number of sales has grown from 5 per year in 2000 to 22 in 2005 (Figure 2).
Figure 2: Downtown Condominium/Town Home Sales, 2000-2005
25
23
22 22
20
15
10
5 5 5
5
0
2000 2001 2002 2003 2004 2005
The average price per square foot of living space has risen rapidly as more luxurious space has
become available. Figure 2 plots the price pre square foot of space for condominium/town home
sales from 2000 through 2005. The average price per square foot in Figure 3 has risen from $83
to $163, an average increase of 14.5 percent a year. Informed opinion indicates that new
downtown residences are priced now in the neighborhood of $200 per square foot, as of the first
half of 2006.
Figure 3: Sales of Downtown Condominium/Town Homes, 2000 – 2005
240
200
Price per Square Foot
160
120
80
40
1998 2000 2002 2004 2006
Year of Sale
One way of estimating the potential demand for downtown living in Greensboro is to compare
Greensboro with a sample of comparable southeastern cities. Table 4 compares the population
living downtown in six southeastern cities to the population of the associated counties. On
average, 0.7 percent of the county population lives downtown. In Greensboro, the percentage of
5 JUD & ASSOCIATESGuilford County population (excluding High Point and Jamestown) that live downtown is only
0.35 percent.
Table 4: Comparison of Downtown and County Populations, 2005
County Downtown Downtown
City: Population Population Percentage
Asheville 206,330 1,661 0.81%
Charlotte 771,617 3,221 0.42%
Chattanooga 307,896 2,061 0.67%
Durham 223,314 4,594 2.06%
Richmond 192,494 1,084 0.56%
Winston-Salem 320,919 1,463 0.46%
Average 337,095 2,347 0.70%
Greensboro 2005* 346,538 1,204 0.35%
*
The county population shown in the Greensboro row excludes High Point and Jamestown.
Source: U.S. Bureau of the Census and ESRA.
If Greensboro’s downtown population were to grow to 0.7 percent of Guilford County (excluding
High Point and Jamestown), it would grow from its current level of 1,204 to 2,413, an increase of
100 percent. Assuming an average household size of 1.6 (see Table 1), the number of downtown
households would swell from 754 to 1,508, an increase of 100 percent.
An increase in Greensboro’s downtown population of 100 percent is very likely given the large
number of people who work downtown. Table 2 shows that the number of persons working
downtown totaled 21,318 in 2005. A downtown resident population of 2,413 would represent
only 11.3 percent of the downtown workforce. In 2000, 11.2 percent of those working downtown
in Charlotte also lived downtown, while in Chattanooga the number living downtown totaled 21
percent of the downtown workforce.5 Whether downtown Greensboro achieves such rapid
population growth depends on the market’s ability to provide desirable housing at affordable
prices.
A recent report by Downtown Greensboro and articles in the News & Record indicate that some
200 new downtown condos and town homes have or will soon come on the market.6 These
include:
1. 28 condominium units at 600 Bellemeade,
2. 49 condo units at Bellemeade Village next to the new ballpark,
3. 6 units at the restored Vick Commons on Fisher Avenue,
4. 33 units at 411 West Washington,
5. 18 units at Smothers Place,
6. 11 additional town homes in Southside.
5
G. Donald Jud and Sharon Puryear, The Economy of Downtown Greensboro (Greensboro, NC: Downtown Greensboro, Inc. 2001),
p. 11.
6
Downtown Greensboro, Inc., Report to the Community, September 22, 2005. Marta Hummel, “Condo Fever is Taking Over
Downtown,” News & Record, December 2, 2005. Jim Schlosser, “Bellemeade Village Backers Give Preview,” News & Record,
December 14, 2005.
6 JUD & ASSOCIATESBut the 200 new units represent only 27 percent of the 754 new units that might reasonably be
expected as Greensboro’s downtown develops to more nearly resemble that of other North
Carolina cities like Asheville and Durham.
Current market trends suggest that the demand for residential property is strong and rising quite
rapidly. The growing market for downtown living in Greensboro is part of a strong national
demographic trend that is leading to increasing downtown residential development in cities across
the country. The residential market in downtown Greensboro is currently behind the curve but is
likely to experience a substantial advance over the next few years.
The Carroll Companies anticipate that conversion of the Wachovia building to residential
condominiums will require the expenditure of $34,295,764 over a period of 18 months. The
building will be completely refitted and upgraded, providing 156 condominium apartments on 13
floors. The converted building will have external balconies, an exercise room, and a modern
security system. The units will range in size from 613 to 1,655 square feet and will be priced in
the neighborhood of $246 per square foot. This price is about 20 above the average of much of
what is available downtown now. But the unique nature of the high-rise apartments located in the
heart of downtown should give the project a substantial competitive edge over what is now
available. Data from ESRI suggest that about 18 percent of the households in the county (or
32,900) can afford a condominium in this price range.7
IV. Economic Impact of the Wachovia Building Conversion
The analysis presented in this section examines the economic impact of the conversion and reuse
of the Wachovia building on the economy of Guilford County, NC. Economic impact is
measured in terms of 1) total additional output of all industries in the area, 2) total number of new
jobs created, 3) total value added (the sum of all final goods and services produced), 4) total
amount of additional personal income (the income of all persons from all sources, including
wages, profits, dividends, interest, rents, and transfer payments), 5) total amount of additional
labor income, and 6) total amount of additional city and county tax revenue.
The analysis is conducted using the IMPLAN® (IMpact Analysis for PLANing) input-output
model that divides the economy into sectors, defined by the good or service produced, where the
outputs of one sector are inputs of another. IMPLAN analyzes a computer model that contains
509 sectors of the local economy and reflects the existing structure of the economy using data
from the U.S. Department of Labor, Bureau of the Census, and the Bureau of Economic Analysis.
IMPLAN was originally developed by the U.S. Forest Service and the University of Minnesota
and is now marketed by Minnesota IMPLAN Group, Incorporated. Active users of the IMPLAN
model include: NC Dept of Commerce and the NC Department of Parks, Recreation, & Tourism
Management.
The estimated economic impacts of the conversion and reuse of the Wachovia building are shown
in Table 5. The table separates the impacts of the construction phase (which is anticipated to last
18 months) from the impacts that occur during the occupancy phase. Economic benefits during
the construction phase arise because of the monies spent on labor and materials to refit and
upgrade the building. Benefits during the occupancy phase derive from the expenditures of the
residents who occupy the new downtown condominiums.
7
This estimate based on income distribution figures from ESRI showing the number of households with incomes above $100,000, see
http://www.esri.com/.
7 JUD & ASSOCIATESSome of the new building residents will already live in Guilford County, so there is little net
benefit to the county from their moving from their current residences to the new condominium
tower. Some of the residents will move to the new condos from outside the county. The
additional spending by this group will provide net economic benefits to the county. A recent
report by the Census Bureau estimates that 46 percent of the persons who changed residences in
the South during 2004 moved in from outside the county.8 Accordingly, in computing the
economic impacts during the occupancy phase of the project, the analysis counts only 46 percent
of resident spending.
It is anticipated that the condominium units will sell for an average price of $246,693. Local
mortgage bankers were consulted to estimate the average income of households purchasing new
homes in the county. They estimated that the price of a new home averages roughly 2.5 times
household income. Dividing the average purchase price of the new condos ($246,693) by 2.5,
gives an estimate of household income of $98,677. Households at this income level are estimated
to spend 72 percent of their before-tax income.9
During the construction phase, because of the additional spending injected into the economy of
the county, the total output of goods and services in the county is anticipated to rise by
$55,681,920. A total of 609 net new jobs will be created in the county because of the new
construction spending and the associated multiplier effects generated throughout the economy of
the county. The new jobs will have an average wage of $33,344, which is 93.2 percent of the
2004 county average of $35,776. An additional $188,913 in municipal and county tax revenue
will be generated, not counting any property tax revenue from the converted building.
In the occupancy phase, the total annual output of goods and service in the county is projected to
increase by $6,747,054. The level of employment is forecast to expand by 58 net new jobs,
having an average wage of $28,541. County and municipal tax revenues are projected to be
$403,605 higher each year during the occupancy phase.
The largest employment gains are expected in the areas of retail trade, health care and social
services, accommodations and food services, and other services. A sizable portion of this new
employment is likely to be in the downtown area as the new residents demand increased services
near where they live.
Because of the new residents moving into the converted building from outside the county and the
associated new jobs that are created, the population of the county is projected to expand by 192
persons. One hundred and fifteen of these individuals are expected to live in the new downtown
condos and 78 elsewhere in the county.
Table 5 also shows the present values of the impact measures during the first 10 years of the
occupancy phase calculated assuming a 4.5 percent rate of discount.10 The present value of the
additional output generated during the occupancy phase amounts to $53,387,538, and the present
value of the additional local tax revenue is $3,193,612.
8
U.S. Bureau of the Census, “General Mobility of Persons 16 Years and Over, by Region, Sex, and Labor Force Status: 2004,”
Current Population Reports, http://www.census.gov/population/www/socdemo/migrate/cps2004.html.
9
See, Bureau of Labor Statistics, Survey of Consumer Expenditures, 2003.
10
This rate approximates the long-term municipal bond rate over the past two years, see
http://www.federalreserve.gov/releases/h15/data/m/slbond.txt.
8 JUD & ASSOCIATESTable 5: Economic Impacts of Wachovia Building Conversion
Present Value of
1st 10 years of
Impacts: Construction Phase Occupancy Phase Occupancy
Construction Expenditure $35,004,414 n.a. n.a.
Output (2005) $55,681,920 $6,747,054 $53,387,538
Employment 609 58 n.a.
Value Added $27,762,347 $3,072,183 $24,309,316
Personal Income $26,192,254 $2,746,184 $21,729,783
Labor Income $20,306,241 $1,654,241 $13,089,546
Ave. Income/Worker $33,344 $28,541 n.a.
Local Tax Revenue $188,913 $403,605 $3,193,612
Additional County Population n.a. 192 n.a.
V. Financial Feasibility of the Wachovia Building Conversion
To draw forth the entrepreneurial talent needed in a large-scale, innovative project such as that
anticipated by the Carroll Conpanies conversion of the Wachovia Building in downtown
Greensboro, investors must be able to anticipate a competitive market return. RealtyRate.com,
the trade name of the Robert G. Watts & Co., provides quarterly estimates of the discount rates
(internal rates of return) on properties across the country based on surveys of developers, lenders
and others. The 2006.1 Developer Survey reveals that high-rise condominium projects in the
Southeast earned an average 16.61 percent, with rates that ranged from 11.52 percent to 22.38
percent.
A critical element in the determination of the developer’s rate of return on any project is the time
needed to fully market the project. The quicker the new units are sold, the higher the rate earned
by the developer. The analysis in this section assumes that it will take 4 years from the start of
construction until the project is fully sold out.
9 JUD & ASSOCIATESFigure 4: The Pattern of Cash In-Flows by Project Year
(percent of total cash in-flow received each project year)
70.0%
60.0% 57.4%
50.0%
40.0%
33.0%
30.0%
20.0%
9.6%
10.0%
0.0%
2 3 4
Years from the Start of Construction
Figure 4 shows the pattern of cash in-flows by project year. It is assumed that, 57.4 percent of the
total cash in-flow from the sale of the condo units is received in the second year, 33.0 percent in
the third year, and 9.6 percent in the fourth year.
In a previous section, it was shown that the number of households living downtown can
reasonably be expected to grow form the current level of 754 to 1,508, or 100 percent.
Nevertheless, it is difficult to conceive that such an increase will occur in less than 3 years. A
more reasonable estimate would seem to be 5 years for such a large change to take place.11 Given
this reality, a 4-year estimate of the time required to sell out the converted 156-unit Wachovia
tower seems reasonable. The experience of two recent downtown projects provides further
grounding for the 4-year estimate. The News & Record reports that the 36-unit Governors Court
project needed more than 2 years to fill up, and as of the end of last year, none of the 6 units in
the Vick Commons project had been sold.12
11
If the downtown population grows at 10 percent annually, it will double in 7 years. If it grows at 14.9 percent, it will double in 5
years. For it to double in 3 years, requires an annual growth rate of 26 percent per year.
12
Marta Hummel, op. cit.
10 JUD & ASSOCIATESTable 6: Estimate of Project Returns
(annual estimated cash flows)
Average Estimate 1 2 3 4 Total
Cash Outflows ($22,863,843) ($11,431,921) 0 0 (34,295,764)
Cash Inflows (gross) 0 $22,886,413 $13,148,755 $3,848,416 39,883,584
Marketing Expense (686,592) (686,592) (788,925) (230,905) (2,393,015)
Cash Inflows (net) ($686,592) $22,199,821 $12,359,829 $3,617,511 37,490,569
Net Cash Flows ($23,550,435) $10,767,900 $12,359,829 $3,617,511 3,194,805
Breakeven 3.12
IRR 7.70%
NPV @ 16.61% ($2,945,397)
Table 6 shows the estimated annual project cash flows. Marketing expenses are estimated at 6
percent of gross cash inflows. The project has a break-even point of 3.12 years and provides an
expected internal rate of return (IRR) of 7.70 percent, which is below the minimum rate reported
by RealtyRates.com in 2006.1. The net present value (NPV) for the project is ($2,945,397) at a
16.61 rate of discount. For the project to generate an average market return of 16.61 percent
requires a subsidy of $2,945,397.
VI. Rationale for Public Sector Participation
Given the low level of return on the Wachovia tower conversion, it is doubtful that private
investors can be induced to undertake the project in the absence of a public subsidy. From the
perspective of the City of Greensboro, a subsidy for such a path-breaking, catalytic project
downtown may be fully justified however. Table 5 shows the economic impacts that accrue to
the county economy during the occupancy phase of the project: $6.7 million in additional annual
output (or business receipts), 58 net new jobs, and $0.4 million in tax revenues annually at the
city and county levels, of which a substantial portion is likely to be in the downtown area.
Focusing only on the additional revenues to the City of Greensboro, the building conversion
would add $38,484,160 to the city tax rolls, assuming that the 156 units are assessed at an
average value of $246,693. Given the downtown city tax rate of $0.6575 per $100 valuation, the
converted building would yield $253,033 in additional tax revenue annually. Under the most
likely scenario shown in Table 6, if the city were to provide a subsidy of $2,945,397, it would
break even from the additional tax revenue in 11.6 years.
Table 5 shows that the present value of all additional city and county tax revenues generated by
the new project through the 1st 10 years of occupancy is $3,193,612. This figure is larger than the
anticipated subsidy of $2,945,397, showing that the project is a profitable investment of
municipal and county funds. Given the catalytic character of the Wachovia tower project with all
its potential linkage effects to further downtown growth and development, subsidies in the range
of $2.9 million seem a rational investment for a city looking to significantly invigorate its
downtown center.
11 JUD & ASSOCIATESBackground of the Principal Investigator
G. Donald Jud is Professor Emeritus of Finance in the Bryan School of Business and Economics
at the University of North Carolina at Greensboro and principal of JUD & ASSOCIATES. He
has taught courses in economics, finance, and real estate. Dr. Jud received his Ph.D. from the
University of Iowa and MBA and BA degrees from the University of Texas. He is author of over
70 academic articles and three books.
Dr. Jud serves on the editorial boards of the Journal of Real Estate Finance and Economics and
the Journal of Real Estate Literature and is a member of the Appraisal Journal’s academic
review panel. He is a past editor of the Journal of Real Estate Research and continues to serve as
a member of its editorial board.
Dr. Jud is a past president of the American Real Estate Society (ARES) and former ARES
Director of Publications. He is a research fellow of the Homer Hoyt Advanced Studies Institute,
where he is an emeritus member of the Weimer School Faculty and the Board of Directors of the
Institute. Dr. Jud’s research has appeared in numerous academic and professional journals
including the Appraisal Journal, American Real Estate and Urban Economics Association
Journal, Journal of Real Estate Finance and Economics, Journal of Real Estate Research,
Journal of Housing Economics, Journal of Financial Education, Journal of Real Estate Portfolio
Management, Journal of Real Estate Practice and Education, Real Estate Issues, Journal of
Property Research, Journal of Financial Economics, Land Economics, and Urban Studies.
Dr. Jud has been a research consultant to Wachovia Bank, NC Department of Commerce, the
Piedmont-Triad Partnership, the National Association of Realtors®, the NC Association of
Realtors®, the Greensboro Chamber of Commerce, Downtown Greensboro, Inc., the Greensboro
Regional Realtors® Association, the Starmount Company, the Town of Boone, NC, RMIC
Corporation, CME Merchant Energy, the NC Biotechnology Center, the Triad Real Estate and
Building Industry Coalition (TREBIC), and the NC Association of Electrical Cooperatives.
12 JUD & ASSOCIATESYou can also read