ISSUE BRIEF May 2021 - ASPE
←
→
Page content transcription
If your browser does not render page correctly, please read the page content below
ISSUE BRIEF
May 2021
COVID-19 Vaccine Hesitancy: Demographic Factors,
Geographic Patterns, and Changes Over Time
Trinidad Beleche, Joel Ruhter, Allison Kolbe, Jessica Marus, Laina Bush, and Benjamin Sommers
Key Points
• Hesitancy around COVID-19 vaccines is a significant challenge for public health.
• Vaccine hesitancy has decreased across most demographic groups between January and
March 2021, but the percent of respondents indicating that they will “definitely not” get a
vaccine, referred to as the “strongly hesitant,” has remained relatively unchanged over
time.
• The largest declines in vaccine hesitancy were observed among those ages 18-24 (26% in
January 2021 to 18% in March 2021) and Blacks (34% in January 2021 to 18% in March
2021).
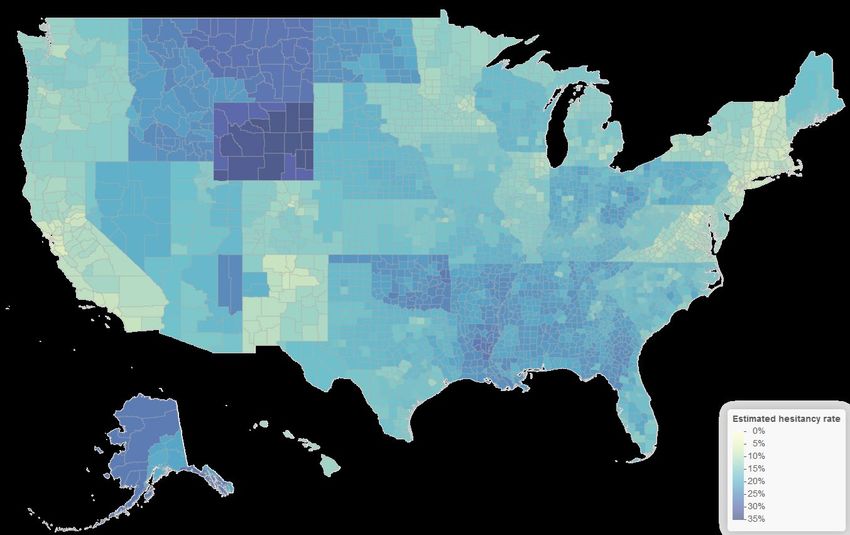
• Vaccine hesitancy rates were lowest on the West Coast and in the Northeast, and highest in
the South, Great Plains, and Alaska.
Introduction
As of May 19, 2021, three vaccines to prevent infection with SARS-CoV-2, the virus that causes
COVID-19, have been authorized for emergency use by the U.S. Food and Drug Administration
(FDA). These include two mRNA vaccines produced by Pfizer and Moderna, and one viral vector
vaccine produced by Johnson & Johnson’s Janssen. All three vaccines met the safety and
effectiveness requirements to obtain FDA’s Emergency Use Authorization for the prevention of
COVID-19. Despite the scientific data on vaccine safety and efficacy and the known risks of
severe illness and death associated with COVID-19, vaccine hesitancy remains a significant
barrier to bringing the pandemic to an end.
Addressing vaccine hesitancy around COVID-19 vaccines requires communication approaches
that are tailored to different groups in a way that will address their concerns. Data analysis can
inform the development of such strategies. To support state and local communication and
outreach efforts, this analysis explores vaccine hesitancy among different geographic areas and
sociodemographic groups, models which factors are associated with vaccine hesitancy, and
examines changing trends over time.
May 2021 ISSUE BRIEF 1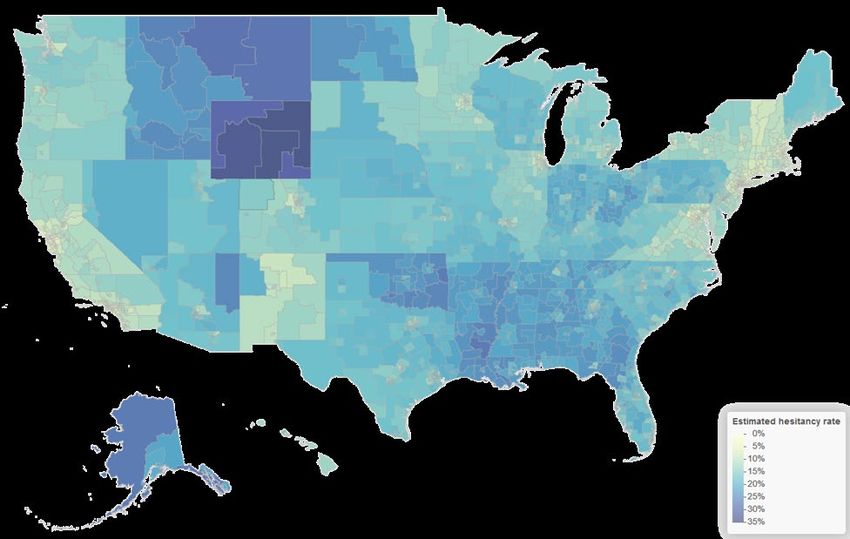
Background

Vaccine Hesitancy

Vaccine hesitancy refers to a continuum of beliefs and behaviors around whether or not to
accept vaccinations,1 ranging from complete refusal to complete acceptance. 2 Hesitancy can
lead individuals to delay or adjust recommended vaccination schedules, only vaccinate partially,
or decline all vaccines. 3 Vaccine hesitancy is an important issue not just for COVID-19 but for
pre-existing infectious diseases as well; declining rates of vaccination can threaten herd
immunity if they fall below a certain threshold, which varies by disease.4 In addition to other
mitigation factors, administering vaccinations during an outbreak is a critical component to
reducing associated illnesses and deaths. Consequently, refusal of vaccinations can impact how
quickly an outbreak may be controlled.

COVID-19 Vaccine Hesitancy

Overcoming hesitancy issues for COVID-19 vaccines is essential for ensuring vaccine coverage in
enough of the population to reduce transmission of SARS-CoV-2 and end the COVID-19
pandemic. During the latter part of 2020, as multiple COVID-19 vaccines were in the last phase
of clinical trials and showing promising initial results, many Americans expressed hesitancy
around these vaccines, indicating concerns about possible side effects, distrust of government
oversight to ensure safety, and concerns that the vaccines were too new. 5 This analysis
explores how vaccine hesitancy has evolved in the early months of 2021, as COVID-19
vaccinations became available to segments of the general public.

1
    Salmon, A., Dudley, M.Z., Glanz, J.M., Omer, S.B. (2015). Vaccine hesitancy: Causes, consequences, and a call to
    action, Vaccine, 33 (Suppl. 4):D66-D71, https://doi.org/10.1016/j.vaccine.2015.09.035.

2
  Leask, J., Kinnersley, P., Jackson, C., Cheater, F., et al. (2012). Communicating with parents about vaccination: A
framework for health professionals. BMC Pediatrics, 12: 154, https://doi.org/10.1186/1471-2431-12-154.

3
  McClure, C.C., Cataldi, J.R., O'Leary, S.T. (2018). Vaccine hesitancy: Where We are and where we are going.
Clinical Therapeutics, 39(8):1550-1562. https://doi.org/10.1016/j.clinthera.2017.07.003. Epub 2017 Jul 31. PMID:
28774498.

4
 Dubé, E., Laberge, C., Guay, M., Bramadat, P., Roy, R., Bettinger, J.A. (2013). Vaccine hesitancy: An overview.
Human Vaccines & Immunotherapeutics, 9:8, 1763-1773, https://doi.org/10.4161/hv.24657.

5
 Hamel, L., Kirzinger, A., Muñana, C., and Brodie M. KKF COVID-19 Vaccine Monitor: December 2020. The Kaiser
Family Foundation, December 15, 20210. Available at https://www.kff.org/coronavirus-covid-19/report/kff-covid-
19-vaccine-monitor-december-2020/; last accessed April 22, 2021.

    May 2021                                                                                    ISSUE BRIEF        2
Methods and Data
Data
ASPE examined sociodemographic factors and trends in vaccine hesitancy using survey data
from the U.S. Census Bureau’s Household Pulse Survey (HPS). In addition, ASPE developed
estimates of hesitancy rates at the county and local levels using the 2019 American Community
Survey (ACS) 1-year Public Use Microdata Sample (PUMS).
The HPS is nationally representative and includes information on U.S residents’ vaccination for
COVID-19, intentions to receive the COVID-19 vaccine when available, reasons for hesitancy to
receive a vaccine as well as other sociodemographic and geographic (state, region and
metropolitan statistical areas) information. We utilized data from the HPS collection periods
January 6-18, 2021 to March 17-29, 2021. Each survey during this period was sampled from
approximately 1.04 million housing units and had an overall weighted response rate between
6.4 percent (68,348 respondents) and 7.4 percent (77,104 respondents). 6 The ACS is a
nationally representative survey, and it provides key sociodemographic and geographic
information, which we used to analyze vaccine hesitancy at the regional, state, and county
levels, as well at the level of the ACS’s public use microdata areas (PUMA), which are areas
within states of roughly 100,000 people. The 2019 ACS had a housing unit response rate of 86
percent (or 2,599,171 million respondents). 7
Defining Vaccine Hesitancy
We use the HPS survey question, “Once a vaccine to prevent COVID-19 is available to you,
would you…get a vaccine?”, which provides the following options: 1) “definitely get a vaccine”;
2) “probably get a vaccine”; 3) “probably not get a vaccine”; 4) “definitely not get a vaccine.”
We use two definitions to capture the strength of hesitancy to receive a vaccine. We call the
first “Hesitancy,” and it includes survey responses indicating that a person would “probably
not” or “definitely not” receive a COVID-19 vaccine when available. We refer to the second
definition as “Strong Hesitancy,” and it includes include only survey responses indicating that a
person would “definitely not” receive a COVID-19 vaccine when available.
6
U.S. Census Bureau, Source and Accuracy Statements. Household Pulse Survey: March 17, 2021 – March 29,
2021. Available at https://www2.census.gov/programs-surveys/demo/technical-
documentation/hhp/Phase3_Source_and_Accuracy_Week_27.pdf, last accessed May 25, 2021.
7
U.S. Census Bureau, American Community Survey Response Rates,
https://www.census.gov/acs/www/methodology/sample-size-and-data-quality/response-rates/, last accessed May
25, 2021.
May 2021 ISSUE BRIEF 3Our sample includes individuals who responded “yes” or “no” to having received the COVID-19 vaccine and excludes respondents for whom there was no response. Those answering “yes” to having already received the vaccine are therefore treated as “not hesitant,” as are those who responded “definitely” or “probably” as to their intent to get a vaccine. For those who answered “no” to having received the COVID-19 vaccine or who said they do not intend to receive all required doses, the surveys also asks, “Which of the following, if any, are reasons that you [only probably will /probably won’t/definitely won’t] [get a COVID-19 vaccine/won’t receive all required doses of a COVID-19 vaccine]?”. In addition to intent to vaccinate, we also explore reasons provided by respondents for vaccine hesitancy. Predicting Vaccine Hesitancy Rates Our statistical analysis occurred in two steps. First, using the HPS, we used a logistic regression to analyze predictors of vaccine hesitancy using the following sociodemographic and geographic information: age, gender, race/ethnicity, education, marital status, health insurance status, household income, state of residence, and interaction terms between race/ethnicity and having a college degree. Second, we applied the regression coefficients from the HPS analysis to the data from the ACS to predict hesitancy rates for each ACS respondent ages 18 and older. We then averaged the predicted values by the appropriate unit of geography, using the ACS survey weights, to develop area-specific estimates of hesitancy rates. See Appendix 1 for additional methodological information. Results Changes in Vaccine Hesitancy Over Time Figure 1 presents the percentage of those ages 18 years and older who were hesitant about receiving a COVID-19 vaccine between January and March 2021. The percent of respondents indicating they will “definitely not” or “probably not” receive a vaccine, which we classify as being “hesitant,” decreased from 22 percent to 16 percent during this period (p-value
Figure 1. Vaccine hesitancy over time

               Source: ASPE analysis of the Household Pulse Survey for January 6-18, 2021-March 17-29, 2021

Demographic Predictors of Vaccine Hesitancy

Table 1 summarizes hesitancy rates by select demographic characteristics for the HPS survey
administered between January 6-18, 2021 and March 17-29, 2021, and the change between the
two survey periods. 8 There was variation in hesitancy rates when examining groups by gender,
age groups, race/ethnicity and college completion. Hesitancy was slightly higher in women than
men in January but it was about the same in March. In the two survey periods shown, hesitancy
was lowest among those 65 and older and highest among the 25-39 age group. When
examining hesitancy by race/ethnicity, it was lowest among Asian (non-Hispanic) respondents
in both survey periods. Generally, hesitancy rates were higher among those without a college
degree. Assessing the interaction of race and education, the largest gap in hesitancy between
the college and non-college groups was among those in the Other/Multiple Race group.

8
 In Table S-1, we present demographic characteristics of respondents classified as Hesitant and Strongly Hesitant
to take the COVID-19 vaccine in the Household Pulse Survey over time. Table S-1 also presents the demographic
characteristics of the 2019 ACS PUMS to facilitate comparison of the demographic composition of respondents in
the HPS and 2019 ACS PUMS.

    May 2021                                                                                      ISSUE BRIEF   5
Overall, vaccine hesitancy has decreased significantly within nearly all demographic groups over time. The hesitancy rate among women has decreased by 7 percentage points (from 23 percent to 16 percent), compared to a 5 percentage-point decline for men (from 21 percent to 16 percent). Similar declines in hesitancy were observed among the age groups presented, with the greatest decline being observed in those ages 18-24 (from 26 percent to 18 percent). Within race/ethnic groups, hesitancy rates showed the greatest improvement among Black non-Hispanic persons, going from 34 percent to 18 percent (a decrease of 16 percentage points). Table 1. Hesitancy by Demographic Characteristics: January 6-18 vs. March 17-29 Demographic Characteristic Jan 6 - Jan 18 Mar 17 - Mar 29 Net Change Male 21% 16% -5%*** Female 23% 16% -7%*** Age: 18-24 26% 18% -8%*** Age: 25-39 29% 22% -7%*** Age: 40-54 25% 18% -7%*** Age: 55-64 17% 12% -6%*** Age: 65+ 11% 7% -4%*** White (non-Hispanic) 21% 16% -5%*** Black (non-Hispanic) 34% 18% -16%*** Asian (non-Hispanic) 7% 5% -3%*** Other/Multiple Race 32% 24% -8%*** Hispanic 19% 13% -5%*** Non-College White (non-Hispanic) 26% 20% -5%*** College White (non-Hispanic) 11% 8% -3%*** Non-College Black (non-Hispanic) 36% 21% -15%*** College Black (non-Hispanic) 28% 9% -19%*** College Non-College Asian (non-Hispanic) 11% 6% -4%*** College Asian (non-Hispanic) 5% 3% -2%*** Non-College Other/Multiple Race 36% 27% -9%*** College Other/Two-Race 19% 16% -2%*** Non-College Hispanic 20% 14% -6%*** College Hispanic 13% 10% -3%*** Note: Hesitancy is defined to include those who responded, “will definitely not” or “definitely not” intend to receive a COVID-19 vaccine when available. *** p-value < 0.001; ** p-value < 0.01; * p-value < 0.05 of two-tailed t-tests. Source: ASPE analysis of the Household Pulse Survey for January 6-18, 2021-March 17-29, 2021 May 2021 ISSUE BRIEF 6
Changing Patterns of Vaccine Hesitancy Over Time

Table 2 shows the odds ratios from the model used to predict hesitancy for surveys
administered between January 6-18, 2021 and March 17-29, 2021.9 The results indicate that
several factors were significantly associated with higher odds of being hesitant in both time
periods: younger age, lower income, and being uninsured or having Medicaid. People with
college degrees were less likely to be hesitant than those without a degree, and this difference
increased over time for most groups. Patterns by race/ethnicity varied over time, with elevated
hesitancy rates among Blacks compared to Whites in January having disappeared by March.

                     Table 2. Odds Ratios: Factors Associated with Hesitancy Over Time
    Demographic Characteristic                                              Jan 6 – Jan 18     Mar 17 - Mar 29
    Age                            18-24                                         Ref.               Ref.
                                   25-39                                      1.35***             1.48***
                                   40-54                                        1.02                1.06
                                   55-64                                      0.58***             0.54***
                                   65+                                        0.33***             0.27***

    Gender                         Male                                       0.86***               0.98
                                   Female                                        Ref.               Ref.

    Race/Ethnicity                 White (non-Hispanic)                          Ref.               Ref.
                                   Black(non-Hispanic)                        1.28***             0.87***
                                   Hispanic                                   0.54***             0.45***
                                   Asian (non-Hispanic)                       0.31***             0.25***
                                   Other/Multiple race                        1.34***              1.22**

    College * Race/Ethnicity       White(non-Hispanic)                           Ref.               Ref.
                                   Black(non-Hispanic)                        2.18***               1.19
                                   Hispanic                                   1.91***               2.45
                                   Asian, not Hispanic                          1.29*               1.43
                                   Other/Multiple Race                        1.28***               1.74

    Education                      Less than high school                         Ref.               Ref.
                                   High school                                  0.91*              0.89*
                                   Some college                               0.65***             0.64***
                                   College or higher                          0.28***             0.26***

    Marital status                 Married                                       Ref.               Ref.

9
    Table S-2 presents the odds ratios for the regression estimating strong hesitancy.

    May 2021                                                                                 ISSUE BRIEF     7
Table 2. Odds Ratios: Factors Associated with Hesitancy Over Time
Demographic Characteristic Jan 6 – Jan 18 Mar 17 - Mar 29
Widowed 1.07 1.40***
Divorced/Separated 1.39*** 1.18***
Never Married 1.00 0.86***
Missing 1.34 1.15
Health Insurance Private Health Insurance Ref. Ref.
Medicare 0.76*** 1.13*
Medicaid 1.22*** 1.54***
Other Health Insurance 1.43*** 1.58***
Uninsured 1.37*** 1.71***
Missing Health Insurance 1.06 1.08
Income Less than $25,000 Ref. Ref.
$25,000-$35,000 0.91* 0.98
$35,000-$50,000 0.83*** 1.05
$50,000-$75,000 0.82*** 0.89*
$75,000-$100,000 0.97 0.99
$100,000-$150,000 0.80*** 0.85**
$150,000-$200,000 0.65*** 0.83*
More than $200,000 0.46*** 0.63***
Did not report 1.02 1.03
Constant 0.85 0.55***
Notes: Hesitancy is defined to include those who responded, “will definitely not” or “definitely not” intend
to receive a COVID-19 vaccine when available. The model uses state fixed effects. * p < 0.05; ** p < 0.01;
*** pFigure 2. Estimated Hesitancy Rates by County
Note: Hesitancy is defined as those who responded, “probably not” or “definitely not” receive a COVID-19 vaccine
Source: ASPE analysis of Household Pulse Survey for March 17-29, 2021
Reasons for Vaccine Hesitancy
Figure 3 shows the reasons for being hesitant about receiving a COVID-19 vaccine over time.11
About 50 percent cited vaccine safety concerns; at least 20 percent said they didn’t believe they
needed it; and about 30 percent cited lack of trust in vaccines or the government. 12
The percent of respondents who selected the reasons “I plan to wait and see if it is safe and
may get it later”, or “I don’t know if a COVID-19 vaccine will work” has shown the greatest
decrease over time. By contrast, the percent of respondents indicating hesitancy because “I
don’t believe I need a COVID-19 vaccine” has increased by 7 percentage points. Further, the
percent of respondents indicating “I don’t trust COVID-19 vaccines” has steadily increased.
11
Respondents may select multiple reasons for hesitancy to receive the COVID-19 vaccine.
The survey instrument asks, “Which of the following, if any, are reasons that you [only probably will /probably
12
won’t/definitely won’t] get a COVID-19 vaccine?”.
May 2021 ISSUE BRIEF 9In Figures S-1 to S-4, we present the reasons for hesitancy by select demographic characteristics
in March 17-29, 2021. Among those who said they will “probably” or “definitely not” get a
COVID-19 vaccine, those in the 18-25 age group were twice as likely to say they do not believe
they need a COVID-19 vaccine (40 percent) than those 65 and older (19 percent). Men were
more likely than women to cite lack of trust in government as their reason for not wanting a
vaccine (36 percent to 22 percent). Respondents with higher levels of education were more
likely to say they were concerned about possible side effects (57 percent for college graduates
vs. 45 percent for high school graduates and 36 percent for those without a high school
diploma).
Figure 3. Reasons for Hesitancy About Receiving a COVID-19 Vaccine
Note: Respondents may select multiple reasons for hesitancy.
Source: ASPE analysis of Household Pulse Survey, January 6-18 - March 17-29, 2021
Discussion
Since the first COVID-19 vaccine was authorized for emergency use in December 2020, millions
of Americans have been vaccinated against COVID-19. However, despite the strong safety and
efficacy data and increasing vaccination rates (Figure S-6), many Americans remain hesitant to
be vaccinated against COVID-19. Vaccine hesitancy is complex and multifaceted. Many factors
influence vaccine-decision making, including cultural norms, social and peer influences, political
views, and other factors that are specific to an individual or group, as well as concerns
regarding specific vaccines. Our analysis shows that differences in intent to get vaccinated for
May 2021 ISSUE BRIEF 10COVID-19 still exist between racial and ethnic groups, ages, education, socioeconomic status, and geographic areas, though overall hesitancy rates have fallen over the early part of 2021. Other studies have found similar differences in vaccine hesitancy between demographic groups. A December 2020 poll from the de Beaumont Foundation identified the highest rates of vaccine hesitancy among those living in rural communities, Blacks, and Republicans. 13 As COVID-19 vaccines were administered more widely in the early months of 2021, vaccine hesitancy among these groups generally decreased. For example, a recent study showed significant declines in vaccine hesitancy among Black and Hispanic respondents between October 2020 and March 2021.14 However, gaps in vaccine confidence persist among specific demographics. 15,16 Our analysis is consistent with these other findings of vaccine hesitancy presenting differently between racial and ethnic groups, education level, and geographic areas. Encouragingly, intention to get vaccinated is increasing across most groups—and showing the greatest improvement among non-Hispanic Black adults. This trend has been observed in several other recent studies. 17,18 However, there is still a significant percentage of individuals expressing hesitancy to vaccinate. The percentage of respondents indicating that they would “definitely not” get a COVID-19 vaccine, defined in our analysis as “strongly hesitant,” has not changed considerably over time. Other studies have found similar results. For example, a poll by Axios/Ipsos conducted in April 16-19, 2021, concluded that 20 percent of respondents said they are not at all likely to get the vaccine as soon as it is available to them; a number that has 13 de Beaumont Foundation. Poll: The language of vaccine acceptance, available at https://debeaumont.org/changing-the-covid-conversation/vaccineacceptance/; last accessed April 22, 2021. 14 Daly M, Jones A, Robinson E. Public Trust and Willingness to Vaccinate Against COVID-19 in the US From October 14, 2020, to March 29, 2021. JAMA. Published online May 24, 2021. doi:10.1001/jama.2021.8246 15 Hamel, L., Lopes, L., Sparks, G., Stokes, M., Brodie, M. KFF COVID-19 Vaccine Monitor: April 2021. The Kaiser Family Foundation, March 30, 2021. Available at https://www.kff.org/coronavirus-covid-19/poll-finding/kff-covid- 19-vaccine-monitor-april-2021/; last accessed May 19, 2021. 16 Hamel, L., Lopes, L., Kearney, A., Brodie, M. KFF COVID-19 Vaccine Monitor: March 2021. The Kaiser Family Foundation, March 30, 2021. Available at https://www.kff.org/coronavirus-covid-19/poll-finding/kff-covid-19- vaccine-monitor-march-2021/; last accessed April 22, 2021. 17 Funk, C., and Tyson A. Growing share of Americans say they plan to get a COVID-19 vaccine or already have. The Pew Research Center Science & Society, March 5, 2021. Available at https://www.pewresearch.org/science/2021/03/05/growing-share-of-americans-say-they-plan-to-get-a-covid-19- vaccine-or-already-have/; last accessed April 22, 2021. 18 Hamel, L., Lopes, L., Sparks, G., Stokes, M., Brodie, M. KFF COVID-19 Vaccine Monitor: April 2021. The Kaiser Family Foundation, March 30, 2021. Available at https://www.kff.org/coronavirus-covid-19/poll-finding/kff-covid- 19-vaccine-monitor-april-2021/; last accessed May 19, 2021. May 2021 ISSUE BRIEF 11
remained steady since early January 2021.19 Monthly polls administered by the Kaiser Family
Foundation from December 2020 through April 2021 have also shown a steady percentage of
respondents indicating that they would “definitely not” get a COVID-19 vaccine, including when
broken down by race, ethnicity, or political affiliation.20 These results indicate that a subset of
the population is unlikely to accept a COVID-19 vaccine. Therefore, efforts to combat vaccine
hesitancy should be focused on moving those individuals who say that they might receive a
COVID-19 vaccine, sometimes referred to as the “moveable middle,” from being hesitant to
deciding to vaccinate. Beginning in late April, the HPS added an option for respondents to
indicate that they are “unsure” about whether to get a COVID-19 vaccine. This additional
option may better capture the individuals that may most benefit from targeted messaging to
address their reasons for vaccine hesitancy.

Further examination of the underlying reasons for vaccine hesitancy highlights the complexity
of the issue. Our analysis shows that hesitancy due to side effects or a desire to wait and see
how others respond to the vaccine were commonly cited. Moreover, a poll that captured
American’s responses to the Janssen COVID-19 vaccine pause in mid-April 2021 indicates that
American are staying informed about vaccine safety. 21 Other recent work has suggested that
vaccine hesitancy surrounding the Janssen COVID-19 vaccine pause may have impacted some
demographic groups more than others.22 Continuing to monitor the effect of this pause on
vaccine hesitancy among all Americans will be critical to ensure continuing progress in
combating vaccine hesitancy.

Hesitancy to vaccinate, if it continues, threatens the prospects for controlling the pandemic in
the United States. Efforts to combat vaccine hesitancy must be targeted with messages that
resonate with the reasons for hesitancy. Since knowing someone who is vaccinated can also

19
  AXIOS. Axios-Ipsos poll: Americans say J&J pause was the right call. Available at https://www.axios.com/axios-
ipsos-poll-johnson-and-johnson-vaccine-pause-a4eefe38-6aca-4a7e-b1d1-02e1b01a3480.html; last accessed April
22, 2021.

20
  Hamel, L., Lopes, L., Sparks, G., Stokes, M., Brodie, M. KFF COVID-19 Vaccine Monitor: April 2021. The Kaiser
Family Foundation, March 30, 2021. Available at https://www.kff.org/coronavirus-covid-19/poll-finding/kff-covid-
19-vaccine-monitor-april-2021/; last accessed May 19, 2021.

21
  AXIOS. Axios-Ipsos poll: Americans say J&J pause was the right call. Available at https://www.axios.com/axios-
ipsos-poll-johnson-and-johnson-vaccine-pause-a4eefe38-6aca-4a7e-b1d1-02e1b01a3480.html; last accessed April
22, 2021.

22
  Hamel, L., Lopes, L., Sparks, G., Stokes, M., Brodie, M. KFF COVID-19 Vaccine Monitor: April 2021. The Kaiser
Family Foundation, March 30, 2021. Available at https://www.kff.org/coronavirus-covid-19/poll-finding/kff-covid-
19-vaccine-monitor-april-2021/; last accessed May 19, 2021.

 May 2021                                                                                  ISSUE BRIEF     12
result in higher vaccination enthusiasm, 23 identifying trusted messengers at all levels is crucial.
Engaging communities and individuals, especially in minority communities, and developing
communication materials that are culturally, linguistically, and literacy appropriate will help
promote vaccination in communities who are at a higher risk of contracting COVID-19 and
experiencing severe outcomes. 24

Limitations

This analysis does not attempt to include all potential variables that may impact vaccine
hesitancy, and hesitancy is not the sole determinant of vaccination strategy. In other reports,
we have examined access to vaccinations and administration rates across states. 25,26 Thus, our
estimates should be used with caution when attempting to generalize beyond the factors
examined herein. In addition, our estimates should be used in conjunction with other relevant
information. Local contextual information, including trends and data related to vaccine access,
community morbidity and mortality, social vulnerability, and vaccine administration can
provide additional insights and applicability.

Our estimates use individual level responses intended to capture sentiment within different
geographic levels in the U.S. at the time of the survey; careful consideration is advised when
examining questions outside of the time period or geographic level assessed in this analysis.
Our estimates at the PUMA or county level are subject to greater sampling error and
uncertainty due to predictive modeling than those at the state level, and therefore are less
precise; accordingly, they should be used with caution for purposes that require precise
estimates. Due to nonresponse bias, the HPS may not be fully representative of all U.S. adults
and survey-based estimates for vaccination rates may not match data from other sources. A

23
  Hamel, L., Kirzinger, A., Munana, C., Brodie, M. KFF COVID-19 Vaccine Monitor: December 2020. Kaiser Family
Foundation, December 15, 2021. Available at https://www.kff.org/coronavirus-covid-19/report/kff-covid-19-
vaccine-monitor-december-2020/; last accessed April 22, 2021.

24
  Centers for Disease Control and Prevention. Vaccinate with confidence. CDC’s strategy to reinforce confidence in
COVID-19 vaccines, December 12, 2020. Available at https://www.cdc.gov/vaccines/covid-
19/downloads/vaccinate-with-confidence.pdf; last accessed April 22, 2021.

25
  Kolbe, A. Factors influencing variation between states in efficiency of COVID-19 vaccine administration.
Washington, DC: Office of the Assistant Secretary for Planning and Evaluation, U.S. Department of Health and
Human Services. April 2021. Available at https://aspe.hhs.gov/pdf-report/covid-19-vaccine-administration; last
accessed May 25, 2021.

26
  Kolbe, A. Disparities in COVID-19 Vaccination Rates across Racial and Ethnic Minority Groups in the United
States. Washington, DC: Office of the Assistant Secretary for Planning and Evaluation, U.S. Department of Health
and Human Services. April 2021. Available at https://aspe.hhs.gov/pdf-report/covid-19-vaccination-disparities; last
accessed May 25, 2021.

 May 2021                                                                                   ISSUE BRIEF      13
full discussion of limitations associated with the HPS can be found in the survey’s technical
documentation. 27 Finally, the Household Pulse Survey instrument changed in late April by
adding the option “unsure” regarding vaccination intent. In that wave of the survey, about 6.7
percent of the respondents answered that they were “unsure”, which was largely offset by
reductions in the responses “probably” or “probably not” (see Figure S-7). This Issue Brief
compares vaccine hesitancy for January vs. March, so it was unaffected by that change, but any
comparison of data from before and after April 14, 2021 would likely be biased by this survey
change.

Conclusions

Overcoming vaccine hesitancy is essential to slowing transmission of SARS-CoV-2. Our
analysis shows hesitancy around COVID-19 vaccines is a significant challenge for public health
but also a complex and multi-faceted issue. Continued monitoring of vaccine hesitancy over
time is critical for policy decision makers to adjust the communication strategies, including
the methods, language and messengers, to improve confidence in COVID-19 vaccines.

27
  U.S. Census Bureau. Household Pulse Survey Technical Documentation. Available at
https://www.census.gov/programs-surveys/household-pulse-survey/technical-documentation.html; last accessed
May 20, 2021.

 May 2021                                                                             ISSUE BRIEF    14
Appendix 1: Methodology

We use the U.S. Census Bureau’s Household Pulse Survey (HPS) and the 2019 American Community
Survey (ACS). The HPS is designed to capture household experiences during the coronavirus pandemic.4
We use seven waves of the HPS Phase 3 public use files beginning in January 6-18, 2021 through March
17-29, 2021. The collection period of January 6-18, 2021 was the first wave in which the survey
instrument asked about an individual’s intention to receive a COVID-19 vaccine. 28 HPS also includes
other sociodemographic information such as gender, age, household income, race/ethnicity,
educational level, insurance coverage and location of residence (state, region, and metropolitan and
micropolitan statistical areas). The ACS is a household survey that captures social, housing and economic
information. Like the HPS, the ACS also includes information on gender, age, educational attainment,
household income, race/ethnicity, and insurance coverage. In addition to state and region information,
the ACS provides smaller geographic areas such as public use microdata areas (PUMAs). 29 To create
county-level estimates, we used a PUMA-to-county crosswalk from the Missouri Census Data Center.
PUMAs spanning multiple counties had their estimates apportioned across those counties based on
overall 2010 Census populations. We use the appropriate survey weights to produce summary statistics
and to estimate the regression model.

We use a binary logistic regression model characterized by equation (1) to obtain hesitancy estimates in
each wave:

       (1) logit(Hi,k =1|X,Z)=α+βX+ s.

In equation (1), Hi is equal to one if respondent i in wave k indicated that they would “definitely not” or
“probably not” get the COVID-19 vaccine and zero if the response is “definitely”, “probably”, and “yes”.
X is a set of sociodemographic characteristics for respondent i in wave k: age (18-24, 25-39 40-54, 55-64,
65+), gender, race/ethnicity (Hispanic, non-Hispanic White, non-Hispanic Black, non-Hispanic Asian, and
Other/Multiple Race), education (less than high school, high school, some college, college or higher),
marital status (married, widowed, divorced or separated, never married, missing), health insurance
status (employer-sponsored, nongroup private, Medicare, Medicaid, military, Veterans Affairs, Indian
Health Services, Other, uninsured, missing), and household income. To examine whether college
education has varying impacts on individual’s intention to vaccinate, the model considers the interaction
between race/ethnicity and college attainment. The model also includes state indicators, s, to capture
time-invariant state-specific attitudes or patterns.

We estimated equation (1) separately for different waves of the HPS (in sample) data by state and then
use the estimated coefficients in each wave to predict hesitancy rates in the 2019 ACS (out of sample) by
PUMAs and counties. This process results in estimated hesitancy rates for each wave that can be used to
examine trends over time.

28
     Specifically, the question is “Once a vaccine to prevent COVID-19 is available to you, would you … get a vaccine?”

29
  PUMAs represent the most granular level of geography available in the ACS public use file. PUMAs are defined
as areas that contain no fewer than 100,000 people.

 May 2021                                                                                       ISSUE BRIEF      15
Appendix 2. Supplementary Analysis
Table S-1. Comparison of Demographic Characteristics of Respondents Classified as
Hesitant and Strongly Hesitant to Take COVID-19 Vaccine in the Household Pulse Survey
Household Pulse Survey 2019 ACS
Demographic Characteristic
Mar 17 - Mar 29 PUMS
All Hesitant Strongly Hesitant All
Age 18-24 9% 10% 11% 12%
25-39 27% 37% 38% 26%
40-54 26% 30% 28% 24%
55-64 17% 13% 14% 17%
65+ 22% 9% 9% 21%
Gender Male 48% 48% 45% 49%
Female 52% 52% 55% 51%
Race/Ethnicity White (non-Hispanic) 62% 65% 62% 63%
Black (non-Hispanic) 11% 13% 15% 12%
Asian (non-Hispanic) 5% 2% 2% 6%
Other/Multiple race 4% 6% 6% 3%
Hispanic 17% 15% 16% 16%
Education Less than high school 9% 12% 11% 11%
High school 30% 40% 37% 28%
Some college 30% 33% 34% 22%
College or higher 30% 15% 18% 39%
Marital status Married 54% 48% 47% 50%
Widowed 4% 4% 4% 6%
Divorced/Separated 13% 16% 15% 13%
Never Married 27% 32% 34% 31%
Missing Marital Status 1% 1% 1% 0%
Private Health
Insurance 55% 46% 47% 67%
Insurance
Medicare 8% 5% 5% 12%
Medicaid 5% 9% 8% 9%
Other Health
2% 2% 2% 2%
Insurance
Uninsured 6% 10% 9% 10%
Missing Health
26% 28% 28% 0%
Insurance
Income Less than $25,000 10% 13% 13% 12%
$25,000-$35,000 7% 9% 9% 7%
$35,000-$50,000 8% 9% 10% 11%
$50,000-$75,000 13% 12% 12% 17%
$75,000-$100,000 9% 8% 8% 14%
$100,000-$150,000 11% 8% 9% 18%
May 2021 ISSUE BRIEF 16Table S-1. Comparison of Demographic Characteristics of Respondents Classified as
Hesitant and Strongly Hesitant to Take COVID-19 Vaccine in the Household Pulse Survey
Household Pulse Survey 2019 ACS
Demographic Characteristic
Mar 17 - Mar 29 PUMS
$150,000-$200,000 5% 3% 3% 9%
More than $200,000 6% 2% 2% 10%
Missing 32% 35% 33% 3%
Source: ASPE Analysis of the Household Pulse Survey for March 17-29, 2021 and the 2019 ACS PUMS
May 2021 ISSUE BRIEF 17Table S-2. Odds Ratios: Factors Associated with Strong Hesitancy Over Time
Household Pulse Survey
Demographic Characteristic Jan 6 – Jan 18 Mar 17 - Mar 29
Age 18-24 Ref. Ref.
25-39 1.34*** 1.55***
40-54 1.03 1.27*
55-64 0.65*** 0.59***
65+ 0.34*** 0.34***
Gender Male 0.93* 1.14***
Female Ref. Ref.
Race/Ethnicity White (non-Hispanic) Ref. Ref.***
Black (non-Hispanic) 1.1 0.71***
Hispanic 0.47*** 0.40***
Asian (non- Hispanic) 0.21*** 0.24***
Other/Multiple race 1.27*** 0.98
College * Race/Ethnicity White (non-Hispanic) Ref. Ref.
Black (non-Hispanic) 1.75*** 0.89
Hispanic 2.62*** 3.03***
Asian (non-Hispanic) 1.55* 1.02
Other/Multiple race 1.62*** 2.20***
Education Less than high school Ref. Ref.
High school 0.76*** 0.86*
Some college 0.55*** 0.61***
College or higher 0.22*** 0.22***
Marital status Married Ref. Ref.
Widowed 1.23* 1.31**
Divorced/Separated 1.28*** 1.14**
Never Married 1.04 0.78***
Missing 2.19*** 1.08
Health Insurance Private Health Insurance Ref. Ref.
Medicare 0.78** 0.92
Medicaid 1.32*** 1.46***
Other Health Insurance 1.56*** 1.44***
Uninsured 1.61*** 1.86***
Missing Health Insurance 1.07 0.86*
May 2021 ISSUE BRIEF 18Table S-2. Odds Ratios: Factors Associated with Strong Hesitancy Over Time
Household Pulse Survey
Demographic Characteristic Jan 6 – Jan 18 Mar 17 - Mar 29
Income Less than $25,000 Ref. Ref.
$25,000-$35,000 0.90 0.88
$35,000-$50,000 0.73*** 0.93
$50,000-$75,000 0.68*** 0.83**
$75,000-$100,000 0.90* 0.94
$100,000-$150,000 0.66*** 0.74***
$150,000-$200,000 0.62*** 0.73*
More than $200,000 0.46*** 0.7**
Did not report 1.03 1.22*
Constant 0.27*** 0.22***
Notes: Strong Hesitancy is defined to include those who responded, “definitely not” intend to receive a
COVID-19 vaccine when available. The model uses state fixed effects. * p < 0.05; ** p < 0.01; *** pFigure S-1. Reasons for Hesitancy by Age
Note: Respondents may select multiple reasons for hesitancy.
Source: ASPE analysis of Household Pulse Survey, March 17-29, 2021
May 2021 ISSUE BRIEF 20Figure S-2. Reasons for Hesitancy by Race/Ethnicity
Note: Respondents may select multiple reasons for hesitancy.
Source: ASPE analysis of Household Pulse Survey, March 17-29, 2021
May 2021 ISSUE BRIEF 21Figure S-3. Reasons for Hesitancy by Education
Note: Respondents may select multiple reasons for hesitancy.
Source: ASPE analysis of Household Pulse Survey, March 17-29, 2021
May 2021 ISSUE BRIEF 22Figure S-4. Reasons for Hesitancy by Gender
Note: Respondents may select multiple reasons for hesitancy.
Source: ASPE analysis of Household Pulse Survey, March 17-29, 2021
May 2021 ISSUE BRIEF 23Figure S-5. Estimated hesitancy rates by PUMAs
Note: Hesitancy is defined as those who responded, “probably not” or “definitely not” receive a COVID-19 vaccine
Source: ASPE analysis of Household Pulse Survey for, March 17-29, 2021
May 2021 ISSUE BRIEF 24Figure S-6. The percent of U.S. adults 18 years and older who reported being vaccinated for
COVID-19 over time
Note: Includes U.S. adults 18 years and older who have received at least one dose of a COVID-19 vaccine
Source: ASPE analysis of the Household Pulse Survey, January 6-18, 2021-March 17-29, 2021
May 2021 ISSUE BRIEF 25Figure S-7. The percent of U.S. adults 18 years and older who reported being vaccinated for
COVID-19 over time
Note: Includes U.S. adults 18 years and older who have received at least one dose of a COVID-19 vaccine
Source: ASPE analysis of the Household Pulse Survey, January 6-18, 2021- April 28-May 10, 2021
May 2021 ISSUE BRIEF 26U.S. DEPARTMENT OF HEALTH AND HUMAN SERVICES Office of the Assistant Secretary for Planning and Evaluation 200 Independence Avenue SW, Mailstop 434E Washington, D.C. 20201 For more ASPE briefs and other publications, visit: aspe.hhs.gov/reports ABOUT THE AUTHORS Trini Beleche is a Senior Economist in the Office of Science and Data Policy at ASPE. Joel Ruhter is an Analyst in the Office of Health Policy at ASPE. Allison Kolbe is a Management and Program Analyst in the Office of Science and Data Policy at ASPE. Jessica Marus is a Public Health Analyst in the Office of Science and Data Policy at ASPE. Laina Bush is the Deputy Assistant Secretary, Science and Data Policy, at ASPE. Benjamin D. Sommers is the Deputy Assistant Secretary, Health Policy, at ASPE. SUGGESTED CITATION Beleche, T., Ruhter, J., Kolbe, A., Marus, J., Bush, L., and Sommers, B. COVID-19 Vaccine Hesitancy: Demographic Factors, Geographic Patterns, and Changes Over Time. Washington, DC: Office of the Assistant Secretary for Planning and Evaluation, U.S. Department of Health and Human Services. May 2021. COPYRIGHT INFORMATION All material appearing in this report is in the public domain and may be reproduced or copied without permission; citation as to source, however, is appreciated. ___________________________________ For general questions or general information about ASPE: aspe.hhs.gov/about May 2021 ISSUE BRIEF 27
You can also read