FIRST QUARTER 2020 EARNINGS - MGM RESORTS INTERNATIONAL - APRIL 30, 2020
←
→
Page content transcription
If your browser does not render page correctly, please read the page content below
MGM RESORTS INTERNATIONAL
FIRST QUARTER 2020 EARNINGS

        APRIL 30, 2020
        MGM RESORTS I NTERNATIONAL
F O R WA R D - L O O KI N G S T A T E M E N T S
Statements in this presentation that are not historical facts are forward-looking statements, within the meaning of the Private Securities Litigation Reform Act of 1995 and involve risks and/or uncertainties, including
those described in the Company's public filings with the Securities and Exchange Commission. The Company has based forward-looking statements on management’s current expectations and assumptions and
not on historical facts. Examples of these statements include, but are not limited to, the Company’s expectations regarding its financial outlook (including estimated cash outflows while the Company’s properties
remain closed), the timing, strategy and plans to reopen the Company’s domestic properties, the impact of the COVID-19 pandemic on its business, any benefits the Company expects to receive from the CARES
Act, the closing of the recent senior notes offering, its ability to achieve the expected benefits from its strategic plans, including its asset-light strategy and the MGM 2020 plan, and its ability to execute on its long
term strategic objectives, including its ability to return value to shareholders. These forward-looking statements involve a number of risks and uncertainties. Among the important factors that could cause actual
results to differ materially from those indicated in such forward-looking statements include the continued impact of the COVID-19 pandemic, effects of economic conditions and market conditions in the markets in
which the Company operates and competition with other destination travel locations throughout the United States and the world, the design, timing and costs of expansion projects, risks relating to international
operations, permits, licenses, financings, approvals and other contingencies in connection with growth in new or existing jurisdictions and additional risks and uncertainties described in the Company’s Form 10-K,
Form 10-Q and Form 8-K reports (including all amendments to those reports). In providing forward-looking statements, the Company is not undertaking any duty or obligation to update these statements publicly as
a result of new information, future events or otherwise, except as required by law. If the Company updates one or more forward-looking statements, no inference should be drawn that it will make additional
updates with respect to those other forward-looking statements.

                                                                                 M A R KE T A N D I N D US T R Y D A T A
This presentation also contains estimates and information concerning the Company’s industry that are based on industry publications, reports and peer company public filings. This information involves a number
of assumptions and limitations and you are cautioned not to rely on or give undue weight to this information. The Company has not independently verified the accuracy or completeness of the data contained in
these industry publications, reports or filings. The industry in which we operate is subject to a high degree of uncertainty and risk due to a variety of factors, including those described in the “Risk Factors” section of
the Company’s public filings with the SEC.

                                        N O T E R E G A R D I N G P R E S E N T A T I O N O F N O N - G A A P F I N A N C I A L M E A S UR E S
This presentation includes certain “non-GAAP financial measures” as defined in Regulation G under the Securities Exchange Act of 1934, as amended, including, among others, Adjusted EBITDAR, Adjusted Property
EBITDAR, and Adjusted EPS. Schedules that reconcile the non-GAAP financial measures to the most directly comparable financial measures calculated and presented in accordance with Generally Accepted
Accounting Principles in the United States are included herein or in the Company’s earnings releases that have been furnished with the SEC and are available on our website at www.mgmresorts.com. In addition,
this presentation includes Table Games Hold Adjusted Las Vegas Strip Resorts Net Revenues and VIP Table Games Hold Adjusted MGM China Net Revenues. A reconciliation of these non-GAAP results is provided
in the Company’s earnings releases.

  MGM RESORTS I NTERNATIONAL                                                                                                                                                                                                    2
• COVID-19 Update

                      TABLE OF   • 1Q 2020 Financial Results
                     CONTENTS
                                 • Appendix

MGM RESORTS I NTERNATIONAL                                     3
KEY TAKEAWAYS
  1Q 2020 Results:
  • U.S. – Strong performance during January and February driven by healthy topline performance and MGM 2020 efficiency gains, followed
    by property closures in mid-March
  • Macau – Earlier timing of COVID-19 cases in the region had a greater impact on 1Q 2020 performance, despite a strong start to the year

  COVID-19 situation overview:
  • The health and safety of our employees and guests is our top priority
  • We are committed to ensuring our communities are strong and have recently focused our philanthropic efforts on COVID-19 relief
    initiatives for impacted employees and our local communities
  • We have aggressively managed our cash outflows (excluding MGM China and MGP) down to approximately $270 million per month 1
    while our properties are closed, implying well over 1 year of liquidity buffer
  • We have a strong liquidity position with $7.2 billion2 of consolidated liquidity, or $4.6 billion3 excluding MGM China and MGM Growth
    Properties (“MGP”)

  Reopening strategy:
  • We cannot predict the timing of our opening dates, and will reopen when it is prudent and pursuant to state and local government
    requirements
  • We will develop and execute safety protocols in-line with government guidelines and in consultation with health experts
  • We expect to implement a phased reopening strategy based on expectations for demand, ramp up speed, and cash outflow minimization
    by specific property and region, while balancing the needs of our employees, local regulators and other stakeholders

                                    1 Cash outflows represent an estimate based on expected net rent, interest, corporate and operating expenses and expected capit al expenditures. The estimate is based on current
                                    expectations and assumptions and the actual level of cash outflows could be impacted by unanticipated developments or events beyond our control
MGM RESORTS I NTERNATIONAL          2 Cash and equivalents of $6.0 billion as of March 31, 2020, adjusted for $742 million of expected net proceeds from issuance of $750 million 6.750% senior notes due 2025 and $424 million
                                                                                                                                                                                                                                  4
                                    available under MGM China’s revolving credit facility. The notes offering is expected to close on May 4, 2020, subject to customary closing conditions
                                    3 Cash and equivalents of $3.9 billion as of March 31, 2020, adjusted for $742 million of expected net proceeds from issuance of $750 million 6.750% senior notes due 2025
COVID-19 SUPPORT | U.S.
People First
The Company, our employees and our partners collectively raised $12.8 million $12.8 MILLION
for the Employee Emergency Grant Fund to provide relief for employees and Raised for
immediate families in need employee relief fund
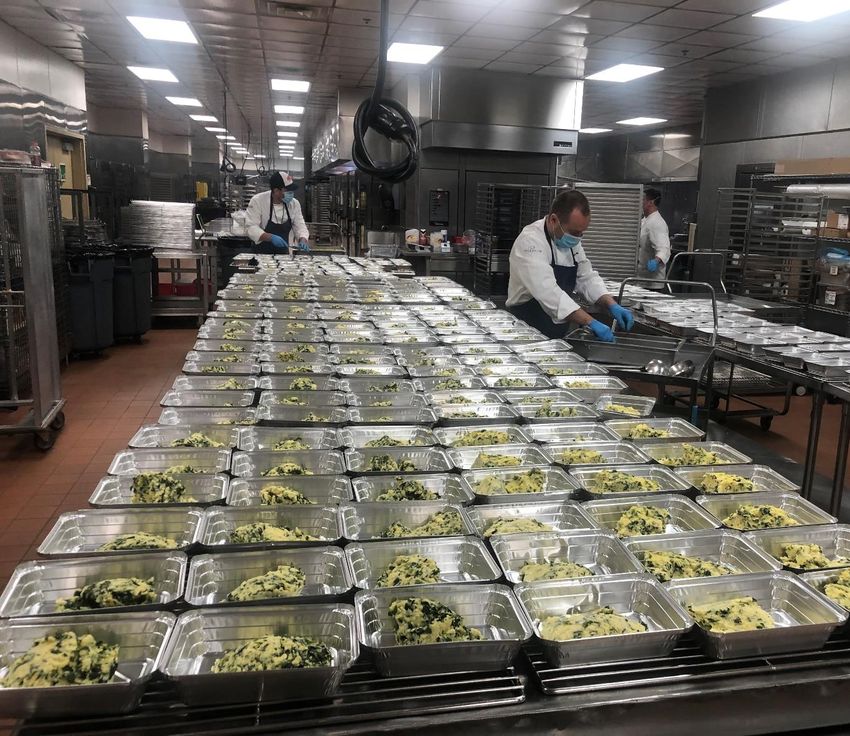
Food and Product Donations 500,000+
equivalent meals donated
MGM Resorts has given over $1 million in food and products to local
communities across the U.S., which includes donation for grocery packages,
food produce, and meals to the homeless and underserved
1,000 hot meals daily
from Aria and Bellagio
logistics/storage for
State of Nevada COVID-19 Task Force 250,000
MGM Resorts leveraged its procurement and logistics expertise to help with rapid PCR COVID-19 test kits
transportation and storage of 250,000 rapid PCR COVID-19 tests
The Company also donated PPE from its existing supplies to Las Vegas area 1 MILLION+
hospitals units of PPE
(sourcing/in production/transported/distributed)
MGM RESORTS I NTERNATIONAL 5
COVID-19 SUPPORT | MACAU

      Cash Donation to Hubei, China
                                                                                             •   Association of Parents of the People
                                                                                                 with Intellectual Disabilities of Macau
       USD $2.5 million                                                                      •
                                                                                             •
                                                                                                 Caritas Macau
                                                                                                 Concordia School for Special
       2020 Donation                                                                             Education
                                                                                             •   Federation of Trade Unions of Macau
                                                                                             •   Fuhong Society of Macau
                                                                                             •   General Union of Neighborhood
       Personal Protective Equipment Donations                                                   Associations of Macau
                                                                                             •   Hubei Charity General Association
                                                                                                 Macau Association of Support for the
                                        6,000+                       8,000
                                                                                             •
       645,000                                                                               •
                                                                                                 Disabled
                                                                                                 Macau Holy House of Mercy
       Surgical Masks                   Bottles of Hand Sanitizer    Disposable   Caps       •   Macau Secretary for Social Affairs
                                                                                                 and Culture
                                                                                             •   Macau Special Olympics
                                                                                             •   People. CN
      Community Support Initiatives                                                          •   S.K.H Macau Social Services Office
                                                                                             •   The Macau Association for the

       600+                              2,200                        58
                                                                                                 Mentally Handicapped
                                                                                             •   Tung Sin Tong
                                                                                             •   Women's General Association of
       Small to Mid Enterprises         Care Packages for Elderly,    Temperature Checking       Macau
       Receiving Support and Services   Families, Low Income, and     Robots / Temperature
       from MGM China                   Children in Need              Detectors

MGM RESORTS I NTERNATIONAL                                                                                                                 6
CARING FOR ONE ANOTHER

MGM RESORTS I NTERNATIONAL                       7
COVID-19 SITUATION OVERVIEW | U.S.

      MARCH 11                     MARCH 13              MARCH 14               MARCH 15               MARCH 16                MARCH 17

   The WHO declares             MGM Northfield           Empire City         MGM Springfield,        MGM Grand Detroit       All Mississippi
   COVID-19 a global             Park closes            Casino closes       and MGM National         and Borgata close      and Las Vegas
       pandemic                                                               Harbor close                                  properties close

   • As of March 17, 2020, all of our domestic properties have temporarily closed, and remain closed pursuant to state and local
     government requirements. In certain jurisdictions such as Las Vegas, the Company made the proactive decision to close prior
     to government mandates in light of the public health crisis

   • Immediate formation of task force in mid-January to:
      ➢ Execute property closings, cost cutting efforts, initiation of work from home protocols, maintain communications with stakeholders
      ➢ Develop and implement reopening plan based on key criteria including a macro assessment of COVID-19 trends, demand
        expectations, implementation of safety protocols, and minimizing cost outflows
      ➢ Determine enterprise-wide strategy to adapt to a changing business landscape post-COVID-19

   • Our first quarter results were significantly impacted by the COVID-19 pandemic, and we continue to be impacted today

   • In Las Vegas, we have experienced high levels of room and convention cancellations through the third quarter of 2020 with
     some tentative re-bookings in the fourth quarter and into 2021. There have not been meaningful cancellations for 2021
     related to the COVID-19 pandemic

   • We continue to believe that Las Vegas will remain a major long term business and tourism destination
MGM RESORTS I NTERNATIONAL                                                                                                                     8
COVID-19 SITUATION OVERVIEW | MACAU
LATE JANUARY FEBRUARY 4 FEBRUARY 5-19 FEBRUARY 20 MARCH 6 MID MARCH
China implements Hong Kong SAR Macau casinos MGM Macau and MGM Macau discharges Macau, Hong Kong and
temporary suspension of government are closed for Cotai reopen, with social last patient, No new China implement 14-day
tour groups on Jan 24 shuts down ferry 15-day period distancing and other cases in more than quarantine measures
and IVS on Jan 28 terminal safety protocols in place a month due to increasing
imported cases
• Beginning February 5, 2020 all the Macau properties were closed for a 15-day period. MGM Macau and MGM Cotai reopened
on February 20, 2020
• MGM China’s first quarter results were significantly impacted by the COVID-19 pandemic and they continue to be impacted
today
• The Macau market continues to experience low visitation levels primarily driven by various travel restrictions and
quarantine measures in Mainland China and Hong Kong. This is evidenced by the market’s significant GGR declines:
➢ Macau GGR declined 88% and 80% year over year in February and March, respectively
➢ Consensus April GGR expected to be down approximately 90% year over year1
• Future easing of current border restrictions will serve as a catalyst for market rebound given strong long term demand
MGM RESORTS I NTERNATIONAL 1 Sellside analysts’ research
91Q 2020 MONTHLY TRENDS
($ in millions) January February March Total
Las Vegas Strip Resorts
Net Revenue $474 $462 $198 $1,134
Adjusted Property EBITDAR $149 $148 ($29) $268
Adjusted Property EBITDAR Margin 31% 32% NM 24%
Regional Operations
Net Revenue $294 $302 $130 $726
Adjusted Property EBITDAR $75 $92 ($15) $152
Adjusted Property EBITDAR Margin 25% 30% NM 21%
MGM China
Net Revenue $207 $15 $50 $272
Adjusted Property EBITDAR $43 ($40) ($25) ($22)
Adjusted Property EBITDAR Margin 21% NM NM NM
Note: Adjusted Property EBITDAR is the Company’s primary profit measure for its reportable segments
MGM RESORTS I NTERNATIONAL 10MANAGING OUR CASH OUTFLOWS
DOMESTIC OPERATIONS: MGM RESORTS CASH OUTFLOW1,2
(EXCLUDING MGM CHINA AND MGP)
• With our U.S. properties currently closed, excluding MGM China and MGP, the
Company’s monthly net cash outflow is estimated to be approximately $270 million1 ($ in millions) Per month
• Reduced property level operating expenses and corporate expense Domestic property operating expenses ~$110
➢ Hiring freezes, furloughs of employees, and cancellation of merit pay increases Corporate expense ~$21
➢ Program for senior executives and directors to take restricted stock units in lieu of cash as salary for remainder of 2020
➢ 60-70% of our property-level operating expenses are variable, and we have reduced the majority of these costs Other EBITDAR items ~$9
➢ Also reduced fixed property-level operating expenses and corporate expense
Rent, including ground leases $115
• Deferred or reduced at least 50% of our 2020 domestic capital expenditures
MGP and BREIT distributions to MGM Resorts ($32)
• Other notable cash outflow items include rental payments to MGP and Blackstone Capital expenditures $17
ventures, net of REIT distributions to MGM Resorts, and cash interest expense
Interest and other ~$30
• Starting in 2Q 2020, reduced MGM Resorts quarterly dividend to $0.0025/share Total cash outflow ~$270
(~$73 million of savings per quarter)
MACAU OPERATIONS:
• Our Macau properties are incurring cash operating expenses3 of approximately $1.5 million per day, which is significantly in excess of
amounts being earned at those properties
1 Inclusive of estimated net rent, interest, corporate and operating expenses and expected capital expenditures. The estimate is based on current expectations and assumptions and the
MGM RESORTS I NTERNATIONAL actual level of cash outflows could be impacted by unanticipated developments or events beyond our control
2 Estimated cash outflow during property closures
11
3 Exclusive of rent, interest, variable gaming taxes, corporate expense and expected capital expendituresOUR LIQUIDITY POSITION IS STRONG
Excluding MGM China and MGP, the Company has $4.6 billion1 of liquidity, adjusted for our recent senior notes offering
(implying well over 1 year of cushion during closure scenario)
MGM Resorts MGM Resorts
($ in millions) (Ex. MGM China and MGP) MGM China MGP Consolidated
Cash and Equivalents1 $4,615 $381 $1,762 $6,758
Revolver Availability $0 $424 $0 $424
Total Liquidity $4,615 $805 $1,762 $7,182
• Adjusted for our recent $750 million senior notes offering, MGM Resorts (consolidated) has $7.2 billion1 of liquidity
• As of March 31, 2020, MGM China had $805 million of liquidity, including $424 million available under its $1.25 billion revolver
• MGM Resorts currently has additional real estate and other holdings, including:
➢ Agreement with MGP to redeem operating partnership units for up to $1.4 billion cash, which has not yet been exercised
➢ The remaining economic interest in MGP
➢ MGM Springfield
➢ 50% interest in CityCenter in Las Vegas
➢ 56% stake in MGM China
1Cash and equivalents as of March 31, 2020. MGM Resorts excluding MGM China and MGP cash and equivalents of $3.9 billion as of March 31, 2020, adjusted for $742 million of
MGM RESORTS I NTERNATIONAL expected net proceeds from issuance of $750 million 6.750% senior notes due 2025. Consolidated cash and equivalents of $6.0 billion as of March 31, 2020, adjusted for $742 million of
expected net proceeds from issuance of $750 million 6.750% senior notes due 2025. The $750 million offering of 6.750% senior notes due 2025 is expected to close on May 4, 2020, subject 12
to customary closing conditionsSOLID DEBT PROFILE
Excluding MGM China and MGP, the Company has approximately $6.2 billion1 of debt, adjusted for our recent senior notes
offering, with no near term maturities
MGM RESORTS (EXCLUDING MGM CHINA AND MGP) – DEBT MATURITY PROFILE CONSOLIDATED DEBT OVERVIEW1,2
$ in millions
($ in millions) Debt
Revolving Credit Facility Outstandings Senior Notes New $750mm Senior Notes
MGM Resorts (Ex. MGM China and MGP)1 $6,240
$750
MGM China $2,326
$675
NO MATURITIES MGP $4,000
UNTIL 2022
$1,250 $1,500 MGM Resorts Consolidated2 $12,565
$1,000 $675
$400
2020 2021 2022 2023 2024 2025 2026 2027
• Adjusted for our recent $750 million senior notes offering, MGM Resorts (consolidated) has $12.6 billion 2 of debt
• On April 29, 2020, MGM Resorts entered into an amendment to its credit agreement ($1.5 billion revolver) that would provide us with a
waiver of our financial maintenance covenants from 2Q 2020 through 2Q 2021, among other changes
• Effective April 9, 2020 MGM China entered into a further amendment to its credit agreement ($1.25 billion revolver) that provided for a
waiver of its financial maintenance covenants through 2Q 2021
MGM RESORTS I NTERNATIONAL 1
2
MGM Resorts excluding MGM China and MGP debt of $5.5 billion as of March 31, 2020, adjusted for the issuance of $750 million 6.750% senior notes due 2025
Consolidated debt of $11.8 billion as of March 31, 2020, adjusted for the issuance of $750 million 6.750% senior notes due 2025 13
Note: The $750 million offering of 6.750% senior notes due 2025 is expected to close on May 4, 2020, subject to customary closing conditionsFOCUSED ON REOPENING STRATEGY
• We cannot predict the timing of our opening dates, and will reopen when it is prudent. Opening is also subject to
government approval
• We are working with government authorities and health experts in establishing the reopening criteria and methodologies
• Once opened, we expect a faster recovery in Macau, followed by our regional properties and then Las Vegas
• In Las Vegas, we currently expect a phased opening approach, in both the number of properties and amenities offered
• Our reopening strategy will be determined by the following:
➢ The needs of our employees, local regulators and other stakeholders
➢ Safety protocols in place to ensure well-being of employees and guests, and follow social distancing / enhanced
sanitization measures
➢ Expected market demand and ramp outlook
➢ Analysis of potential occupancy levels
➢ Mitigating cash outflows
➢ Macro and micro trends including consumer sentiment and travel patterns
➢ Learnings from MGM China’s reopenings
MGM RESORTS I NTERNATIONAL 14OUR LONG-TERM STRATEGIC OBJECTIVES
MAXIMIZE OPERATING DISCIPLINED CAPITAL FUTURE GROWTH
REAL ESTATE STRATEGY
EFFICIENCIES ALLOCATION OPPORTUNITIES
Focus Areas: Focus Areas: Focus Areas: Focus Areas:
Monetize real estate and
MGM 2020 Phase I and
other holdings at attractive Strengthen balance sheet Japan & Macau
beyond
multiples
Allow for recycling of capital Continue to reduce costs Prudent level of capital Sports betting
into higher ROI areas and improve margins expenditures and online gaming
Goal is to simplify our Improved focus and Return capital to MGM 2020 Plan – Phase II:
corporate structure execution on major initiatives shareholders1 Business Transformation
MGM RESORTS I NTERNATIONAL 1 Long-term objective
15• COVID-19 Update
TABLE OF • 1Q 2020 Financial Results
CONTENTS
• Appendix
MGM RESORTS I NTERNATIONAL 161Q 2020 FINANCIAL HIGHLIGHTS
$ in U.S. millions, except per share information
1Q19 1Q20 $ Change % Change
Consolidated Net Revenue $3,177 $2,253 ($924) (29%)
Las Vegas Strip Resorts $1,428 $1,134 ($294) (21%)
Regional Operations $804 $726 ($78) (10%)
MGM China $734 $272 ($462) (63%)
Net Income (Loss) Attributable to MGM Resorts1 $31 $807 $776 NM
Diluted Earnings (Loss) Per Share1 $0.05 $1.64 $1.59 NM
Adjusted EPS1 $0.14 ($0.45) ($0.59) NM
Consolidated Adjusted EBITDAR $748 $295 ($453) (61%)
Las Vegas Strip Resorts Adjusted Property EBITDAR $404 $268 ($136) (34%)
Table Games Hold Adjusted Las Vegas Strip Resorts
$408 $273 ($135) (33%)
Adjusted Property EBITDAR
Regional Operations Adjusted Property EBITDAR $212 $152 ($60) (28%)
MGM China Adjusted Property EBITDAR $193 ($22) ($215) NM
CityCenter Adjusted EBITDA $114 $79 ($36) (31%)
MGM RESORTS I NTERNATIONAL 1 The current year quarter included a $1.5 billion pre-tax gain related to the MGM Grand Las Vegas and Mandalay Bay real estate transaction
17FIRST QUARTER 2020 – LAS VEGAS STRIP
LAS VEGAS STRIP1
Actual YoY Change Hold Adjusted YoY Change
Net Revenues $1.13 billion (21%) $1.14 billion (20%)
Adjusted Property EBITDAR $ $268 million (34%) $273 million (33%)
Adjusted Property EBITDAR Margin 23.6% (466 bps) 24.0% (450 bps)
RevPAR2 $160 3%
• Results were primarily impacted by year over year declines in March, which offset year over year net revenue and Adjusted Property EBITDAR growth of
2% and 24%, respectively, for the first two months of the quarter
• Excluding Circus Circus Las Vegas, which was sold in December 2019, year over year declines in March offset year over year net revenue and Adjusted
Property EBITDAR growth of 6% and 27%, respectively, for the first two months of the quarter
• Excluding Circus Circus Las Vegas:
➢ Net revenues decreased 17%
o Casino revenues decreased 12% year over year, due primarily to decreases in March which offset a 16% increase in the first two months of the quarter
o Non-gaming revenues decreased 19% year over year, due primarily to decreases in March which offset a 4% increase in the first two months of the quarter
➢ REVPAR decreased 3%
➢ Adjusted Property EBITDAR decreased 32%
➢ Table Games Hold Adjusted Property EBITDAR decreased 31%
MGM RESORTS I NTERNATIONAL 1 Excludes CityCenter
18
2 RevPAR is hotel revenue per available room. For the three months ended March 31, 2020, REVPAR includes rooms in service at the Company’s Las Vegas Strip Resorts through March 16, 2020.FIRST QUARTER 2020 – REGIONAL
REGIONAL
YoY Change
Net Revenues $726 million (10%)
Adjusted Property EBITDAR $ $152 million (28%)
Adjusted Property EBITDAR Margin 20.9% (544 bps)
• Results were primarily impacted by year over year declines in March, which offset year over year net revenue and Adjusted Property
EBITDAR growth of 20% and 42%, respectively, for the first two months of the quarter
• Excluding the acquisition of MGM Northfield Park’s operations from MGP, year over year declines in March offset year over year net
revenue and Adjusted Property EBITDAR growth of 10% and 26%, respectively, for the first two months of the quarter
MGM RESORTS I NTERNATIONAL 19FIRST QUARTER 2020 – CITYCENTER
CITYCENTER
1 . S T R UC T UR E T O D A Y (7 3 % O WN E R S H I P O F O P ) 3. MGM RESORTS LONG-TERM STRATEGY
50% owned by MGM Resorts
YoY Change
Net Revenues $265 million (23%)
Adjusted EBITDA $ $79 million (31%)
Adjusted EBITDA Margin 29.6% (367 bps)
• RevPAR was $245 in both the current and prior year quarters • Key Balance Sheet Items (as of 3/31/20)
• In April 2020, CityCenter paid a $101 million dividend, of which ➢ Cash & Cash Equivalents: $277 million
MGM Resorts received its 50% share, or approximately $51 million
➢ Availability under Revolver: $117 million
➢ Total Debt: $1.75 billion
MGM RESORTS I NTERNATIONAL 20FIRST QUARTER 2020 – MGM CHINA
MGM CHINA
1 . S T R UC T UR E T O D A Y (7 3 % O WN E R S H I P O F O P ) 3. MGM RESORTS LONG-TERM STRATEGY
56% owned by MGM Resorts
YoY Change
Net Revenues $272 million (63%)
Adjusted Property EBITDAR $ ($22 million) NM
• VIP table games: 66% decrease in turnover year-over-year; hold percentage of 3.2%
• Mass table games: 61% decrease in volume year-over-year; hold percentage of 24.1%
• In March 2020, MGM China’s Board of Directors recommended a final dividend for 2019 of $41 million, to be paid in 2020 if approved
at the upcoming annual shareholders meeting, of which MGM Resorts would receive its 55.95% share, or $23 million, and
noncontrolling interests would receive $18 million
MGM RESORTS I NTERNATIONAL 21• COVID-19 Update
TABLE OF • 1Q 2020 Financial Results
CONTENTS
• Appendix
MGM RESORTS I NTERNATIONAL 22MGM CHINA FINANCIAL INFORMATION UNDER IFRS
Due to the time differences between Macau and the United States, this supplemental information is being provided on behalf
of MGM China for the benefit of MGM China investors.
Three Months Ended
March 31
2020 2019
HK$'000 HK$'000
(unaudited) (unaudited)
Revenue
MGM Macau $1,128,806 $3,400,466
MGM Cotai $984,255 $2,360,282
Total Revenue $2,113,061 $5,760,748
Adjusted EBITDA1
MGM Macau $34,121 $1,075,211
MGM Cotai ($156,800) $543,753
Total Adjusted EBITDA ($122,679) $1,618,964
1
Adjusted EBITDA is profit before finance costs, income tax expense/benefit, depreciation and amortization, loss on disposal/write-off of property and equipment, construction in progress and
other assets, interest income, net foreign currency difference, share-based payments, pre-opening costs and corporate expenses which mainly include administrative expenses of the
corporate office and license fee paid to a related company. Adjusted EBITDA is used by management as the primary measure of t he Group’s operating performance and to compare our
operating performance with that of our competitors. Adjusted EBITDA should not be considered in isolation, construed as an alternative to profit or operating profit as reported under IFRS or
MGM RESORTS I NTERNATIONAL other combined operations or cash flow data, or interpreted as an alternative to cash flow as a measure of liquidity. Adjusted EBITDA presented in this announcement may not be
comparable to other similarly titled measures of other companies operating in the gaming or other business sectors. 23MGM CHINA FINANCIAL INFORMATION UNDER IFRS
Due to the time differences between Macau and the United States, this supplemental information is being provided on behalf
of MGM China for the benefit of MGM China investors.
Three Months Ended
March 31
2020 2019
HK$'000 HK$'000
MGM Macau (unaudited) (unaudited)
(in thousands, except for percentages and revenue per available room (“RevPAR”))
VIP Table Games Turnover 15,792,808 53,986,310
VIP Gross Table Games Win1 502,552 1,778,113
VIP Table Games Win Percentage 3.18% 3.29%
Average Daily Gross Win Per VIP Gaming Table 111.5 244.5
Main Floor Table Games Drop 3,413,565 9,631,852
Main Floor Gross Table Games Win1 744,335 2,023,908
Main Floor Table Games Win Percentage 21.8% 21.0%
Average Daily Gross Win Per Main Floor Gaming Table 55.0 105.9
Slot Machine Handle 3,324,631 7,634,950
Slot Machine Gross Win1 113,114 307,018
Slot Hold Percentage 3.4% 4.0%
Average Daily Win Per Slot 1.8 3.4
Commissions, complimentaries and other incentives1 (332,258) (950,371)
Room Occupancy Rate 44.0% 96.1%
RevPAR 881 1,951
As of March 31
Gaming Units: 2020 2019
Tables2 285 289
Slot Machines 575 1,061
1
The total of “VIP gross table games win”, “main floor gross table games win” and “slot machine gross win” is different to the casino revenue because casino revenue is reported net of
MGM RESORTS I NTERNATIONAL commissions and certain sales incentives including the allocation of casino revenue to hotel rooms, food and beverage and other revenue for services provided to casino customers on a
complimentary basis. 24
2
Permanent table count as of March 31, 2020 and 2019MGM CHINA FINANCIAL INFORMATION UNDER IFRS
Due to the time differences between Macau and the United States, this supplemental information is being provided on behalf
of MGM China for the benefit of MGM China investors.
Three Months Ended
March 31
2020 2019
HK$'000 HK$'000
MGM Cotai (unaudited) (unaudited)
(in thousands, except for percentages and revenue per available room (“RevPAR”))
VIP Table Games Turnover 10,823,869 24,557,688
VIP Gross Table Games Win1 340,911 908,410
VIP Table Games Win Percentage 3.15% 3.70%
Average Daily Gross Win Per VIP Gaming Table 92.8 187.2
Main Floor Table Games Drop 2,628,142 6,004,395
Main Floor Gross Table Games Win1 713,537 1,464,432
Main Floor Table Games Win Percentage 27.1% 24.4%
Average Daily Gross Win Per Main Floor Gaming Table 56.4 80.5
Slot Machine Handle 3,397,889 10,700,104
Slot Machine Gross Win1 111,598 229,993
Slot Hold Percentage 3.3% 2.1%
Average Daily Win Per Slot 1.7 2.1
Commissions, complimentaries and other incentives1 (328,406) (560,086)
Room Occupancy Rate 33.2% 90.0%
RevPAR 585 1,348
As of March 31
Gaming Units: 2020 2019
Tables2 267 263
Slot Machines 462 1,213
1
The total of “VIP gross table games win”, “main floor gross table games win” and “slot machine gross win” is different to the casino revenue because casino revenue is reported net of
MGM RESORTS I NTERNATIONAL commissions and certain sales incentives including the allocation of casino revenue to hotel rooms, food and beverage and other revenue for services provided to casino customers on a
complimentary basis. 25
2
Permanent table count as of March 31, 2020 and 2019MGM RESORTS DOMESTIC NET LEVERAGE
CONSOLIDATED DOMESTIC NET DOMESTIC NET
($ in millions) NET LEVERAGE LEVERAGE LEVERAGE
($ in millions) 3/31/2020 ADJUSTMENTS 3/31/2020
Total Cash1 $6,016 ($2,144) $3,873
LTM Adjusted EBITDAR related to:
LV Strip 2 $1,472 $-- $1,472
Regional $910 -- 910
Management and other operations ($13) -- (13)
MGM China $520 (520) --
Corporate expense (excluding stock-based compensation)3 (386) 39 (347)
$2,503 ($481) $2,022
Ground Lease Payments (21) 1 (20)
Annualized Rent Payments 4 (537) (813) (1,350)
Dividends and distributions received 5 16 401 416
$1,961 ($892) $1,068
Total Principal Amount of Debt related to:
Principal Debt 6 $11,815 ($6,326) $5,490
$11,815 ($6,326) $5,490
Net Leverage Ratio 3.0x 1.5x
1 3/31/2020 Actual includes $381 million and $1.8 billion at MGM China and MGM Growth Properties, respectively. MGM China and MGM Growth Properties excluded for Domestic Net Leverage
2 Circus Circus EBITDA excluded, sold on December 20, 2019
3 3/31/2020 LTM Actual includes $22 million and $17 million at MGM China and MGM Growth Properties, respectively. MGM China and MGM Growth Properties excluded for Domestic Net Leverage
MGM RESORTS I NTERNATIONAL 4 3/31/2020 Annualized Rent Payments for the current lease year include $537 million and $813 million to Blackstone JV and MGM Growth Properties, respectively
5 Represents ordinary dividends (excluding special dividends) and other regular cash distributions received by MGM from Bellagio JV REIT, MGM Grand/MB JV REIT, MGM China and MGM Growth Properties
26
6 3/31/2020 Actual includes $2.3 billion and $4.0 billion at MGM China and MGM Growth Properties, respectively. MGM China and MGM Growth Properties excluded for Domestic Net leverageNOTEWORTHY CHANGES TO FINANCIAL REPORTING
PRESENTATION OF EBITDAR UNDER “SUPPLEMENTAL DATA – ADJUSTED PROPERTY EBITDAR AND
ADJUSTED EBITDAR”
• As a result of the recent transactions, the Company has elected to transition to an Adjusted EBITDAR presentation
beginning in 4Q19. Triple net operating lease and ground lease expense are now adjustments within Adjusted
EBITDAR and Adjusted Property EBITDAR
➢ Our most material ground leases are at National Harbor, Borgata, and MGM China
➢ Our ground leases aggregate to approximately $8 million of rent expense per quarter (~$32 million per year)1
• Furthermore, beginning with 1Q20 earnings, the Company eliminated property-specific net revenues and Adjusted
EBITDAR metrics and transitioned to reportable segment presentation only
MGM RESORTS I NTERNATIONAL 1 Refer to “Reconciliation of Net Income (Loss) Attributable to MGM Resorts International to Adjusted EBITDAR” table within the 1Q 2020 earnings release
27NOTEWORTHY CHANGES TO FINANCIAL REPORTING
BELLAGIO TRANSACTION
• Transaction closed on November 15, 2019
• MGM’s 5% equity stake recognized as an equity method investment
• Income statement
➢ Lease payments recorded on a straight-line basis as rent expense
➢ Share of operating income from JV recognized as income from unconsolidated affiliates, which is excluded from Adjusted
EBITDAR and Adjusted Property EBITDAR
• Cash flow statement
➢ Lease payments reflected as operating activities
CIRCUS CIRCUS LAS VEGAS TRANSACTION
• Transaction closed on December 20, 2019. We sold the entire operations and real estate.
• Historical results during the period we owned CCLV will not be reflected as discontinued operations
MGM GRAND LAS VEGAS / MANDALAY BAY TRANSACTION
• Transaction closed on February 14, 2020
• MGP’s 50.1% equity stake in JV recognized as an equity method investment
• Income statement
➢ Lease payments recorded on a straight-line basis as rent expense
➢ Share of operating income from JV recognized as income from unconsolidated affiliates, which is excluded from Adjusted
EBITDAR and Adjusted Property EBITDAR
• Cash flow statement
➢ Lease payments reflected as operating activities (because MGP does not consolidate the JV)
MGM RESORTS I NTERNATIONAL 28CARES ACT
On March 27, 2020, the Coronavirus Aid, Relief, and Economic Security Act (the “CARES Act”) was signed into law.
The CARES Act provides opportunities for additional liquidity, loan guarantees, and other government programs to
support companies affected by the COVID-19 pandemic and their employees, as well as income and payroll tax
relief.
Based on our preliminary analysis of the CARES Act, the benefits we expect to recognize include:
• refund of federal income taxes due to five-year carryback of net operating loss incurred in 2020 when our 2020
tax return is filed;
• relaxation of interest expense deduction limitation for income tax purposes;
• reduction of employer Federal Insurance Contributions Act (“FICA”) taxes equal to 50 percent of wages paid and
health care coverage provided to furloughed employees during 2020; and
• deferral of all employer FICA taxes for the remainder of 2020, 50 percent payable by December 2021 and the
remainder payable by December 2022.
MGM RESORTS I NTERNATIONAL 29You can also read