CAPITALAND MALL TRUST - SINGAPORE'S FIRST & LARGEST RETAIL REIT CAPITALAND & REITS CORPORATE DAY, BANGKOK - INVEST WITH CAPITALAND
←
→
Page content transcription
If your browser does not render page correctly, please read the page content below
CAPITALAND MALL TRUST
   Singapore’s First & Largest Retail REIT

CapitaLand & REITs Corporate Day, Bangkok
                  17 August 2018
Disclaimer
    This presentation may contain forward-looking statements that involve assumptions, risks and uncertainties. Actual future
    performance, outcomes and results may differ materially from those expressed in forward-looking statements as a result
    of a number of risks, uncertainties and assumptions. Representative examples of these factors include (without
    limitation) general industry and economic conditions, interest rate trends, cost of capital and capital availability,
    competition from other developments or companies, shifts in expected levels of occupancy rate, property rental
    income, charge out collections, changes in operating expenses (including employee wages, benefits and training
    costs), governmental and public policy changes and the continued availability of financing in the amounts and the
    terms necessary to support future business. You are cautioned not to place undue reliance on these forward-looking
    statements, which are based on the current view of management on future events.

    The information contained in this presentation has not been independently verified. No representation or warranty
    expressed or implied is made as to, and no reliance should be placed on, the fairness, accuracy, completeness or
    correctness of the information or opinions contained in this presentation. Neither CapitaLand Mall Trust Management
    Limited (the ‘Manager’) or any of its affiliates, advisers or representatives shall have any liability whatsoever (in
    negligence or otherwise) for any loss howsoever arising, whether directly or indirectly, from any use, reliance or
    distribution of this presentation or its contents or otherwise arising in connection with this presentation.

    The past performance of CapitaLand Mall Trust (‘CMT’) is not indicative of the future performance of CMT. Similarly, the
    past performance of the Manager is not indicative of the future performance of the Manager.

    The value of units in CMT (‘Units’) and the income derived from them may fall as well as rise. Units are not obligations of,
    deposits in, or guaranteed by, the Manager or any of its affiliates. An investment in Units is subject to investment risks,
    including the possible loss of the principal amount invested.

    Investors should note that they will have no right to request the Manager to redeem or purchase their Units for so long as
    the Units are listed on the Singapore Exchange Securities Trading Limited (the ‘SGX-ST’). It is intended that unitholders of
    CMT may only deal in their Units through trading on the SGX-ST. Listing of the Units on the SGX-ST does not guarantee a
    liquid market for the Units.

    This presentation is for information only and does not constitute an invitation or offer to acquire, purchase or subscribe
    for Units.

2                                             CapitaLand & REITs Corporate Day, Bangkok *August 2018*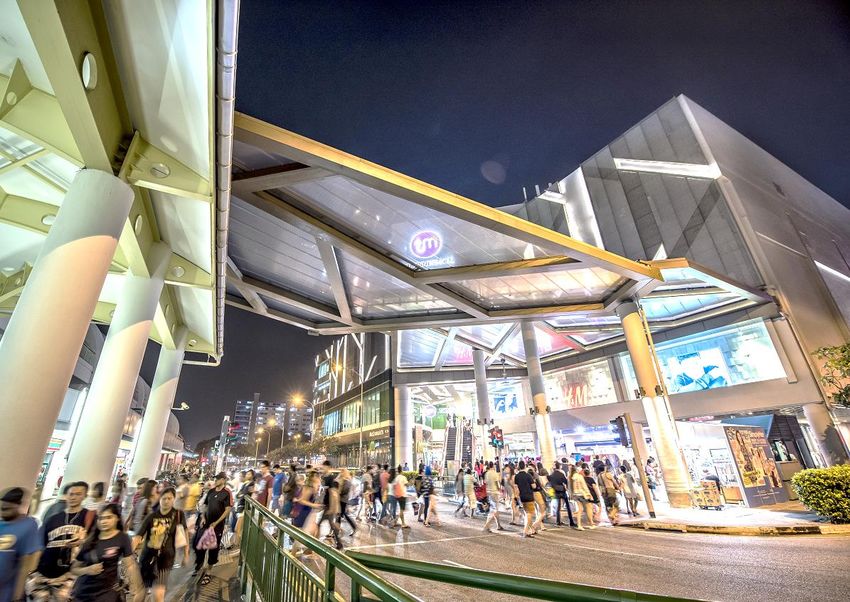
Contents

    ▪ Key Highlights and Financial Results

    ▪ Portfolio Updates

    ▪ Unlocking Value Through Asset Planning

    ▪ Looking Forward

    ▪ Annexes

3                   CapitaLand & REITs Corporate Day, Bangkok *August 2018*
Key Highlights and Financial Results

                                  Bugis+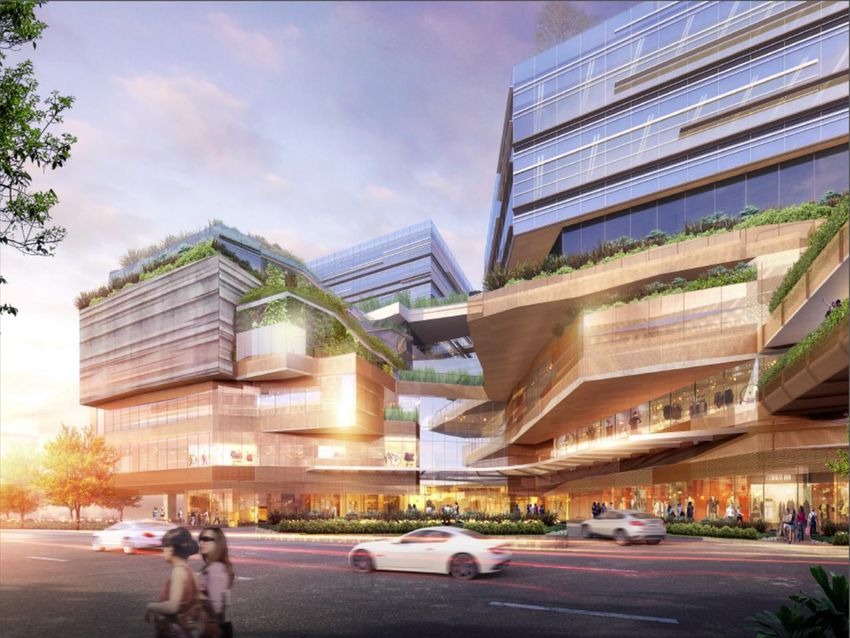
Review of 1H 2018
                                         Operational Performance
                ,                               ,                                 ,                             ,

         0.8%                         98.0%                           . 2.4%                             . 0.2%
                5                   as at end-June 2018                        Y-o-Y                         Y-o-Y
                .                               .                                                               .
         Rental reversion                 Portfolio                      Shopper traffic                  Tenants’ sales
                                       occupancy rate                                                    per square foot

                                1                                                                    1

                     Asset Updates                                      Proactive Capital Management
                                                                                                     1
                                                                        Issued 5.5-year S$130.0 million fixed rate notes at
                                                                           interest rate of 3.2115% per annum to repay
                                                                                 existing bank borrowings of CMT
                                1

    Divestment of Sembawang          Enclosure of selected
       Shopping Centre for          alfresco F&B outlets with
          S$248.0 million                air-conditioning

    Completed on 18 June 2018       Installation of escalators
                                      and creation of new
                                         entrance point

5                                          CapitaLand & REITs Corporate Day, Bangkok *August 2018*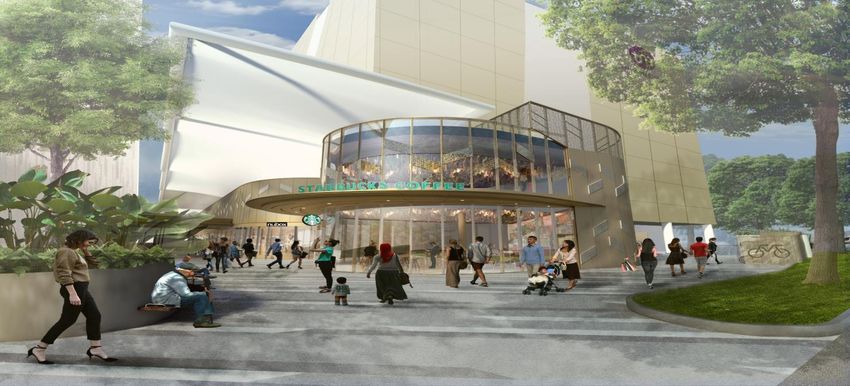
1H 2018 Distributable Income Up 2.5% Y-o-Y

    Distributable Income                          Distribution Per Unit (DPU)                                        (1)
                                                                                                                                              (2)

      S$199.0                                           5.59
                                (1)

      million                                           cents
             2.5% Y-o-Y                                       2.0% Y-o-Y

                                                             Annualised DPU                                 Annualised Distribution
                                                                                                                     Yield

                                                              11.27                                            5.27
                                                              cents                                            %
                                                                                                            (Based on closing unit price of S$2.14
                                                                     2.0% Y-o-Y                             on 19 July 2018)

    (1) For 1H 2018, CMT had retained S$13.7 million of its taxable income available for distribution to Unitholders for distribution in FY 2018. Capital
        distribution and tax-exempt income distribution of S$1.0 million received from CapitaLand Retail China Trust (‘CRCT’) in respect of the period 7
        December 2017 to 31 December 2017 had also been retained for general corporate and working capital purposes.
    (2) For 1H 2017, CMT had retained S$7.6 million of its taxable income available for distribution to Unitholders for distribution in FY 2017. Capital
        distribution and tax exempt income distribution of S$5.8 million received from CRCT in 1Q 2017 had also been retained for general corporate and
        working capital purposes.

6                                                       CapitaLand & REITs Corporate Day, Bangkok *August 2018*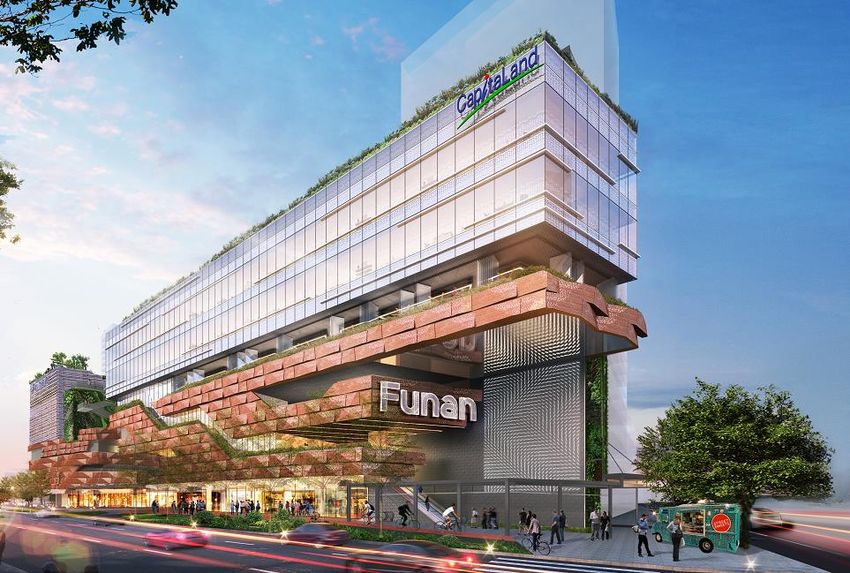
1H 2018 Financial Performance
        Gross Revenue                                Net Property Income                            Distributable Income

            S$346.5                                       S$246.4                                         S$199.0
                                                                                                                                 (1)

            million                                       million                                         million
                  1.7% Y-o-Y                                    3.7% Y-o-Y                                       2.5% Y-o-Y

     S$ million

                                                                                                               (1)         (2)

    (1) For 1H 2018, CMT had retained S$13.7 million of its taxable income available for distribution to Unitholders for distribution in FY 2018.
        Capital distribution and tax-exempt income distribution of S$1.0 million received from CRCT in respect of the period 7 December 2017
        to 31 December 2017 had also been retained for general corporate and working capital purposes.
    (2) For 1H 2017, CMT had retained S$7.6 million of its taxable income available for distribution to Unitholders for distribution in FY 2017.
        Capital distribution and tax exempt income distribution of S$5.8 million received from CRCT in 1Q 2017 had also been retained for
        general corporate and working capital purposes.

7                                                  CapitaLand & REITs Corporate Day, Bangkok *August 2018*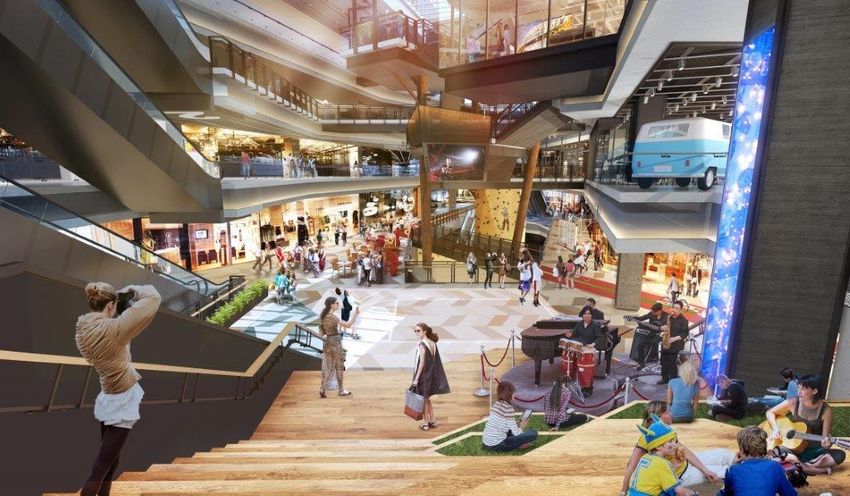
Debt Maturity Profile (1) as at 30 June 2018
             700
                                                                          -

             600                                                                                                590.0
                                                                                                                        (2)
                                                                                                                         (2)
                                                                                                                120.0
             500                                                     484.0
                                              442.0                           (2)                                              450.0
                           419.6                        (2)
                                                                      72.0
                                                48.0                                                            130.0
             400
S$ million

                                   (2)
                           100.0
                                               100.0
                                                                                          218.2                                                                                     292.8
             300                                                                                    (2)
                                                                                                                100.0          300.0
                                   (3)                                                        4.4
                           162.0
                                                       (5)
                                                                    350.0                                                                    218.3                                  100.0
                                               126.0                                                                    (8)                                     199.0
             200                                                                                                100.0                                (2)
                                                                                                                                                                        (11)
                                                                                                                                             110.0               99.0
                                                                                                          (7)                                                                               (12)
                                                                                          190.1                                                                                     192.8
             100                   (4)                                                                                  (9)
                           157.6              168.0                                                             140.0          150.0                 (10)
                                                                                                                                                                100.0                                                       150.0
                                                                              (6)                                                            108.3
                                                                      62.0
               0                                                                          23.7

                          2019                2020                  2021                 2022                   2023           2024         2025                2026                2027                                    2031
                                Unsecured Bank Loans                                                                                   Notes issued under Eur o- Medium Term Note ( 'EMTN') Progr amme (Unsecured)
                                Secured Bank Loans - 30.0% inter est in Infinity Mall Trust                                            Notes issued under Medium Term Note (' MTN') Programme (Unsecured)
                                Retail Bonds due 2021 at fixed rate of 3.08% p.a. (Unsecured)                                          Notes issued under RCS Tr ust EMTN Pr ogramme (Unsecur ed) - 40.0% interest in RCS Trust
                                Unsecured Bank Loans - 40.0% interest in RCS Trust

                   (1)    Includes CMT’s share of borrowings in RCS Trust (40.0%) and Infinity Mall Trust (30.0%).
                   (2)    S$1.136 billion unsecured bank loans and notes by RCS Trust. CMT’s 40.0% share thereof is S$454.4 million.
                   (3)    S$540.0 million secured bank loans by Infinity Mall Trust due in October 2019. CMT’s 30.0% share thereof is S$162.0 million.
                   (4)    ¥10.0 billion 1.309% fixed rate notes ('EMTN Series 4') were swapped to approximately S$157.6 million at a fixed rate of 2.79% p.a. in October 2012.
                   (5)    ¥10.0 billion 1.039% fixed rate notes ('MTN Series 10') were swapped to S$126.0 million at a fixed rate of 3.119% p.a. in Nov ember 2013.
                   (6)    ¥5.0 billion floating rate (at 3 months JPY LIBOR + 0.48% p.a.) notes ('MTN Series 12') were swapped to S$62.0 million at a fixed rate of 3.148% p.a. in February 2014.
                   (7)    HK$1.15 billion 3.76% fixed rate notes ('EMTN Series 3') were swapped to S$190.1 million at a fixed rate of 3.45% p.a. in June 2012.
                   (8)    ¥8.6 billion floating rate (at 3 months JPY LIBOR + 0.25% p.a.) notes ('MTN Series 16') were swapped to S$100.0 million at a fixed rate of 2.85% p.a. in February 2015.
                   (9)    HK$885.0 million 3.28% fixed rate notes ('EMTN Series 5') were swapped to S$140.0 million at a fixed rate of 3.32% p.a. in No vember 2012.
                   (10)   HK$650.0 million 3.25% fixed rate notes ('MTN Series 14') were swapped to S$108.3 million at a fixed rate of 3.25% p.a. in November 2014.
                   (11)   HK$560.0 million 2.71% fixed rate notes (‘MTN Series 18’) were swapped to S$99.0 million at a fixed rate of 2.928% p.a. in July 2016.
                   (12)   HK$1.104 billion 2.77% fixed rate notes ('MTN Series 15') were swapped to S$192.8 million at a fixed rate of 3.25% p.a. in February 2015.

     8                                                                                         CapitaLand & REITs Corporate Day, Bangkok *August 2018*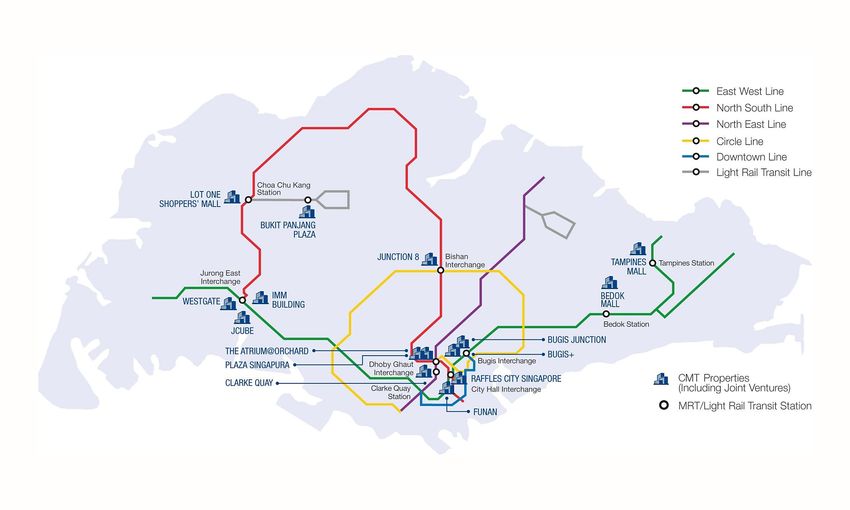
Key Financial Indicators
                                                                                     As at                           As at
                                                                                 30 June 2018                    31 March 2018

     Unencumbered Assets as % of Total Assets                                        100.0%                            100.0%

     Aggregate Leverage(1)                                                             31.5%                            33.5%

     Net Debt / EBITDA(2)                                                                5.3x                             5.8x

     Interest Coverage(3)                                                                5.7x                             5.4x

     Average Term to Maturity (years)                                                    5.2                              5.2

     Average Cost of Debt(4)                                                             3.1%                             3.2%
     CMT’s Issuer Rating(5)                                                                                              ‘A2’

    (1) In accordance to Property Funds Appendix, CMT’s proportionate share of its joint ventures borrowings and total deposited property are
        included when computing the aggregate leverage. Funds raised ahead of the maturity of the existing borrowings of CMT are excluded
        from both borrowings and total deposited property for the purpose of computing the aggregate leverage as the funds are set aside
        solely for the purpose of repaying the existing borrowings of CMT.
    (2) Net Debt comprises gross debt less temporary cash intended for refinancing and capital expenditure. EBITDA refers to earnings before
        interest, tax, depreciation and amortisation.
    (3) Ratio of net investment income at CMT Group before interest and tax over interest expense from 1 January 2018 to 30 June 2018.
    (4) Ratio of interest expense over weighted average borrowings.
    (5) Moody’s Investors Service has affirmed the ‘A2’ issuer rating of CMT on 16 July 2015.

9                                                CapitaLand & REITs Corporate Day, Bangkok *August 2018*
Valuations and Valuation Cap Rates
                                                 Valuation            Valuation         Variance        Valuation                Valuation Cap Rate
                                               as at 30 Jun 18      as at 31 Dec 17                   as at 30 Jun 18    as at 30 Jun 18    as at 31 Dec 17
                                                  S$ million           S$ million       S$ million    S$ per sq ft NLA          %                  %
     Tampines Mall                                 1,051.0              1,045.0             6.0            2,950               4.70               4.85
     Junction 8 Shopping Centre                      740.0                 735.0            5.0            2,921               4.70               4.85
                                                                                                                  (1)      Retail: 6.15       Retail: 6.25
     IMM Building                                   644.0                641.0              3.0             670
                                                                                                                         Warehouse: 7.00   Warehouse: 7.25
     Plaza Singapura                               1,293.0              1,283.0            10.0            2,680               4.40               4.50
     Bugis Junction                                1,086.0              1,068.0            18.0            2,739               4.70               4.85
     JCube                                           288.0                288.0              -             1,392               4.85               5.00
     Lot One Shoppers’ Mall                          535.0                532.0             3.0            2,434               4.70               4.85
     Bukit Panjang Plaza                             325.0                324.0             1.0            1,988               4.80               4.95
                                                                                                                   (1)     Retail: 4.65       Retail: 4.75
     The Atrium@Orchard                             757.0                750.0              7.0            1,956
                                                                                                                           Office: 3.75       Office: 3.75
     Clarke Quay                                    396.0                393.0              3.0            1,349               4.85               5.00
     Bugis+                                         351.0                345.0              6.0            1,635               5.20               5.30
     Bedok Mall                                     782.0                781.0              1.0            3,515               4.60               4.75
     Total CMT Portfolio excluding Funan,                                         (2)
                                                   8,248.0              8,185.0            63.0
     Raffles City Singapore and Westgate
                                                             (3)                  (3)                                      Retail: 4.85       Retail: 4.85
     Funan                                          360.0                360.0              -              N.M.
                                                                                                                           Office: 4.00       Office: 4.10
     Total CMT Portfolio including
     Investment Properties Under
                                                   8,608.0              8,545.0            63.0
     Development and excluding Raffles
     City Singapore and Westgate
     Less additions during the period                                                      (7.6)

     Net increase in valuations                                                            55.4
                                                                                                                   (4)
                                                                                                                           Retail: 4.70       Retail: 4.85
     Raffles City Singapore (40.0% interest)       1,319.2              1,304.0            15.2            N.M.            Office: 4.00       Office: 4.10
                                                                                                                           Hotel: 4.75        Hotel: 4.75
     Westgate (30.0% interest)                      297.3                289.5              7.8            2,408               4.60               4.75
     Share of Joint Ventures’ investment
                                                   1,616.5              1,593.5            23.0
     properties
     Less additions during the period                                                      (5.3)
     Net increase in valuations                                                            17.7

     (1) Reflects valuation of the property in its entirety.
     (2) Sembawang Shopping Centre was sold on 18 June 2018 and its valuation of S$126.0 million as at 31 December 2017 is excluded from
         portfolio valuation.
     (3) As at 30 June 2018, Funan is held through CMT, Victory Office 1 Trust and Victory Office 2 Trust (each of Victory Office 1 Trust and Victory
         Office 2 Trust are wholly owned by CMT). As the property is undergoing redevelopment into an integrated development, the value
         reflected in this table is the total land value of the retail and office components of the integrated development.
     (4) Not meaningful because Raffles City Singapore comprises retail units, office units, hotels and convention centre.

10                                                           CapitaLand & REITs Corporate Day, Bangkok *August 2018*
Healthy Balance Sheet
As at 30 June 2018
S$’000
Non-current Assets 9,976,546 Net Asset Value/Unit
S$2.01
(as at 30 June 2018)
Current Assets 373,599
Adjusted Net Asset Value/Unit
Total Assets 10,350,145 S$1.99
(excluding distributable income)
Current Liabilities 198,489
Non-current Liabilities 3,002,220
Total Liabilities 3,200,709
Net Assets 7,149,436
Unitholders’ Funds 7,149,436
Units in Issue (’000 units) 3,548,520
11 CapitaLand & REITs Corporate Day, Bangkok *August 2018*Portfolio Updates
Bedok Mall(1)
Shopper Traffic
1H 2018 decreased by 2.4% Y-o-Y
200
Shopper Traffic (million)
150
100
50
0
1H 2018 1H 2017
(1) For comparable basis, CMT portfolio excludes Funan which was closed in July 2016 for redevelopment and
Sembawang Shopping Centre which was sold in June 2018.
13 CapitaLand & REITs Corporate Day, Bangkok *August 2018*(1)
Tenants’ Sales Psf Per Month
1H 2018 decreased by 0.2% Y-o-Y
100
Tenants’ Sales ($ psf/mth)
75
50
1H 2018 1H 2017
(1) For comparable basis, CMT portfolio excludes Funan which was closed in July 2016 for redevelopment and
Sembawang Shopping Centre which was sold in June 2018.
14 CapitaLand & REITs Corporate Day, Bangkok *August 2018*Tenants’ Sales by Trade Categories in 1H 2018
Cautious Consumer Sentiment
20
14.2
15 11.9
Y-o-Y Variance of Tenants’ Sales $ psf/mth (%)
9.3 8.7
10
5.0 4.0
5 3.3 2.5 1.7 0.7 0.6 0.1
0
-5 (0.6) (0.7)
-10 (7.9)
-15 (11.4)
-20
-25 (20.6)
(1)
(2)
IT & Telecommunications
Sporting Goods
Music & Video
Jewellery & Watches
Beauty & Health
Electrical & Electronics
Home Furnishing
Shoes & Bags
Leisure & Entertainment
Department Store
Gifts & Souvenirs
Toys & Hobbies
Food & Beverage
Fashion
Supermarket
Books & Stationery
Services
(1) Includes convenience stores, bridal shops, optical shops, film processing shops, florists, magazine stores, pet
shops, travel agencies, cobblers/locksmiths, laundromats and clinics.
(2) Includes Hypermarket sales from January 2018. For comparable basis, sales in 1H 2017 were rebased
accordingly.
15 CapitaLand & REITs Corporate Day, Bangkok *August 2018*Average Occupancy Cost (1)
18.7% 19.0%
FY 2017 FY 2016
(1) Occupancy cost is defined as a ratio of gross rental (inclusive of service charge, advertising & promotional charge and
gross turnover rent) to tenants’ sales. CMT portfolio excludes Funan which was closed in July 2016 for redevelopment.
16 CapitaLand & REITs Corporate Day, Bangkok *August 2018*Rental Reversions
From 1 January to 30 June 2018 (Excluding Newly Created and Reconfigured Units)
Net Lettable Area
Increase/(decrease)
in Current Rental
Number of Retention Rates vs Preceding
Percentage
Property Renewals / Rate Area Rental Rates
of Property
New Leases (%) (sq ft) (typically committed
(%)
three years ago)
(%)
Tampines Mall 48 89.6 65,324 18.3 2.0
Junction 8 30 80.0 24,267 9.6 3.4
IMM Building(1) 28 96.4 23,261 5.5 2.0
Plaza Singapura 37 91.9 45,007 9.3 4.0
Bugis Junction 31 74.2 26,841 6.8 0.3
Raffles City Singapore(1) 34 67.6 44,835 10.5 (0.8)
Lot One Shoppers’ Mall 34 88.2 89,339 40.6 (0.2)
The Atrium@Orchard(1) 10 100.0 11,464 8.5 3.2
Clarke Quay 8 75.0 9,462 3.2 3.5
Bugis+ 41 90.2 87,167 40.6 1.2
Westgate 26 73.1 34,703 8.4 (2.1)
Bedok Mall 26 84.6 30,644 13.8 (1.5)
Other assets(2) 55 80.0 78,868 21.3 (0.6)
CMT Portfolio(3) 408 83.8 571,182 13.6 0.8
(1) Based on retail leases only.
(2) Includes JCube and Bukit Panjang Plaza.
(3) Excludes Funan which was closed in July 2016 for redevelopment and Sembawang Shopping Centre which
was sold in June 2018.
17 CapitaLand & REITs Corporate Day, Bangkok *August 2018*Portfolio Lease Expiry Profile(1)
as at 30 June 2018
Weighted Average Expiry by Gross Rental Income 1.9 Years
Gross Rental Income per Month(2)
Number of Leases S$’000 % of Total
(3)
2018 403 5,998 10.6
2019 948 17,860 31.6
2020 794 14,806 26.2
2021 566 12,401 22.0
2022 55 4,643 8.2
2023 and beyond 17 807 1.4
Total 2,783 56,515 100.0
(1) Based on committed leases. Includes CMT’s 40.0% interest in Raffles City Singapore (excluding hotel lease), CMT’s
30.0% interest in Westgate, and excludes Funan which was closed in July 2016 for redevelopment and
Sembawang Shopping Centre which was sold in June 2018.
(2) Based on the month in which the lease expires and excludes gross turnover rent.
(3) Of which 327 leases are retail leases.
18 CapitaLand & REITs Corporate Day, Bangkok *August 2018*Portfolio Lease Expiry Profile for 2018 (1)
Net Lettable Area Gross Rental Income
Number of
As at 30 June 2018 Leases % of Property NLA(2) % of Property Income(3)
Tampines Mall 15 3.4 6.6
Junction 8 15 5.1 7.7
IMM Building(4) 143 20.6 30.9
Plaza Singapura 41 12.3 14.1
Bugis Junction 13 4.3 5.2
Raffles City Singapore(4) 27 4.5 6.7
Lot One Shoppers’ Mall 17 18.1 8.9
The Atrium@Orchard(4) 25 8.6 14.8
Clarke Quay 6 5.0 8.2
Bugis+ 4 2.0 1.7
Westgate 26 8.5 5.4
Bedok Mall 5 1.6 1.4
Other assets(5) 66 10.4 12.5
CMT Portfolio 403(6) 9.2 10.6
(1) Based on committed leases. Includes CMT’s 40.0% interest in Raffles City Singapore (excluding hotel lease),
CMT’s 30.0% interest in Westgate, and excludes Funan which was closed in July 2016 for redevelopment and
Sembawang Shopping Centre which was sold in June 2018.
(2) As a percentage of net lettable area for each respective property as at 30 June 2018.
(3) As a percentage of gross rental income for each respective property and excludes gross turnover rent.
(4) Includes non-retail leases for IMM Building, Raffles City Singapore and The Atrium@Orchard.
(5) Includes JCube and Bukit Panjang Plaza.
(6) Of which 327 leases are retail leases.
19 CapitaLand & REITs Corporate Day, Bangkok *August 2018*High Occupancy Maintained
31 Dec 31 Dec 31 Dec 31 Dec 31 Dec 31 Dec 31 Dec 31 Dec 31 Dec 30 Jun
(%, As at)
2009 2010 2011 2012 2013 2014 2015 2016 2017 2018
Tampines Mall 100.0 100.0 100.0 100.0 100.0 99.5 100.0 99.2 100.0 100.0
Junction 8 100.0 100.0 100.0 99.6 99.4 100.0 100.0 99.9 100.0 99.9
(1) (1) (1)
Funan 99.3 100.0 100.0 100.0 98.2 97.9 95.3 N.A. N.A. N.A.
(3)
IMM Building(2) 99.7 100.0 100.0 98.1 99.0 96.0 96.0 97.9 99.5 98.0
Plaza Singapura 100.0 100.0 100.0 91.3 100.0 100.0 99.7 100.0 100.0 99.6
Bugis Junction 100.0 100.0 100.0 100.0 100.0 100.0 99.7 99.9 99.3 99.8
(4) (3)
Other assets 99.8 99.8 80.9 99.8 100.0 98.1 92.6 95.3 96.4 95.3
(2)
Raffles City Singapore 100.0 99.6 100.0 100.0 100.0 100.0 99.6 99.7 99.9 98.3
Lot One Shoppers' Mall 99.9 99.6 99.7 99.8 100.0 100.0 99.8 99.9 100.0 99.9
(5) (3)
The Atrium@Orchard 99.1 93.5 65.5 95.3 99.5 99.9 98.2 97.6 98.6 99.1
Clarke Quay 100.0 100.0 97.9 100.0 95.9 88.2 90.7 98.8 90.4
Bugis+ 99.5 100.0 100.0 99.2 100.0 100.0 100.0
Westgate 85.8 97.7 97.6 99.6 98.0 95.3
Bedok Mall 99.9 100.0 99.2 99.5
CMT Portfolio 99.8 99.3 94.8 98.2 98.5 98.8 97.6 98.5 99.2 98.0
(1) Not applicable because Funan was closed in July 2016 for redevelopment.
(2) Based on retail leases only.
(3) Lower occupancy rates were mainly due to AEI.
(4) Other assets include:
a) Sembawang Shopping Centre, until it was sold in 2018;
b) Rivervale Mall, until it was sold in 2015;
c) Hougang Plaza, until it was sold in 2012;
d) JCube, except from 2009 to 2011 when it underwent an AEI and from 3Q 2012 to 4Q 2015 when it was classified separately;
e) Bugis+, which was acquired in 2011 and subsequently underwent an AEI from November 2011 to July 2012.
The asset was classified separately from 2012 onwards; and
f) Bukit Panjang Plaza, from 2018 onwards.
(5) Includes retail and office leases.
20 CapitaLand & REITs Corporate Day, Bangkok *August 2018*Unlocking Value
Through Asset Planning
Lot One Shoppers’ MallOngoing Initiatives
Malls Funan Tampines Mall Westgate
Target Completion 2H 2019 4Q 2018 4Q 2018
Date
Area of work Funan is undergoing three Tampines Mall is Westgate is enclosing
years of redevelopment conducting rejuvenation selected alfresco F&B
work. The new integrated works which include outlets with air-
development will comprise demolition of existing conditioning, as well as
retail, office and serviced pavilion and construction of installing new escalators
residence components. new duplex, as well as and creating a new
enhancement of the mall entrance point from taxi
facade. The external stand.
walkway will also be fitted
with new flooring.
* Artist’s impression
22 CapitaLand & REITs Corporate Day, Bangkok *August 2018*Redevelopment - Funan
Funan
*Artist’s impression of proposed integrated development
*Artist’s impressionFunan – A Creative Intersection
• Offers unparalleled
connectivity and
convenience, enabling Funan
to actively host communities
and catalyse creative
collaborations
• Three years of redevelopment
work. The new integrated
development will comprise
retail, office and serviced
residence components.
• Target completion in 2H 2019
Artist’s impression of proposed integrated development.
Artist Impression: Subject to Changes
24 CapitaLand & REITs Corporate Day, Bangkok *August 2018*Redevelopment Details
Existing Proposed
Serviced
Retail Retail Office Total
Residences
Gross Plot Ratio 3.88 7.0
Gross Floor Area
482,097 503,900(2) 262,900 121,600 888,400(2)
(sq ft)(1)
Gross Floor Area
100% 57% 29% 14% 100%
Allocation
Net Lettable
298,814 325,000(2) 204,000 80,000 609,000(2)
Area (sq ft)(1)
Efficiency 62% 65% 78% 66% 69%
(1) Proposed areas are approximate figures.
(2) Includes Community/Sports Facilities Scheme (‘CSFS’) area of approximately 18,100 sq ft.
25 CapitaLand & REITs Corporate Day, Bangkok *August 2018*Strong Retail Leasing Interest
Selection of Committed Tenants
Artist’s impression.
26 CapitaLand & REITs Corporate Day, Bangkok *August 2018*Funan’s First Office Tenant
WeWork Leased 40,000 Square Feet of Office Space
• Located across two floors of Funan’s
North Office Block – namely Level 4,
which is the prime connector space
linking office blocks with retail and
serviced residence components, and
Level 5
• Leverage on Funan’s central location
and harness its live-work-play paradigm
• Create a world-class collaborative
workspace that fosters connections and
Artist’s impression. nurtures ideas
27 CapitaLand & REITs Corporate Day, Bangkok *August 2018*Asset Enhancement
Initiative –
Tampines Mall
*Artist’s impression
Tampines MallRejuvenation of Tampines Mall
Rejuvenation Works Amounting S$8.2 Million to be Completed by 4Q 2018
Works include –
• Demolition of existing pavilion and construction of new duplex
• Enhancement of the mall facade
• New flooring for the external walkway
To refresh and reinforce Tampines Mall as one of
Singapore’s leading suburban malls.
29 CapitaLand & REITs Corporate Day, Bangkok *August 2018*Rejuvenation of Tampines Mall
The New Duplex
Enhancement of the Mall Facade New Flooring for the External Walkway
* Artist’s impression
30 CapitaLand & REITs Corporate Day, Bangkok *August 2018*Asset Enhancement
Initiative - Westgate
WestgateEnhancing Shopper Experience
Enclosure of Selected Alfresco F&B Outlets with Air-conditioning
Before
After (Artist’s impression)
32 CapitaLand & REITs Corporate Day, Bangkok *August 2018*Enhancing Shopper Experience
Improving Shopper Accessibility into the Mall and from Level 1 to Level 2
After: Install New Escalator Connecting L1 and L2 *
Before
* Artist’s impression After: Create New Entrance Point from Taxi Stand to Mall *
33 CapitaLand & REITs Corporate Day, Bangkok *August 2018*Looking Forward
Raffles City SingaporeLooking Forward
• The Singapore economy grew 3.9%(1) year-on-year in 2Q 2018, moderating from the 4.3% growth in the
previous quarter.
• Focus on active asset management
✓ Manage 403 leases due for renewal in 2018
✓ Pursue operational excellence
• Engage shoppers
✓ Build shopper loyalty through customer-centric experience and rewards programmes
✓ Leverage technology to bring greater convenience and delight to shopping experience
✓ Innovate marketing and promotional events to draw foot traffic
• Unlock value
✓ Asset enhancement works at Tampines Mall and Westgate
✓ Redevelopment of Funan
✓ Asset planning and identify opportunities for inorganic growth
(1) Based on data published by the Ministry of Trade and Industry Singapore on 13 August 2018.
35 CapitaLand & REITs Corporate Day, Bangkok *August 2018*Supplementary
Information
Tampines MallCapitaLand Mall Trust
– Major REIT in CapitaLand Group
+CapitaLand
CapitaLand
Singapore CapitaLand CapitaLand *CapitaLand CapitaLand CapitaLand The Ascott
Investment
Malaysia China Vietnam International Retail Commercial Limited
Management
Indonesia
Country Offices (Investor & Developer) & Fund
#REITs (Investor) Product SBU (Manager) Management
Group Managed Real Estate Assets* (as at 30 June 2018): S$93.1 billion
+SMI – comprises CapitaLand Singapore, CapitaLand Malaysia & CapitaLand Indonesia
*International – includes CapitaLand Europe, CapitaLand USA, CapitaLand Japan, CapitaLand
Australia, CapitaLand India and CapitaLand South Korea
#REITs
- CapitaLand Mall Trust, CapitaLand Commercial Trust, Ascott Residence Trust,
CapitaLand Retail China Trust and CapitaLand Malaysia Mall Trust
37 CapitaLand & REITs Corporate Day, Bangkok *August 2018*Singapore REIT Landscape
CMT: Largest Retail S-REIT by Market Capitalisation(1);
Credit Rating: ‘A2’ Issuer Rating
Total Assets
(S$ million) 43 REITs and business trusts in Singapore (2)
12,000
CMT AREIT
10,000 CCT
Suntec
8,000
KREIT
Fortune MLT
MCT MGCCT
6,000
ART
4,000 MINT
OUECT
SPH Starhill
FCT CRCT CDREIT Manulife US
Ascendas India FCOT OUEHT FEHT
2,000 ESR
Frasers Logistic
Sasseur LippoMall Parkway
EC World REIT Dasin Retail AIM AMP FIRT Cache
BHG Retail REIT Sabana
0
25% 30% 35% 40% Aggregate Leverage 45%
Source: Bloomberg and companies data
(1) Size of bubble denotes market capitalisation and balance sheet data available as at 8 Aug 2018.
(2) Based on UBS Singapore Property SREIT valuation guide as at 6 Aug 2018.
38 CapitaLand & REITs Corporate Day, Bangkok *August 2018*Track Record Since Inception
– From 3 to 15 Assets(1)
Divestment
of Rivervale
27.2% stake in CRS (2) Mall
+
Acquisition Divestment of
Divestment of Sembawang
Remaining 72.8% of Hougang Shopping
Hougang stake in CRS (2) Plaza Centre(5)
Plaza(3)
2003 2005 2007 2010 2012 2015 2018
2002 2004 2006 2008 2011 2013 2017
The Divestment
IPO Atrium@Orchard of Funan
(40.0% stake) Serviced
Residences
(30.0% stake)
(20.0% stake (4))
(1) 15 assets, after the divestment of Sembawang Shopping Centre on 18 June 2018.
(2) Acquisition of Class ‘E’ bonds issued by CapitaRetail Singapore Limited (‘CRS’) which owned Lot One Shoppers’ Mall, Bukit Panjang Plaza
(90 out of 91 strata lots) and Rivervale Mall.
(3) 92.4% stake purchase; 100.0% of the strata area was acquired in June 2006.
(4) 12.7% stake as at 30 June 2018.
(5) The divestment of Sembawang Shopping Centre was completed on 18 June 2018.
39 CapitaLand & REITs Corporate Day, Bangkok *August 2018*Market Leadership in Singapore Retail Space
S$7.3b 15 ~2,800 5.4m 16-year
Market Properties in Extensive Network sq ft NLA(2) Track Record
Capitalisation(1) Singapore of Tenants
Bedok Mall Bugis Junction Bugis+ Bukit Panjang Plaza Clarke Quay
Funan (3) IMM Building JCube Junction 8 Lot One Shoppers’ Mall
Raffles City
Singapore
Tampines Mall The Atrium@Orchard Westgate (30% stake)
Plaza Singapura (40% stake)
(1) Above information as at 30 June 2018
(2) Based on total NLA, including retail, office and warehouse. This excludes Funan which was closed for redevelopment on 1 July 2016.
(3) Artist’s impression of proposed integrated development.
40 CapitaLand & REITs Corporate Day, Bangkok *August 2018*Market Share by Owner(1)
CMT is the largest shopping mall owner in Singapore owning
14.0% of malls greater than 100,000 sq ft NLA
Source: Cistri
(1) Malls greater than 100,000 sq ft NLA as at end-2017. Share of floor space takes into account ownership stake.
(2) CapitaLand’s share only accounts for malls directly owned by CapitaLand and does not include those owned through CMT.
(3) Fund manager treated as a single owner.
41 CapitaLand & REITs Corporate Day, Bangkok *August 2018*Strategically Located Portfolio
- Close Proximity to Public Transport and Population Catchments
- Create and Offer Lifestyle Shopping Experiences
42 CapitaLand & REITs Corporate Day, Bangkok *August 2018*Steady Distributable Income Growth
S$ million
400 392.0 394.3 395.8
375.3
356.2
316.9
294.8 301.6
300 282.0
238.4
211.2
200
169.4
126.8
98.1
100
64.9
0
2004
2013
2017
2003
2005
2006
2007
2008
2009
2010
2011
2012
2014
2015
2016
(1) Based on compounded annual growth rate (‘CAGR’).
43 CapitaLand & REITs Corporate Day, Bangkok *August 2018*Financial Highlights
Gross Revenue (S$ million)(1) Total Assets
787.2 807.5 795.4
774.2
729.2
118.2 117.8 113.0 10,504.4
115.3 10,355.7 10,326.7
91.6
669.0 689.7 682.4
658.9
637.6 9,858.3
9,220.0
2013
2013 2014
2014 2015
2015 2016
2016 2017
2017 2013 2014 2015 2016 2017
(3) (2)
Joint ventures (For information only) CMT Group
Distributable Income (S$ million) Distribution Per Unit (cents)
394.3 395.8
392.0
11.25
11.13 11.16
375.3 10.84
356.2 10.27
2013 2014 2015 2016 2017 2013 2014 2015 2016 2017
(1) With the adoption of Financial Reporting Standards 111 Joint Arrangements from 1 January 2014, CMT’s 40.0% interest in RCS Trust and 30.0% interest in Infinity Mall Trust and Infinity Office Trust
(collectively, the Infinity Trusts) are accounted for as investments in joint ventures using equity method. For comparison purpose, 2013 have been restated to exclude CMT’s 40.0% interest in RCS
Trust and CMT’s 30.0% interest in Infinity Trusts.
(2) On 1 October 2015, CMT acquired all the units in Brilliance Mall Trust (BMT) which holds Bedok Mall. Upon acquisition, BMT became a subsidiary. On 15 December 2015, the sale of Rivervale Mall
was completed. On 30 August 2016, three private trusts namely Victory Office 1 Trust, Victory Office 2 Trust and Victory SR Trust (VSRT)(collectively, the Victory Trusts, each wholly owned by CMT)
were constituted in relation to the redevelopment of Funan. CMT, together with the Victory Trusts jointly own and undertake to redevelop Funan which comprises a retail component (held
through CMT), two office towers and serviced residences. On 31 October 2017, CMT divested all of the units held in VSRT, which holds the serviced residence component of Funan, to Victory SR
Pte. Ltd., a wholly owned subsidiary of Ascott Serviced Residence (Global) Fund Pte. Ltd..
(3) Joint ventures refer to CMT’s 40.0% interest in RCS Trust and CMT’s 30.0% interest in Infinity Trusts. Westgate, which is owned by Infinity Mall Trust, commenced operations on 2 December 2013.
44 CapitaLand & REITs Corporate Day, Bangkok *August 2018*Prudent Capital Management
Aggregate Leverage (%)(1,2)
39.0 38.4
38.0
36.7
37.0
36.0 35.3 35.4
34.8
35.0 34.2
33.8
34.0
33.0
32.0
31.0
2011 2012 2013 2014 2015 2016 2017
Net Debt / EBITDA (times)(3) Interest Coverage (times)(4)
7.0 6.3 6.4 6.0
6.0 5.0
6.0 5.4 5.4 4.8 4.8 4.8
5.1 5.0 4.5
4.9 4.2
5.0 3.6
4.0
4.0
3.0
3.0
2.0
2.0
1.0
1.0
0.0 0.0
2011 2012 2013 2014 2015 2016 2017 2011 2012 2013 2014 2015 2016 2017
(1) In accordance to Property Funds Appendix, CMT’s proportionate share of its joint ventures borrowings and total deposited property are included when
computing the aggregate leverage.
(2) Funds raised ahead of the maturity of the existing borrowings of CMT are excluded from both borrowings and total deposited property for the purpose
of computing the aggregate leverage as the funds are set aside solely for the purpose of repaying the existing borrowings of CMT.
(3) Net Debt comprises gross debt less temporary cash intended for refinancing and capital expenditure. EBITDA refers to earnings before interest, tax,
depreciation and amortisation.
(4) Ratio of net investment income at CMT Group before interest and tax over interest expense.
45 CapitaLand & REITs Corporate Day, Bangkok *August 2018*Well-Diversified Trade Mix
CMT PORTFOLIO(1)
% of Gross Rental Income(2)
For the month of
December 2017
Food & Beverage 31.0
Fashion 12.4
Beauty & Health 11.4
Department Store 6.3
Gifts & Souvenirs / Toys & Hobbies / Books & Stationery / Sporting Goods 5.1
(3)
Leisure & Entertainment / Music & Video 4.6
Services 4.3
Supermarket 4.3
Shoes & Bags 4.2
Office 3.2
IT & Telecommunications 3.1
Home Furnishing 2.6
Jewellery & Watches 2.4
Electrical & Electronics 1.6
Education 1.5
Warehouse 1.4
(4)
Others 0.6
Total 100.0
(1) Includes CMT’s 40.0% interest in Raffles City Singapore (excluding hotel lease), CMT’s 30.0% interest in Westgate and excludes Funan
which was closed in July 2016 for redevelopment.
(2) Excludes gross turnover rent.
(3) Includes tenants approved as thematic dining, entertainment and a performance centre in Bugis+.
(4) Others include Art Gallery and Luxury.
46 CapitaLand & REITs Corporate Day, Bangkok *August 2018*Gross Revenue by Property
CMT PORTFOLIO(1)
% of Total Gross Revenue
For FY 2017
Tampines Mall 10.0
Junction 8 7.4
IMM Building 10.4
Plaza Singapura 11.3
Bugis Junction 10.7
Lot One Shoppers' Mall 5.6
Bukit Panjang Plaza 3.6
The Atrium@Orchard 6.2
Clarke Quay 4.8
Bugis+ 4.1
Bedok Mall 6.8
Other assets(2) 4.9
Raffles City Singapore 11.6
Westgate 2.6
Total 100.0
(1) Includes CMT’s 40.0% interest in Raffles City Singapore, CMT’s 30.0% interest in Westgate and excludes Funan
which was closed in July 2016 for redevelopment.
(2) Includes JCube and Sembawang Shopping Centre which was sold in June 2018.
47 CapitaLand & REITs Corporate Day, Bangkok *August 2018*Top 10 Tenants
10 Largest Tenants Contribute About 19.7% of Total Gross Rental Income(1)
No Single Tenant Contributes More Than 4.0% of Total Gross Rental Income
% of Gross Rental
Tenant Trade Sector
Income
RC Hotels (Pte) Ltd Hotel 3.2
Temasek Holdings (Private) Limited Office 2.7
Supermarket / Beauty & Health /
Cold Storage Singapore (1983) Pte Ltd 2.6
Services / Warehouse
Robinson & Co. (Singapore) Pte Ltd Department Store / Beauty & Health 2.1
NTUC Enterprise Supermarket / Beauty & Health / Services 2.1
BHG (Singapore) Pte. Ltd. Department Store 1.7
Wing Tai Retail Management Pte. Ltd. Fashion / Sporting Goods 1.5
Auric Pacific Group Limited Food & Beverage 1.4
BreadTalk Group Limited Food & Beverage 1.2
Isetan (Singapore) Limited Department Store / Supermarket 1.2
Total 19.7
(1) Based on gross rental income for the month of December 2017 and excludes gross turnover rent.
48 CapitaLand & REITs Corporate Day, Bangkok *August 2018*1H 2018 Gross Revenue
increased by 1.7% versus 1H 2017
On Comparable Mall Basis(1), 1H 2018 Gross Revenue Up 1.9% Y-o-Y
1.7%
Mainly due to higher gross rental
income
(2)
(1) Excludes Funan which was closed in July 2016 for redevelopment and Sembawang Shopping Centre which was sold in June 2018.
(2) Includes Bukit Panjang Plaza, JCube, Funan which was closed in July 2016 for redevelopment and Sembawang Shopping Centre which
was sold in June 2018.
49 CapitaLand & REITs Corporate Day, Bangkok *August 2018*1H 2018 Operating Expenses
decreased by 2.9% versus 1H 2017
On Comparable Mall Basis(1), 1H 2018 OPEX Down 0.3% Y-o-Y
CMT Portfolio 100.1
103.0 2.0%
Tampines Mall 10.4 2.9%
10.6
Junction 8 8.0
8.3
12.5
IMM Building 12.9
11.4
Plaza Singapura 11.5
Bugis Junction 11.8 Mainly due to lower marketing and
11.9
6.5 utilities expenses
Lot One Shoppers' Mall 6.4
5.9
The Atrium@Orchard 6.1
7.3
Clarke Quay 7.2
4.9
Bugis+ 4.7
7.8
Bedok Mall 6.9 1H 2018 1H 2017
Other Assets
(2) 13.6
16.5 S$ million
(1) Excludes Funan which was closed in July 2016 for redevelopment and Sembawang Shopping Centre which was sold in June 2018.
(2) Includes Bukit Panjang Plaza, JCube, Funan which was closed in July 2016 for redevelopment and Sembawang Shopping Centre
which was sold in June 2018.
50 CapitaLand & REITs Corporate Day, Bangkok *August 2018*1H 2018 Net Property Income
increased by 3.7% versus 1H 2017
On Comparable Mall Basis(1), 1H 2018 NPI Up 2.8% Y-o-Y
CMT Portfolio 246.4
237.6
30.1 3.7%
Tampines Mall 29.2
22.1
Junction 8 21.4
30.2
IMM Building 28.8
34.5
Plaza Singapura 33.1
Bugis Junction 30.9
30.3
15.7
Lot One Shoppers' Mall 15.7
19.2
The Atrium@Orchard 18.3
12.5
Clarke Quay 11.8
11.9
Bugis+ 11.8
20.2
Bedok Mall 19.8 1H 2018 1H 2017
Other Assets
(2) 19.1
17.4
S$ million
(1) Excludes Funan which was closed in July 2016 for redevelopment and Sembawang Shopping Centre which was sold in June 2018.
(2) Includes Bukit Panjang Plaza, JCube, Funan which was closed in July 2016 for redevelopment and Sembawang Shopping Centre
which was sold in June 2018.
51 CapitaLand & REITs Corporate Day, Bangkok *August 2018*1H 2018 Performance of Joint Ventures (1)
1H 2018 Net Property Income Up 0.5% Y-o-Y
Gross Revenue (S$ million)
Total 56.7
56.6
46.3 Total
Raffles City Singapore 46.0 0.2%
Westgate 10.4
10.6
Operating Expenses (S$ million)
Total 14.1 Total
14.2 0.8%
Raffles City Singapore 11.2
11.1
Westgate 2.9
3.1
Net Property Income (S$ million)
Total 42.6
42.4 Total
Raffles City Singapore 35.1 0.5%
34.9
Westgate 7.5
7.5
1H 2018 1H 2017
(Charts are of different scales)
(1) This relates to CMT’s 40.0% interest in Raffles City Singapore and 30.0% interest in Westgate.
52 CapitaLand & REITs Corporate Day, Bangkok *August 2018*Available Retail Floor Space
Retail Space at end-2017: 66.6 million sq ft, of which 49.2%
is Estimated to be Shopping Centre Floor Space
53 CapitaLand & REITs Corporate Day, Bangkok *August 2018*54
10.0%
0.0%
2.0%
4.0%
6.0%
8.0%
-6.0%
-4.0%
-2.0%
Q3 2004
Q4 2004
Q1 2005
Q2 2005
Q3 2005
Q4 2005
Q1 2006
Q2 2006
Q3 2006
Q4 2006
Q1 2007
Q2 2007
Q3 2007
Q4 2007
Q1 2008
Q2 2008
Q3 2008
Q4 2008
Q1 2009
Q2 2009
Q3 2009
Q4 2009
Q1 2010
Q2 2010
Sources: CBRE and Singapore Department of Statistics
Q3 2010
GDP Q/Q growth
Q4 2010
Q1 2011
Q2 2011
Q3 2011
Q4 2011
Q1 2012
Q2 2012
Q3 2012
Orchard
Q4 2012
Q1 2013
Fairly Resilient Retail Rents
Q2 2013
Q3 2013
Q4 2013
Q1 2014
Q2 2014
Suburban
Q3 2014
Q4 2014
Q1 2015
CapitaLand & REITs Corporate Day, Bangkok *August 2018*
Singapore Retail Rents and Quarterly GDP Growth
Q2 2015
Q3 2015
Q4 2015
Q1 2016
Q2 2016
Q3 2016
Q4 2016
Q1 2017
Q2 2017
Q3 2017
Q42017
Q1 2018
Suburban Retail Rents Are Especially Resilient to Economic Downturns
Q2 2018
$0.00
$5.00
$40.00
$10.00
$15.00
$20.00
$25.00
$30.00
$35.00Population Growth Drives Local Consumption
Singapore’s Population Estimated to Reach ~ 6.5 - 6.9 Million by 2030(1)
Singapore Population
'000 YoY change
6,000 6%
5%
5,000
4%
4,000
3%
3,000 2%
1%
2,000
0%
1,000
-1%
0 -2%
1995
1996
1997
1998
1999
1983
1984
1985
1986
1987
1988
1989
1990
1991
1992
1993
1994
2000
2001
2002
2003
2004
2005
2006
2007
2008
2009
2010
2011
2012
2013
2014
2015
2016
2017
Singapore Residents Non-Residents % Growth Rate of Total Population
Source: Singapore Department of Statistics
(1) Singapore Population White Paper, January 2013
55 CapitaLand & REITs Corporate Day, Bangkok *August 2018*56
0.0%
1.0%
2.0%
3.0%
4.0%
5.0%
6.0%
Jun-89
Dec-89
Jun-90
Dec-90
Jun-91
Dec-91
Jun-92
Source: Bloomberg
Dec-92
Jun-93
Dec-93
Jun-94
Dec-94
Jun-95
Dec-95
Jun-96
Dec-96
Jun-97
Dec-97
Jun-98
Dec-98
Jun-99
Dec-99
Jun-00
Average (2001 – 2Q 2018): 2.5%
Dec-00
Jun-01
Dec-01
Jun-02
Dec-02
Jun-03
Dec-03
Jun-04
Dec-04
Jun-05
Low Unemployment Rate
Dec-05
Jun-06
Dec-06
Jun-07
Dec-07
Jun-08
Dec-08
Jun-09
Singapore’s Overall Unemployment Rate
Dec-09
Jun-10
CapitaLand & REITs Corporate Day, Bangkok *August 2018* Dec-10
Jun-11
Dec-11
Jun-12
Dec-12
Jun-13
Dec-13
Jun-14
Dec-14
Jun-15
Dec-15
Jun-16
Dec-16
Singapore Has One of the Lowest Unemployment Rates Internationally
Jun-17
Dec-17
Jun-18Singapore Households Have Strong Balance Sheets
Singaporeans Have One of the Highest Percentages of
Home Ownership in the World
Household Assets & Liabilities
S$’bill
2,000
1,800
1,600
1,400
1,200
1,000
800
600
400
200
0
2007 2008 2009 2010 2011 2012 2013 2014 2015 2016 2017
Shares & Securities Insurance Funds CPF Balances
Cash & Deposits Property Total Liabilities
Source: Household Sector Balance Sheet by Department of Statistics, Ministry of Trade & Industry, Republic of Singapore
57 CapitaLand & REITs Corporate Day, Bangkok *August 2018*Singapore International Visitor Arrivals
up 6.2% in 2017
Singapore Tourist Arrivals Upcoming
Developments
million
20
17.4
18 15.6 15.2 16.4
15.1
14.5
16
14 Project Jewel (2019*)
12
10
8
6 Global
4 SARS Financial
Crisis Mandai Makeover (2021*)
2
-
2013
2014
2015
2016
2002
2003
2004
2005
2006
2007
2008
2009
2010
2011
2012
2017
Source: Singapore Tourism Board (STB).
* Subject to change.
58 CapitaLand & REITs Corporate Day, Bangkok *August 2018*Shopping and Population Density Comparison
Shopping Density(1) Population Density(2)
GLA sqm / 1,000 habitants Population / km2
10,000
2,500
2,193 7,796
8,000
2,000 6,698
6,000
1,500
938 4,000
1,000
576
500 2,000
204 515
33
0 0
United States Singapore Hong Kong South Korea United States Singapore Hong Kong South Korea
(1) Source: Cistri. Shopping density data: United States (2016), Singapore (2017), Hong Kong (2015), South Korea (2015), based on shopping centre floor space
(2) Source: Wikipedia
59 CapitaLand & REITs Corporate Day, Bangkok *August 2018*More Experiential Shopping in our Malls
More Experiential and less Department Stores in our Malls compared to United States
Department Store(1) Dining & Entertainment(1)
50 46%
40 35 29%
30
30 25
20
20
9% 15 8%
10 10
5
0 0
United States CMT Portfolio United States CMT Portfolio
(1) Source: Cistri and CMT Portfolio (as at 31December 2014). It is expressed as a percentage of GLA/NLA.
Tampines Mall Westgate
60 CapitaLand & REITs Corporate Day, Bangkok *August 2018*2018 Awards & Accolades Achieved To-date
January 2018 May 2018 August 2018
GoldPLUS (Funan) Patron of Heritage Awards 2017 Winner - Singapore Governance and
Green Mark Certification (Raffles City Shopping Centre) Transparency Index 2018
BCA Awards National Heritage Board (REIT and Business Trust)
Centre for Governance, Institutions and
Platinum (Westgate) Organisations in collaboration with CPA
Green Mark Certification Australia and Singapore Institute of Directors
BCA Awards
July 2018
Silver Award Most Honoured Companies -
Best Annual Report – 2nd in Singapore
REITs & Business Trusts Developed Markets
April 2018 Singapore Corporate Awards (Small and Mid cap)
Institutional Investor 2018
GoldPLUS Design (Funan) Silver Award
Universal Design Mark Corporate Governance -
Best Investor Relations – 2nd in Singapore
BCA Awards
REITs & Business Trusts Developed Markets
Singapore Corporate Awards
(Small and Mid cap)
Institutional Investor 2018
Friend of the Arts Award
(Raffles City Shopping Centre) Best IR Companies –
Patron of the Arts Awards 2018 2nd in Singapore
National Arts Council Developed Markets
(Small and Mid cap)
Institutional Investor 2018
61 CapitaLand & REITs Corporate Day, Bangkok *August 2018*You can also read