Commercial Market Insights - May 2021 National Association of REALTORS Research Group - National Association of ...
←
→
Page content transcription
If your browser does not render page correctly, please read the page content below

Commercial Market
Insights
May 2021
National Association of REALTORS® Research Group
Contents
The commercial real estate market is recovering,          Page
although commercial real estate transactions and          3      Economic Conditions
the underlying market fundamentals are still weak
compared to pre-pandemic conditions.                      5      Overview
Year-to-date through April 2021, commercial               7      Multifamily
transactions were 10% below the level one year ago.
Commercial real estate prices continue to firm up,        9      Office
but valuations were still broadly down by 5% in April
compared to January 2020.                                 11     Industrial

Cap rates, adjusted for the risk-free 10-year T-bond      13     Retail
yield (1.6% in April 2021), continued to trend
downwards, which means commercial prices are              16     Hotel
firming up and that investors are more confident of
the cash flow outlook of the acquired properties.
                                                          Download the Case
Secondary/tertiary cities and the suburban areas are      Studies on Repurposing
still outperforming the primary cities. On a year-over-   Vacant Hotels/Motels
year basis, apartment rents and office rents are still
                                                          into Multifamily Housing
below pre-pandemic levels in San Francisco, Seattle,
New York, and Washington DC . However, apartment
rents are rising in 95% of metro areas given the tight
supply of housing, owned and rented.

Investors have been acquiring some hotels for
conversion into multifamily housing as documented
in NAR’s Case Studies on Repurposing Vacant
Hotels/Motels into Multifamily Housing.

E-commerce and the accelerated use of technology
during this working-from-home period has been the
growth driver for industrial properties and non-core
assets like data centers.

NAR Research anticipates that commercial
transactions will continue to improve in 2021 and
even more strongly in 2022, with the population
practically vaccinated by the end of summer 2021, as
more businesses increase their operating capacity,
travel resumes, workers start heading back to the
office, and consumers spend some of their savings
on leisure and recreation and personal services.

Enjoy reading the latest issue!
www.nar.realtor/research-and-statistics
                                              1
Economic Conditions
14.1 million payroll generated from May 2020-
April 2021 with 8.2 million jobs to recover                               14.1 Million Payroll Jobs Created With
                                                                          8.2 Million Lost Jobs to Recover as of
The economy continues to recover and jobs are                                            April 2020
coming back, although at a modest pace
compared to the third quarter surge. As of April                         155000                              152,523
2021, the economy has gained 14.1 million jobs,                         150000

                                                         In thousands
or 63% of the 22.4 million jobs lost during                             145000                                              144,308
March and April 2020. There are 8.2 million                             140000
nonfarm payroll jobs still to be recovered.                              135000
                                                                        130000
                                                                         125000                               130,161
About 34% of the 8.2 million jobs to still recover
                                                                        120000
are in leisure and hospitality, followed by the                           115000
government sector (local), health care and

                                                                                   Mar/2019

                                                                                   Mar/2020

                                                                                   Mar/2021
                                                                                    Jan/2019

                                                                                   May/2019
                                                                                     Jul/2019

                                                                                   Nov/2019
                                                                                   Jan/2020

                                                                                   May/2020

                                                                                    Jan/2021
                                                                                    Jul/2020

                                                                                   Nov/2020
                                                                                   Sep/2019

                                                                                   Sep/2020
social assistance, professional and businesses
services, and manufacturing. Only the finance
and insurance industry had job gains.

While jobs are coming back, only a few metro
areas have more jobs as of April 2021 compared                Source: BLS Establishment Survey
to February 2020.

                                                                               Nonfarm Payroll Jobs Lost since
                                                                                February 2020 as of April 2021

                                                         -2,848                                  Leisure & Hospitality
                                                                         -1,244                  Government
                                                                             -828                Health Care & Social Assistance
                                                                             -748                Professional & Business Services
                                                                                -515             Manufacturing
                                                                               -400              Retail Trade
                                                                                -352             Other Services
                                                                                -342             Educational Services
                                                                                 -228            Wholesale Trade
                                                                                 -227            Information Services
                                                                                  -196           Construction
                                                                                  -142           Transportation & Warehousing
                                                                                   -101          Real Estate, Rental & Leasing
                                                                                    -75          Mining and Logging
                                                                                      -7         Utilities
                                                                                           39    Finance and Insurance

                                                                         Source: BLS Establishment Survey

                                                     5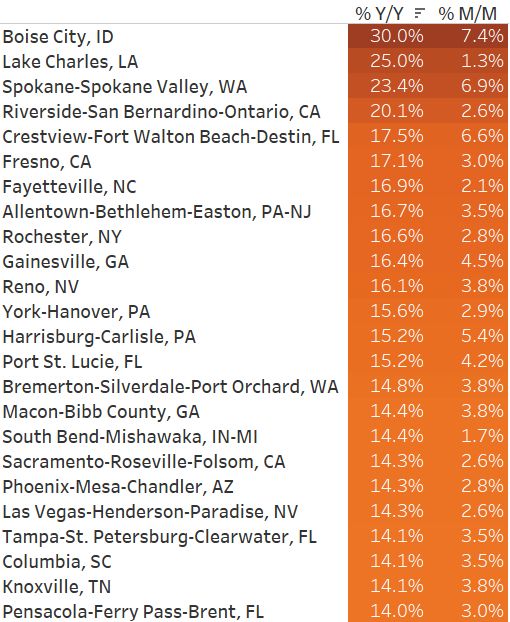
Economic Conditions
r
18% of the workforce still working from home
Workers continued to head back to the office. As of
April, 18% of workers teleworked, down from a peak
of 35%, but still about thrice the 5.7% share in 2019.
80
Percent of Employed Who Teleworked
Workers 16 years old and over
Computer and mathematical
Among computer and mathematical workers, 57%
60 56.6
are teleworking, about five-fold from the 12% share
in 2019. The fraction is likely to continue to decline 40
as more people get vaccinated by the end of
summer, with hybrid workstyle for some workers. 20 12.2 18.3
0 5.7
54% of small businesses operating at higher
2019
1-Nov
20-May
20-Jul
Jan-21
Feb-21
20-Jun
1-Oct
1-Aug
1-Dec
Apr-21
1-Sep
Mar-21
capacity as of April 2021
As the economy continues to recover, a businesses
are starting to operate at higher capacity. As of the
week of May 22, 54% of small businesses were Source: BLS COVID-19 Supplemental Survey
operating at higher capacity compared to one year
ago as COVID-19 cases started to accelerate.
Manufacturer’s new orders during March 2021 were Percent of Small Businesses
already slightly above pre-pandemic level. Operating at Higher Capacity
60.0 Compared to One Year Ago
55.0 54.2
50.0
45.0
Inflation surged to 4.2% in April 2021 40.0 38.9
35.0
The inflation rate (all items) surged to a jaw- 30.0
dropping 4.2% in April 2021 due to rising energy
21/Nov/2020W
10/Oct/2020W
03/Apr/2021W
17/Apr/2021W
15/Aug/2020W
29/Aug/2020W
12/Sep/2020W
26/Sep/2020W
05/Dec/2020W
19/Dec/2020W
02/Jan/2021W
20/Feb/2021W
06/Mar/2021W
20/Mar/2021W
and transportation prices. Energy prices rose 25%
while transportation prices rose 5.6% due to rising
oil prices. The spot price for West Texas
Intermediate rose to $61.7/barrel in April after
plummeting to $16.6 one year ago at the nadir of
the pandemic. Oil prices have been rising with Source: US Census Bureau Small Business Pulse Survey
rising global demand as the global economy
recovers from the pandemic. Core inflation rate,
which strips out prices of food and energy, also Inflation is Rising
rose to 3%.
Headline inflation 24-month rolling
The Federal Open Market Committee has adopted 5.0
4.2
an average inflation target in setting monetary 4.0
policy. It has not defined the window of time to 3.0
calculate the average. But on a 2-year rolling
window, the average inflation rate (headline) is 2.0
1.6
now at 1.6% which is near the 2% inflation target. 1.0
This higher inflation rate will likely raise mortgage 0.0
rates as investors anticipate the Fed will start to
Mar/2019
Mar/2020
Mar/2021
Jan/2019
May/2019
Jan/2021
Jul/2019
Nov/2019
Jan/2020
May/2020
Jul/2020
Nov/2020
Sep/2019
Sep/2020
put the brakes on the easy monetary policy.
US Census Bureau 3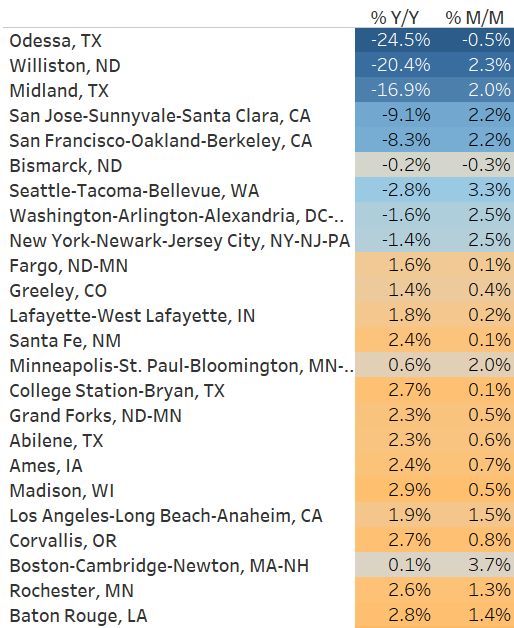
Commercial Market Overview
Commercial sales transactions during Jan-Apr
2021 are lower by 10% from year-ago level Monthly Commercial Sales of
Properties or Portfolios $2.5M or over
Compared to the dollar sales volume in April one $100.0
year ago as the COVID-19 pandemic was just $80.0
unravelling, commercial real estate acquisitions of at
least $2.5 million rose 66% in April to $28.2 billion. $60.0
However, on a year-to-date basis, sales are still 10% $40.0
below last year’s level. $20.0
$28.3
Year-to-date sales transactions were below the levels $0.0
'06Sep
'08Feb
'10Dec
'13Oct
'01Jan
'15Mar
'20Nov
'03Nov
'05Apr
'12May
'16Aug
'18Jan
'19Jun
'02Jun
'09Jul
one year ago for office, retail, as well as industrial
properties. However, the dollar volume of
acquisitions increased for hotel, apartment, and
senior housing assets. Investors have been acquiring
some hotels for conversion into multifamily housing
Source: Real Capital Analytics
as documented in NAR’s Case Studies on
Repurposing Vacant Hotels/Motels into Multifamily
Housing. YTD '21
Vol ($b) YOY Cap Rate
Cap rates are falling
Office 28.0 -22% 6.6%
Cap rates, adjusted for the risk-free 10-year T-bond Retail 11.4 -24% 6.5%
yield (1.6% in April 2021), continued to trend Industrial 27.7 -12% 5.9%
downwards, which means commercial prices are Hotel 7.2 39% 8.6%
firming up and that investors are more confident on
Apartment 48.3 5% 5.0%
the cash flow outlook of the acquired properties.
Snr Hsg & Care 4.3 3% 5.5%
Acquisitions for apartment properties had the lowest
risk spread (cap rate less 10-year T-note) at 3.4 %, Dev Site 5.7 -43%
followed by industrial acquisitions, at 4.3%. Hotel Total 132.5 -10%
acquisitions had the highest risk spread at 7.0%. *All-Property Index; excludes Hotel, Snr Hsg & Care
Retail and office property acquisitions risk spread
were both at 4.9%. Risk spreads have declined as the
percentage of CMBS delinquent loans has also
declined to 6.5% Cap Rates Less 10-Year T-Bond Rate
10.0%
CMBS Marked as 30 Days + Delinquent 8.0%
7.0%
as of April 2021 6.0%
All Industrial Lodging 4.9%
4.0% 4.3%
3.4%
30 Multifamily Office Retail 2.0%
25
0.0%
20
Jan-17
Jan-20
Jan-02
Jan-11
Jul-03
Jan-05
Jul-06
Jan-08
Jul-09
Jul-12
Jan-14
Jul-15
Jul-18
15 15.65
10 10.83
5 6.52 Apartment Industrial
2.28
0 2.1 Retail Office
0.71 Hotel
Jan-19
May-19
Jan-21
Jul-19
Jan-20
May-20
Sep-19
Nov-19
Jul-20
Nov-20
Sep-20
Mar-19
Mar-20
Mar-21
2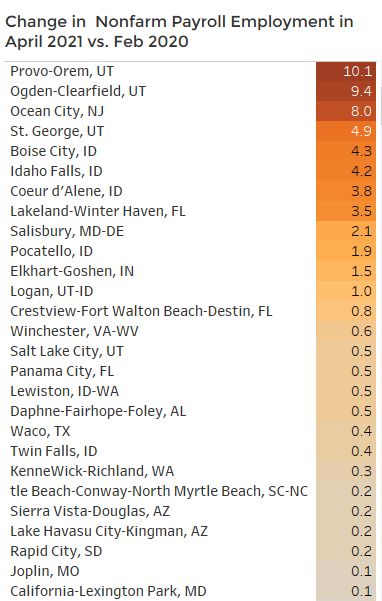
Commercial Market Overview
Commercial real estate prices are
recovering, but are down 5% since January Percent Change in Commercial
2020 Property Prices vs. Jan 2020
Commercial real estate prices continue to firm 0.0%
up, but the value of commercial real estate is
-2.0%
still broadly down by 5% compared to the level
in January 2020, based on the Green Street -4.0%
Commercial Price Index, an appraisal-based -5.3%
index of high-quality properties held by REITs. -6.0%
The decline has tapered off from about 10% in -8.0%
the second quarter of 2020. Among core
properties only (multifamily, office, industrial, -10.0%
retail), prices are down by 3.5% from January
-12.0%
2020.
Oct/2020
Feb/2020
Mar/2020
May/2020
Nov/2020
Feb/2021
Mar/2021
Apr/2020
Jul/2020
Apr/2021
Jun/2020
Aug/2020
Sep/2020
Dec/2020
Jan/2021
Real estate associated with e-commerce
and infrastructure have highest returns
The return on REIT funds is a good indicator of
the valuation of the properties that are held by
REIT funds. The total return on REITs invested Total Return (%) of Equity REITS as of April
in various types of assets is positive, except for 2021 Compared to January 2020
office REITs which continue to show a loss of 40.0%
nearly 9%. The highest total returns (price and 35.0%
30.0%
26.0%
dividend) as of April 2021 relative to January 20.0% 20.0%
2020 were in self-storage (35%), industrial 10.0%
(26%), and infrastructure (20%). The return on 5.7%
0.0%
REITS invested in lodging has reversed from a -8.9%
-10.0%
loss to a positive return of about 6%, an
-20.0%
indication that the hotel sector is recovering
as travel is starting to pick up. -30.0%
-40.0%
-50.0%
-60.0%
Feb-20
May-20
Oct-20
Apr-20
Jul-20
Aug-20
Nov-20
Jan-21
Feb-21
Apr-21
Jun-20
Sep-20
Mar-20
Dec-20
Mar-21
office industrial
retail apt
lodging healthcare
self-storage Infrastructure
Source: Nareit
Source: Trepp 3Multifamily
Transactions up 5% in Jan-April 2021 with higher demand for
low-rises
Apartment sales transactions during Jan-Apr
Apartment Sales Transactions Volume
2021 up 5% from year-ago level
of $2.5M or Over (in Billion $)
Acquisitions for multifamily properties of $2.5 Garden Mid/highrise
$20
million rose 5% in the first four months of the
Billions
year from one year ago. $15
Acquisitions of garden or low-rises (less than $10
four flours) was up 8% while acquisition for mid- 6.8
to-high rises was down by 1%. Garden or low- $5
$3.4
rises are usually in the suburbs which indicates
stronger demand for multifamily housing in the $0
'01Jan
'02Jun
'05Apr
'06Sep
'08Feb
'09Jul
13Oct
'18Jan
'19Jun
'20Nov
'03Nov
'10Dec
'15Mar
'16Aug
'12May
suburbs than in the central business districts.
In fact, the share of garden or low-rises has
been rising, to 83% of the total number of
property acquisitions as of April.
Share of Garden/Low-rise Apartment
The cap rate, adjusted for the 10-year T-note Sales to Total Apartment Sales
(1.6%), has declined for both garden/low rises 1
and mid/high-rises. Mid-rises have a slightly
lower risk spread of 3.1% compared to 0.9
garden/low-rises of 3.5% but the gap between
83%
these cap rates has narrowed, which again 0.8
points to the growing demand for housing in
the suburbs.
0.7
0.6
'07May
'12Feb
'10Jul
'04Mar
13Sep
'15Apr
'20Jan
'18Jun
'01Jan
'02Aug
'05Oct
'08Dec
'16Nov
Most Active Multifamily Markets in
April 2021 by Number of Property
Acquisitions
Los Angeles 170
Dallas 108
Phoenix 93 Cap Rates Less 10-Year Bond
Atlanta 75
Houston 56 6.0%
Denver 48 5.0%
Miami/Dade Co 46
San Diego 46 4.0%
Chicago 45 3.5%
3.0%
No NJ 43 3.1%
Minneapolis 37 2.0%
Boston 37 1.0%
Manhattan 37
NYC Boroughs 37 0.0%
Austin 37
'02Jan
'03May
'08Sep
'16Sep
'07May
'11May
'12Sep
'19May
'10Jan
'14Jan
'15May
'18Jan
'20Sep
'04Sep
'06Jan
5
Portland 37
Tampa 34
Richmond/Norfo… 32
Tertiary Mid-… 31 Garden/Low-rise Mid/high-rise
Charlotte 31
San Antonio 31
Source of data: Real Capital AnalyticsMultifamily
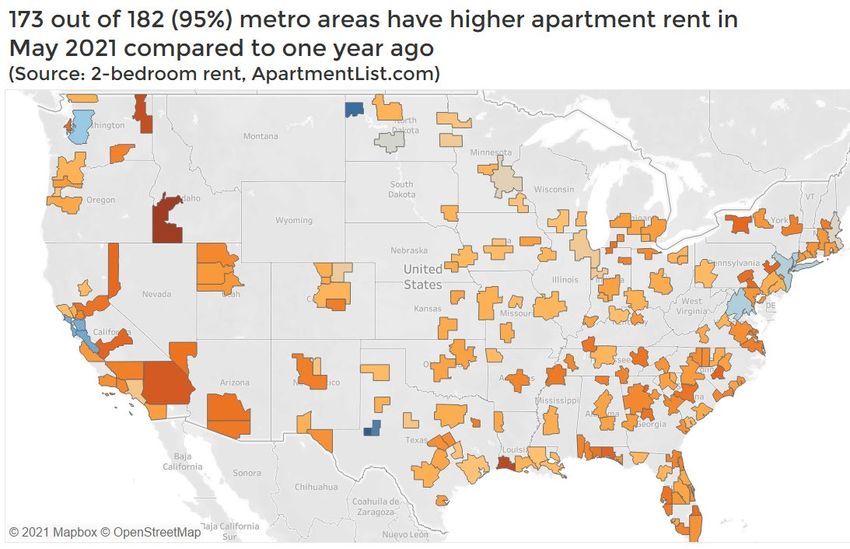
Rents up in 95% of metro areas from one year ago
According to ApartmentList.com®, rents for 2-bedroom apartments were higher in May 2021 from
one year ago in 95% (173 out of 182) metro areas it tracks. Nationally, 2-bedroom rents were up 2.2%.
Among the nine metros with still lower rents are San Francisco (-9.1%), San Jose (-8.3%), Seattle (-
2.8%), Washington DC (-1.6%), and New York (-1.4%) . However, rents are recovering are up month-
over-month in May 2021.
5Office
Transactions down 22% during Jan-April 2021 with the
suburbs accounting for most of the acquisitions
With businesses still strategizing on their work-
from-home policies, acquisitions of office real Office Sales Transactions of $2.5M or
estate properties or portfolios of $2.5 million or over Over as of April 2021 (in Billion $)
during January-April 2021 were 22% below the level 30.0 Office - CBD Office - Sub
one year ago.
25.0
Year-to-date, acquisitions declined in both the 20.0
central business district areas (-21%) and in 15.0
suburban areas (-23%). 10.0
5.0 $5.0
Since 2010, CBD areas have accounted for just 10%
$1.8
of the number of property acquisitions compared 0.0
'05May
'12Dec
'20Jul
'01Jan
'08Aug
'02Feb
'06Jun
'09Sep
'14Jan
'15Feb
'17Apr
'19Jun
'03Mar
'04Apr
'07Jul
'10Oct
'11Nov
'16Mar
'18May
to about 15% prior to the pandemic.
Cap rates, adjusted for the 10-year-T-note (1.6%)
trekked downward to 4% for properties in CBD
markets and to 5.1% in suburban markets, which
means that commercial asset prices are firming up. Share of CBD Office Property Sales to
Total Sales
Los Angeles, Dallas, Phoenix, Atlanta, and Houston 30%
that had the most office property investor deals in 25%
April 2021. 20%
15%
Most Active Office Markets in April 10% 10%
2021 by Number of Property 5%
Acquisitions
0%
Los Angeles 64
'06Sep
'08Feb
'10Dec
'01Jan
'15Mar
'20Nov
'03Nov
'05Apr
'12May
13Oct
'16Aug
'18Jan
'19Jun
'02Jun
'09Jul
Seattle 47
Dallas 46
Boston 45
Atlanta 41
Phoenix 38
No NJ 31
San Jose 31 Cap Rates Less 10-Year Bond Rate
Denver 28
Salt Lake City 28 CBD Suburban
Houston 25 7.0%
San Diego 25
Philadelphia 6.0%
23
Miami/Dade Co 21 5.0% 5.1%
Chicago 20 4.0% 4.0%
Broward 19 3.0%
Austin 19 2.0%
Detroit 18 1.0%
Manhattan 18 0.0%
Orange Co 18
'02Jan
'03May
'08Sep
'16Sep
'07May
'11May
'12Sep
'10Jan
'14Jan
'15May
'18Jan
'19May
'20Sep
'04Sep
'06Jan
Raleigh/Durham 17
Source of data: Real Capital Analytics
7Office
Occupancy continues to decline in 2021 Q1
Negative net absorption in 2021 Q2
Net Absorption of Office Space (Million
Office occupancy continued to decline in
Sq. Ft.) and Vacancy Rate
2021 Q1, with 41 million square feet of space
released by tenants. All in all, 138.4 million 30 20.0%
sq. ft. of office space has become 20 16.4%
Millions
unoccupied since 2020 Q2, leading to a 10 15.0%
-
sharp rise in vacancy rate, to 16.4%, from 12% (10) 10.0%
in 2020 Q2. (20)
(30) 5.0%
Asking rents have are still depressed, such (40)
(50) 0.0%
as in San Francisco (-12%) and New York
2018 Q1
2018 Q4
2015 Q1
2015 Q4
2012 Q1
2012 Q4
2014 Q2
2016 Q3
2017 Q2
2019 Q3
2020 Q2
2021 Q1
2013 Q3
Midtown South (-9%). But in cities with low
office vacancy rates, asking rents have
sharply increased, such as In Fort
Myers/Naples, Roanoke, Colorado Springs, El Absorption Vacancy Rate
Paso, Sacramento, with asking rents at over
10%.
Cities with Lower Year-over-Year Percent
Cities with Higher Year-over-Year
Change in Office Asking Rent
Percent Change in Office Rent
-12.0% San Francisco
-8.8% New York - Midtown South Fort Myers/Naples 23.4%
Portland Roanoke 20.4%
-4.6% Colorado Springs 17.4%
-3.9% Boston San Jose 15.0%
-3.6% Fort Worth El Paso 12.9%
-2.8% New York - Downtown Sacramento 11.8%
New Haven Nashville 9.4%
-2.8% Austin 8.4%
-2.3% Seattle Greenville 6.8%
-1.7% Binghamton Hampton Roads 6.8%
-1.7% Orange County Omaha 6.5%
-0.9% Northern VA Oakland/East Bay 6.0%
Milwaukee 5.8%
-0.9% Dallas Los Angeles Non-CBD 5.7%
-0.9% Jacksonville Fort Lauderdale 5.5%
-0.8% St. Petersburg/Clearwater Southern NH 5.3%
-0.7% Hartford Savannah 5.1%
Syracuse 5.1%
-0.6% Houston Chicago 5.0%
-0.6% Tulsa Minneapolis/St. Paul 4.9%
-0.4% New York - Midtown Tucson 4.8%
-0.3% Long Island Charleston 4.8%
Raleigh/Durham 4.4%
-0.2% Baltimore Atlanta 4.2%
-0.1% Washington Charlotte 4.2%
-0.1% Salt Lake City San Francisco North Bay 4.2%
Puget Sound - Eastside 4.0%
Source of data: Real Capital Analytics
7Industrial
Acquisitions increased 66% in April 2021, as investors
preference for warehouse space continues
Acquisitions of industrial properties of $2.5 million
or over rose 66% in April 2021, as acquisitions Industrial Sales Transactions of $2.5M
increased for both flex (124%) and warehouse (52%). or Over as of January 2021
$30 (in Billions $)
The majority of industrial acquisitions—75% — is for
$20
warehouse space. Although flex has a significant
y/y volume change with respect to April 2020’s
dismal performance, investors have not shift their $10
preference from warehouses. Warehouses
continue to be more attractive to investors $-
considering the strength and durability displayed
Jan-01
May-02
May-10
Jan-13
May-14
Jan-17
May-18
Jan-21
Jan-05
May-06
Jan-09
Sep-03
Sep-07
Sep-11
Sep-15
Sep-19
throughout the pandemic, in addition to the
acceleration of online shopping trends for which
require space to fulfill and distribute. Flex Volume Warehouse Volume
The average cap rate among warehouse
acquisitions has been treading downwards, to YoY Change for Industrial Properties
5.8%, which indicates higher valuations in 8
comparison to acquisitions in the past year. Even
with higher valuations, investor interest for the 6
acquisition of warehouse space persists. While 4
across the long-term, flex space average cap rates 2
has been trending downwards, to 6.0% in January
and February 2021 respectively, rates remain 0
essentially unchanged as they marginally -2
increased to 6.1% in March and April 2021.
May-12
Oct-13
Jan-18
Nov-20
Jan-01
Nov-03
Feb-08
Jul-09
Aug-16
Apr-05
Sep-06
Jun-02
Dec-10
Jun-19
Mar-15
YTD through April 2021, the most active markets
with respect to industrial property acquisitions Flex YoY Chg Warehouse YoY Chg
were Atlanta (28), Los Angeles (26), Boston (22),
Chicago (21) and San Diego (18).
Share of Industrial Warehouse
Industrial Property Cap Rates Acquisitions to Total Acquisitions
0.15 100.0%
80.0%
0.1
60.0%
40.0%
0.05
20.0%
0 0.0%
Jan-01
Aug-02
May-07
Feb-12
Sep-13
Jan-20
Mar-04
Dec-08
Oct-05
Jul-10
Apr-15
Nov-16
Jun-18
Oct-04
Oct-09
Oct-14
Oct-19
Jan-11
Jan-16
Jan-21
Jan-01
Jan-06
Apr-12
Apr-17
Apr-02
Jul-03
Apr-07
Jul-08
Jul-13
Jul-18
Flex Avg. Cap Rate Source: Real Capital Analytics
Warehouse Avg
Cap Rate
9Industrial
Occupancy increases and vacancy rate falls in 2021 Q1
Industrial Occupancy Continues to
Increase in 2021 Q1
Net Absorption of Industrial Space (in
Industrial vacancy rate declined to 4.9 Million Sq. Ft.) and Vacancy Rate
percent. The areas with the lowest vacancy 100 10.0%
Millions
rates include Providence, Orange County, 80 8.0%
Los Angeles, Philadelphia, and the New
Jersey-Central area, Nashville, Boise, Reno, 60 6.0%
Tulsa, and Hampton Roads Virginia. 40 4.0%
20 2.0%
During 2021 Q2 through 2021 Q1, Atlanta saw
the largest increase in net absorption of - 0.0%
industrial space, followed by the Inland
2018 Q1
2018 Q4
2015 Q1
2015 Q4
2012 Q1
2012 Q4
2014 Q2
2021 Q1
2016 Q3
2017 Q2
2019 Q3
2020 Q2
2013 Q3
Empire, Pennsylvania I-87/79 corridor,
Chicago, and Dallas.
Absorption Vacancy Rate
Industrial Vacancy Rate in 2021 Q1 Industrial Net Absorption 2020 Q2-
2021 Q1 in Million Square Feet
Providence, RI 0.1%
Orange County, CA 1.9% Atlanta, GA 29.0
Inland Empire CA 24.9
Los Angeles, CA 2.0% Pennsylvania I-81/I-78 23.0
Philadelphia, PA 2.2% Chicago, IL 19.5
Dallas/Ft. Worth, TX 18.8
New Jersey - Central 2.3% Phoenix, AZ 18.2
Nashville, TN 2.3% Houston, TX 16.4
Memphis, TN 10.5
Boise, ID 2.5% Indianapolis, IN 10.3
Reno, NV 2.8% New Jersey - Central 10.0
Kansas City, MO 9.3
Tulsa, OK 2.8% Columbus, OH 8.7
Hampton Roads, VA 2.8% Louisville, KY 7.6
Savannah, GA 7.5
Richmond, VA 3.0% Milwaukee, WI 7.3
Inland Empire CA 3.0% Philadelphia, PA 6.1
St. Louis, MO 5.2
Greensboro/Winston-… 3.1% Salt Lake City, UT 5.2
Omaha, NE 3.2% Baltimore, MD 4.8
Fort Myers/Naples FL
Cincinnati, OH 4.7
3.2% Orlando, FL 4.3
Portland, OR 3.3% Reno, NV 4.2
Savannah, GA 3.5%
Los Angeles, CA 4.1
Las Vegas, NV 4.0
New Jersey - Northern 3.5% Boise, ID 3.8
Milwaukee, WI 3.6% Nashville, TN 3.7
San Antonio, TX 3.4
Long Island, NY 3.8% Denver, CO 3.4
Cleveland, OH 3.8% Jacksonville, FL 3.0
Minneapolis, MN 2.9
Lakeland, FL 2.6
Austin, TX 2.5
Charlotte, NC 2.1
Source of data: Real Capital Analytics Miami, FL
7
2.0Retail
Retail property acquisitions increased dramatically
from year-ago levels
Commercial sales/acquisitions of retail Retail Sales Transactions of $2.5M or
properties or portfolio acquisitions of $2.5 $25Over as of January 2021 (in Billions $)
million or more recorded $2.6 billion in April $20
2021. This represents a year-over-year increase
$15
of 46%, but this growth is misleading as
$10
Billions $
investors remain unsure and cautious about
the retail property sector. In the upcoming $5
months, retail growth will appear to be quite $-
strong because they are compared to
Jan-01
May-07
Aug-02
Feb-12
Sep-13
Dec-08
Apr-15
Jan-20
Mar-04
Oct-05
Jul-10
Nov-16
Jun-18
pandemic activity. But looking at pre-
pandemic retail activity illustrates weakness in
deal activity. Shops Volume
Centers Volume
The average cap rate for all retail remains
unchanged for all of 2021 at 6.5%. Cap rates for
centers are moving upwards to 7.3% while cap
rates for shops came down from the prior
month, 6.2%, to 6.1% for April 2021. YoY Change for Retail Properties
15
The average price per square foot of retail 10
increased in April 2021 to $183, up $6 from the
prior month and down 14% from year-ago 5
levels. Center cap rates were $145/sq.ft. while 0
shops averaged $252/sq.ft..
-5
Jun-02
Jul-09
May-12
Jan-01
Jan-18
Aug-16
Nov-20
Sep-06
Dec-10
Feb-08
Nov-03
Apr-05
Oct-13
Mar-15
Jun-19
YTD through April 2021, the most active
markets with respect to retail property
acquisitions were Phoenix (25), Atlanta (24),
Dallas (23) and Houston (18).
Shops YoY Chg
Centers YoY Chg
Retail Property Cap Rates
0.1 Share of Retail Center Acquisitions to
Total Acquisitions
0.05 120.0%
100.0%
0 80.0%
60.0%
Jan-16
Jan-19
Jul-02
Jan-04
Jul-05
Jan-07
Jul-08
Jan-10
Jan-13
Jul-20
Jan-01
Jul-14
Jul-17
Jul-11
40.0%
20.0%
0.0%
Shops Avg. Cap Rate
May-18
Jan-21
Jan-01
May-02
May-10
Jan-13
May-14
Jan-17
Jan-05
May-06
Jan-09
Sep-19
Sep-03
Sep-07
Sep-11
Sep-15
Centers Avg
Cap Rate
Source: Real Capital Analytics
11Retail
Quarterly E-Commerce Sales
Census Bureau of the Department of Commerce
estimates seasonally adjusted U.S. retail e-commerce
Total Retail Sales % Change from
sales increased 39% year-over-year in Q1 2021 as
Prior Quarter, SA, Millions
consumers received economic impact payments, saw
multiple vaccines came onto the market with 15.0%
increasing distribution, declination of COVID-19 rates 10.0%
7.8%
5.0%
and easing of pandemic-related restrictions. With 0.0%
increasing consumer confidence and more money in -5.0%
their pockets, consumers spent more as Q1 2021 total -10.0%
retail sales and e-commerce spending outpaced that of
Q4 2014
Q2 2016
Q4 2017
Q2 2019
Q4 2020
Q4 1999
Q2 2001
Q4 2002
Q4 2008
Q2 2010
Q4 2011
Q2 2013
Q2 2004
Q4 2005
Q2 2007
the same period last year.
Total U.S. retail sales were estimated at $1,581.4 billion in
Q1 2021, up 7.8% from Q4 2020 and up 16.8% on a year-
Source: U.S. Census Bureau
over-year basis. Q1 2021’s 7.8% quarter-over-quarter is
the second largest increase for any quarter for which is
only behind Q2 2020’s historic 12.1% change as the
global pandemic caused a significant increase in e- Total Retail Sales % Change from
commerce demand as retailers widespread were Same Quarter YoY, SA
forced to cease store operations in an effort to mitigate
the spread of the coronavirus. 20.0%
15.0% 16.8%
10.0%
Q1 2020’s total retail sales as a percent change from the 5.0%
prior quarter is significantly higher than Q1 2020’s -1.2%. 0.0%
-5.0%
Q1 2021’s percent change is notably higher than even -10.0%
pre-pandemic numbers. On a year-over-year basis, total -15.0%
Q4 2020
Q4 1999
Q4 2008
Q2 2010
Q4 2011
Q2 2013
Q4 2014
Q2 2016
Q4 2017
Q2 2019
Q2 2001
Q4 2002
Q2 2004
Q4 2005
Q2 2007
retail sales 16.8% change is the highest year-over-year
increase for any quarter ever recorded. Q1 2021’s historic
increase is more than eight times the 2.0% growth rate
recorded in the first quarter of last year and more than
double what was recorded in Q2, Q3 and Q4 of 2020. To Source: U.S. Census Bureau
put into perspective, Q1 2021’s growth from the same
quarter a year ago is more than the growth realized in
every quarter in 2020 combined, although, there was a
dramatic decrease of -3.6% in Q2 2020.
Quarterly Total E-Commerce
E-commerce growth across the first three months of Retail Sales % Change YoY
2021, 39.1%, is the almost three times the amount of 80.0%
growth recorded in Q1 2020, 14.0%, which caught only a 60.0%
couple of weeks’ worth of retail spending once the 39.1%
40.0%
national emergency was declared. As a result of 20.0%
consumers staying in and retailers being forced to close 0.0%
dependent upon if they were deemed an essential or -20.0%
non-essential business, e-commerce significantly
Q2 2002
Q2 2005
Q2 2008
Q4 2012
Q4 2015
Q4 2018
Q2 2020
Q4 2000
Q4 2003
Q4 2006
Q4 2009
Q2 2014
Q2 2017
Q2 2011
ticked upward to a historical 43.8% year-over-year
increase in Q2 2020. Q1 2021’s 39.1% growth rate is the
second highest pandemic period increase, only behind
the Q2 2020 peak.
It is also the fourth-highest recorded rate ever and the Source: U.S. Census Bureau
second-highest rate for any Q1, only behind the 42.9%
recorded in Q1 2001.
11Retail
Quarterly E-Commerce Sales Continued
E-commerce retail sales totaled $215.0 billion in Quarterly E-Commerce Retail Sales as a
Q1 2021 as it captured 13.6% of total retail sales. Percent of Total Sales Since Q1 2019
E-commerce’s portion of total retail sales saw a
significant uptick towards 15.7% in Q2 2020 as 18.0%
consumers continued to get more comfortable 16.0%
and acclimated to purchasing online and as 14.0% 13.6%
retailers tweaked e-commerce operations in an 12.0%
effort to provide consumers with the goods 10.0%
they seek in a more quick and efficient 8.0%
manner. The pandemic has only accelerated 6.0%
those trends that were taking place. But, every 4.0%
quarter after Q2 2020 has seen a decrease with 2.0%
current e-commerce as a percent of total retail
0.0%
sales plateauing at 13.6% for the past two
Q1 Q2 Q3 Q4 Q1 Q2 Q3 Q4 Q1
quarters. 2019 2019 2019 2019 2020 2020 2020 2020 2021
As the pandemic significantly impact
Souce: U.S. Census Bureau
discretionary retail such as dining out,
entertainment and traveling with the
implementation of pandemic-related
restrictions, consumer spending shift to more
goods than services. Considering governments
are loosening pandemic restrictions, increased
vaccines, stimulus checks and sharply
increasing consumer sentiment towards
current business, labor market conditions and
economic outlook, consumer spending habits
may shift back to pre-pandemic trends where
Q2 e-commerce sales data may illustrate a
different, but familiar retail environment.
11Hotel
Acquisitions rose 13% in February 2021, with investor
preference leaning towards full-service hotels
Acquisitions of hotel properties of $2.5 million or
Monthly Commercial Acquisitions of
over rose 39% in the first four months of 2021, as
acquisitions increased for both full-service (64%) Hotel Properties or Portfolios $2.5M or
and limited-service hotels (19%). over
$5
Billions
During this pandemic period, investors seem to $4
be turning their interest towards full-service $3
hotels. Full-service hotels may be more $2
attractive to investors because they offer more
$1 $0.8
revenue segments (convention facilities, spas,
$- $0.3
restaurants/bars) that are likely to do well once
'19Jan
'19Mar
'19May
'19Sep
'20Jan
'20Mar
'19Jul
'19Nov
'20May
'20Sep
'20Jul
'20Nov
'21Jan
'21Mar
personal and business travel picks up after most
of the population is vaccinated by the end of
summer. Full-service Limited service
The average cap rate among full-service hotel
acquisitions has been treading downwards, to
7.7%. The average cap rate among limited-
service acquisitions has remained stable at Share of acquisitions of full-service
nearly 9%. hotels to total hotel property
acquisitions
Acquisitions in the six major metros (New York, 100%
Chicago, Boston, Washington DC, Los Angeles,
and San Francisco) accounted for 19% of 80%
properties acquired. 60%
40%
26%
Most Active Hotel Markets in April 20%
2021 by Number of Property 0%
Acquisitions
'09Aug
'16Jan
'19Sep
'05Dec
'06Nov
'10Jul
'11Jun
'15Feb
'17Nov
'05Jan
'07Oct
'08Sep
13Apr
'16Dec
'12May
'14Mar
'18Oct
'20Aug
Dallas 24
Houston 22
Los Angeles 16
Phoenix 14
Sacramento 10 Year-over-Year Percent Price Change
Chicago 9
Miami/Dade Co 9 11.0%
Orange Co 9
Seattle 8 10.0%
Broward 7
Denver 7 9.0%
San Antonio 8.8%
7
East Bay 7 8.0%
DC VA burbs 6 7.7%
Philadelphia 6 7.0%
Detroit 6
Kansas City 6 6.0%
Boston 6
'06Jan
'07Jan
'09Jan
'10Jan
'16Jan
'17Jan
'19Jan
'20Jan
'13Jan
'08Jan
'15Jan
'18Jan
'11Jan
'12Jan
'14Jan
'21Jan
Jacksonville 6
Orlando 6
Inland Empire 6
Full-Service Limited Service
Source of data: Real Capital AnalyticsHotel
Adaptive reuse of vacant hotels/motels into multifamily
housing
The conversion of vacant hotels/motels is one way NAR survey results based on 29 reported
to help ease the housing shortage, according to conversions:
NAR’s report Case Studies on the Conversion of
Hotels/Motels into Multifamily Housing. • 82% of the hotels/motels converted into
multifamily housing were located in the
The study documents cases of hotel conversions suburbs, small town, resort, or rural areas
using two methods: 1) a survey of NAR commercial
members about their transactions that involved • 54% of the hotels/motels were acquired at
hotels/motels that were planned to be converted a cost of $50,000 /room
into multifamily housing; and 2) five case studies
based n secondary research of hotel/motel • 53% and converted at a cost of $25,000
conversions from company websites, SEC filings, per room
and county records.
• the average rent after conversion was
Adaptive re-use is not only economical, but also can $1,090
be more environmentally-friendly in comparison to
new commercial developments as adaptive re-use • 55% of the hotel/motel conversions
emissions for example, are lower. In addition, new required rezoning
commercial construction costs more than re-use by
about a two-thirds on a per square foot basis.
Conversions can be purely done by private Average Rent Charged After
financing. Where public funding was required, the Conversion of Hotel/Motel
Low- Income Housing Tax Credit (LIHTC), Historic
Tax Credit (HTC), and tax abatement were the 100% market-rate
$1,183
common sources of federal/local funding. The case housing
studies underscore how developers need to
address the zoning requirements to avoid project Mix of affordable
delays and get community buy-in early on. and market-rate $1,090
housing
This study was undertaken upon the
recommendation of the Commercial Real Estate 100% below market
$933
Research Advisory Board under 2021 Chair Dawn rate
Source: NAR Survey
Aspaas and Vice-Chair Beth Cristina.COMMERCIAL MONTHLY INSIGHTS REPORT May 2021 LAWRENCE YUN, PhD Chief Economist & Senior Vice President for Research GAY CORORATON Senior Economist & Director of Housing and Commercial Research BRANDON HARDIN Research Economist MEREDITH DUNN Research Manager Download report at https://www.nar.realtor/commercial-market-insights Download other NAR Commercial reports at Commercial Research ©2021 National Association of REALTORS® All Rights Reserved. May not be reprinted in whole or in part without permission of the National Association of REALTORS®. For question about this report or reprint information, contact data@realtors.org.
The National Association of REALTORS® is America’s largest trade association,
representing more than 1.4 million members, including NAR’s institutes, societies
and councils, involved in all aspects of the real estate industry. NAR membership
includes brokers, salespeople, property managers, appraisers, counselors and
others engaged in both residential and commercial real estate. The term
REALTOR® is a registered collective membership mark that identifies a real estate
professional who is a member of the National Association of REALTORS® and
subscribes to its strict Code of Ethics. Working for America's property owners, the
National Association provides a facility for professional development, research and
exchange of information among its members and to the public and government
for the purpose of preserving the free enterprise system and the right to own real
property.

NATIONAL ASSOCIATION OF REALTORS®
RESEARCH GROUP

The Mission of the NATIONAL ASSOCIATION OF REALTORS® Research Group is to
produce timely, data-driven market analysis and authoritative business intelligence
to serve members, and inform consumers, policymakers and the media in a
professional and accessible manner.

To find out about other products from NAR’s Research Group, visit
www.nar.realtor/research-and-statistics

500 New Jersey Avenue, NW
Washington, DC 20001
202.383.1000
You can also read