2020 CITY COUNCIL FINANCIAL
 FORECAST STUDY SESSION

 GENERAL FUND FINANCIAL
       FORECAST
       2020-2031
←
→
Page content transcription
If your browser does not render page correctly, please read the page content below
2020 CITY COUNCIL FINANCIAL
FORECAST STUDY SESSION
GENERAL FUND FINANCIAL
FORECAST
2020-2031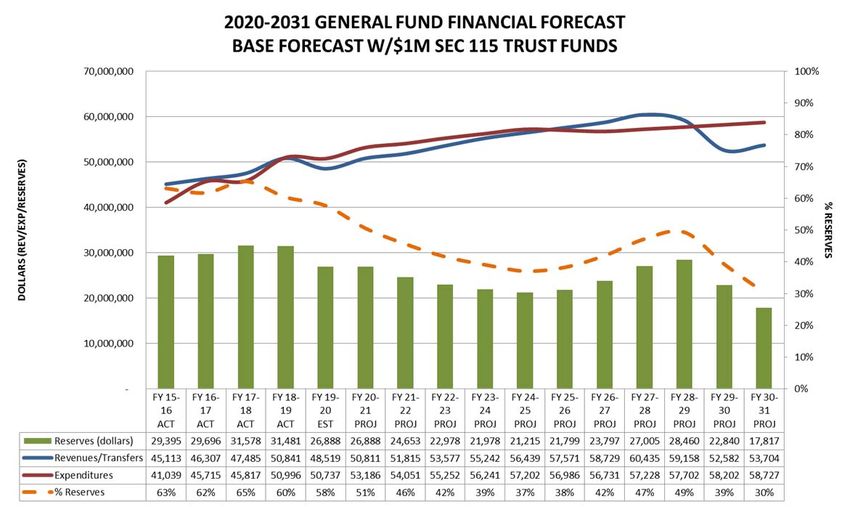
INTRODUCTION

The past year saw mostly positive economic indicators combined with fairly stable
revenues. Early economic forecasts are predicting growth in the economy to continue
into the beginning of 2020. Unemployment levels remain at historic lows and job growth
continues a slow but steady pace. Inflation remains key for economic growth as the
Federal Reserve continues to monitor and adjust interest rates in response to slight
increases in inflation. Property assessed valuations have stabilized nationwide and
continue to increase statewide with increases in La Mesa’s property values consistently
outpacing the countywide average. After showing positive growth over the past several
years, sales tax revenues have been mostly flat over the past year as the trends in
consumer purchases move from traditionally big-box physical locations to online, digital,
and service and entertainment-oriented purchases. The recent closure of Best Buy and
other brick and mortar retail outlets along with slowing auto sales have contributed to
flat growth, although the opening of the Costco Gas in 2020 is expected to offset some
of these losses.

La Mesa continues to benefit from the current economic environment with strong
increases in property values and property tax revenues and the consistent levels of
sales and Proposition L transaction tax revenues. In 2008, the citizens of La Mesa
approved the Proposition L Sales Tax Measure, a general ¾ cent sales tax, in order to
maintain “vital city services” while helping to rebuild depleted General Fund reserves.
Since that time, the revenue received from the Proposition L Sales Tax has become an
essential component of the General Fund revenues and has allowed the City to
maintain operations without declines in service levels. Proposition L is set to sunset in
fiscal year 2028-2029.

Consistent with the Council’s direction at the 2018 Strategic Workshop, the General
Fund Financial Forecast continues to take a longer view by extending the forecast
period to 2030-2031. The forecast reflects conservative to moderate increases to
revenues throughout the forecast period, offset by increases in costs, primarily in
pension costs. The forecast includes the final year of Proposition L Sales Tax revenues
(2028-2029) and the subsequent two years through 2030-2031 without these revenues.
Consistent with previous forecasts, rising pension obligation costs remain the single
fastest increasing expenditure for the General Fund. Anticipated increases in pension
contributions based on all information available from CalPERS are included in the
forecast. Helping to offset the rising pension obligation costs are negotiated cost
sharing agreements that went into effect during 2018-2019 and anticipated contributions
from the Section 115 Retirement Trust Fund, included in the forecast to begin in 2025-
2026. Finally, General Fund reserve balances reflecting the net effects of anticipated
revenues and expenditures are projected through 2030-2031.

Included in this report is the base forecast prepared using the most current information
available at the time, as well as a sensitivity test showing the potential impact of
declines in sales tax and Proposition L transaction tax revenues on reserves.

                                        Page 2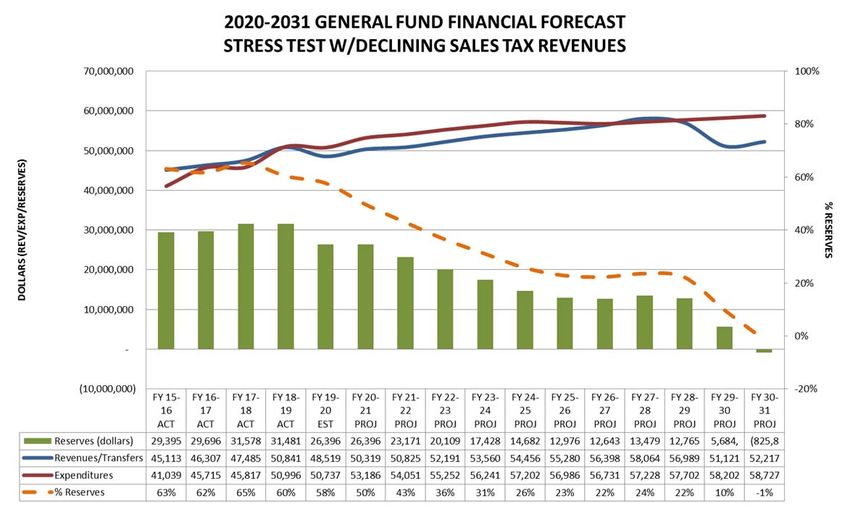
2019-2030 General Fund Financial Forecast

                                      ECONOMY

The U.S. Leading Economic Indicator (LEI) increased 0.8 percent in January, following
a decline of 0.3 percent in December and a small increase of 0.1 percent in November.
Overall, the LEI index has increased 0.1 percent over the previous six months, positive
but considerably lower than increases in the past twelve months. Economists at the
Conference Board indicate that with most indicators moving in the positive direction,
economic growth will continue through 2020. “The LEI’s six-month growth rate has
returned to positive territory, suggesting that the current economic expansion – at about
2 percent – will continue through early 2020. While weakness in manufacturing appears
to show signs of softening, the COVID-19 outbreak may impact manufacturing supply
chains in the US in the coming months.”

The national unemployment rate was little changed at 3.6 percent in January. Notable
job gains occurred in the construction, health care, and transportation and warehousing
sectors. Both the unemployment rate and the number of unemployed persons changed
little in January. January data for the state and local unemployment rates were not
available at the time of this report. The Consumer Price Index for All Urban Consumers
(CPI-U) rose 0.1 percent in January, after rising 0.2 percent in each of the previous
three months (October through December). The increase in February was a mix of
increases in shelter, food, medical services offset by decreases in the energy index.
The all items index rose 2.5 percent over the last 12 months, the largest 12-month
increase since the period ending October 2018, and the index for all items less food and
energy increased 2.3 percent.

                            THE STATE OF CALIFORNIA

After years of enacting legislation that protects or enhances their budget at the expense
of local government, the State of California’s revenues have recovered to a point where
the State has replenished its reserves and no longer looks to the local governments to
balance its budget. The State now faces new challenges, primarily addressing the
housing crisis.

On January 10, 2020, Governor Newsom presented his proposed state budget for fiscal
year 2020-2021 to the Legislature. Under the administration’s budget estimates and
proposals, General Fund revenues would total $151.6 billion in 2020-21 and spending
would total $153 billion. Under the Governor’s proposed budget, the state would end
2020-21 with $20.5 billion in total reserves, an increase of $1.7 billion from the 2019-20
enacted reserve level as required by the State Constitution but in smaller amounts than
previous years. The Legislative Analyst’s Office (LAO) estimates that the Governor has
a $6 billion surplus to allocate in the 2020-21 budget process. Of this amount, the
Governor allocates $2.6 billion to one-time spending, $1.6 billion to maintain the state’s

                                        Page 3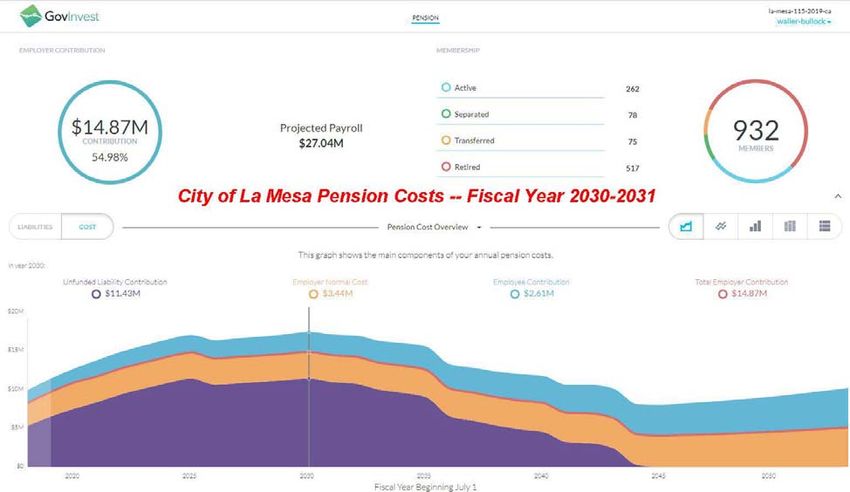
2019-2030 General Fund Financial Forecast
discretionary reserve, and $1.6 billion to ongoing spending. It is important to note that
there is no mention of takeaway of local revenues in the proposed budget. However,
staff continues to closely monitor the State’s budget situation and review any actions by
the legislature that might significantly impact La Mesa’s budget.
DISSOLUTION OF REDEVELOPMENT
In 2012, the State Department of Finance began the process of the dissolution of
Redevelopment. Since that time, the DOF has disallowed loan payments between the
Agency and the City beginning with ongoing debt service payments of approximately $1
million per year on pre-existing loans between the Agency and the General Fund. In
subsequent years, the State disallowed the ongoing debt service payments on the
former Police Station land site and payment of the portion of the Certificates of
Participation issued for the construction of the library and previously paid by
Redevelopment Agency. In 2015, as part of the requirements of the Dissolution Act, the
State Controller’s Office (SCO) completed their Asset Transfer Review and issued their
final report. In their report, the SCO found that $2.4 million transferred from the former
redevelopment agency to the City was unallowable and has ordered the return of those
funds. Appropriation of these funds was included in the forecast as a one-time
expenditure of funds in 2016-2017 and remains reserved in the event of payment.
In 2017, the State Department of Finance approved the reinstatement and repayment of
the former Redevelopment Agency’s deferred housing set-aside funds in the amount of
$3.1 million to the Housing Successor Agency and the debt service payments on the
former Police Station land site. While this is very positive news, repayment of the
deferred housing set-aside funds takes priority before the General Fund begins
receiving repayment of the debt service. In addition, the recent legislation requires that
20% of the loan repayments for the Police Station land site be transferred to the
Housing Successor Agency to be used for housing activities. Based on projections of
future RPTTF and estimated repayment amounts, the General Fund may begin
receiving repayment of the Police Station land as early as 2026-2027.
FUNDING OF THE CALPERS RETIREMENT SYSTEM
In recent years, the CalPERS Board has made significant changes in the retirement
systems that have had a significant impact on benefits and employer contributions.
These changes include:
Reduction of the Discount Rate from 7.75 percent to 7.5 percent (2012) and
again to 7.0 percent (2016)
Public Employees’ Pension Reform Act of 2013 (PEPRA)
Changes to the inflation factor and mortality assumptions (2014)
Page 4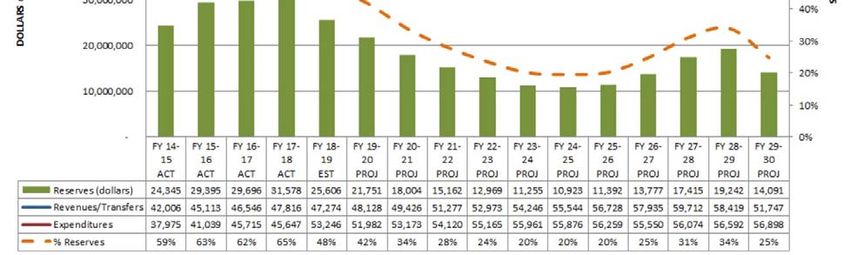
2019-2030 General Fund Financial Forecast
Conversion of unfunded liability contributions from percentage of current payroll
to fixed amount (2016)
Changes to the amortization and smoothing policies of unfunded liabilities (2013)
with an additional change in the unfunded liability amortization policy from 30 to
20 years (2018)
The cumulative effect of these changes was a rapid increase to the City’s required
contributions beginning in 2009 and continuing through today. To address these
increases, the City of La Mesa implemented various measures aimed at containing and
ultimately reducing the future retirement costs, including:
Implemented reduced Tier 2 retirement benefit plans (2011)
Established a Section 115 Retirement Trust Fund and made initial contribution of
$1.5 million (2016)
Authorized additional contributions to the Section 115 Retirement Trust Fund of
$600,000 (2017), $3,170,391 (2018), and $199,586 (2019)
Negotiated additional cost sharing agreements by City employees toward total
pension costs (phased in beginning 2018 through 2019)
Based on actuarial valuations, the payments towards the City’s unfunded liability is
expected to reach the highest point by fiscal year 2025-2026 and remain at these high
levels before beginning to decline in 2035-2036. Setting aside these Section 115 Trust
funds provides opportunities to help offset those costs with several years to determine
the best course of action.
FINANCIAL FORECAST BACKGROUND
The General Fund Financial Forecast is a tool that focuses attention on the longer-term
impacts of policy decisions on the City’s primary operating fund. The General Fund is
the City’s largest fund and provides funding for the majority of the day-to-day services of
the City to its citizens. The “forecast” is not intended to be a prediction of a particular
outcome but rather to be used as a model to test reasonable scenarios we might expect
in the coming years. These scenarios are intended to assist in setting realistic
expectations in matching revenues with programs and projects that will meet Council
objectives.
The Forecast Model is a spreadsheet-based model that projects the City’s current mix
of revenues and expenditures through the upcoming budget year and then ten years
into the future. The forecasting model uses a variety of information and techniques,
including historical trend analysis, projections from local and regional sources, and
various economic data. The Financial Forecast builds off the actual prior fiscal years’
revenues, expenditures, and ending reserves, projects the estimated 2019-2020
revenues, expenditures, and ending reserves, and incorporates known factors (such as
Page 5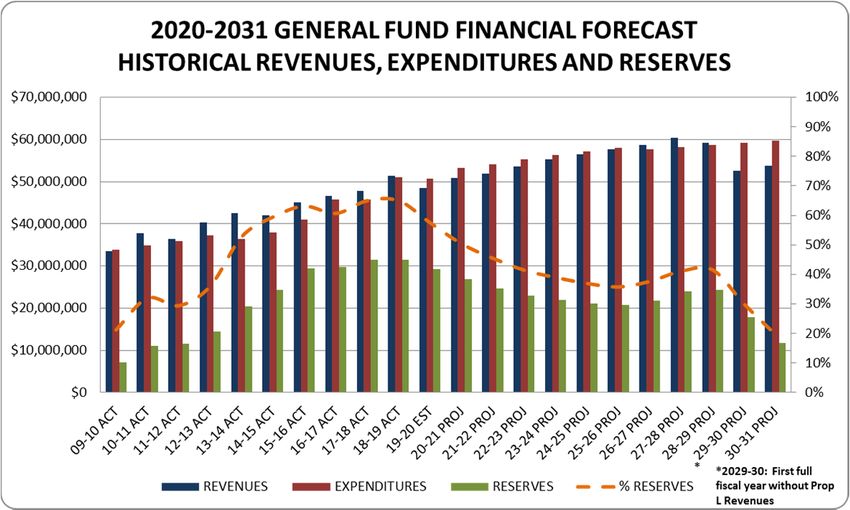
2019-2030 General Fund Financial Forecast

the increase in pension costs) into the 2020-2031 projections. Revenues, expenditures,
and ending reserves are then projected using the base assumptions as detailed below.

                    GENERAL FORECASTING ASSUMPTIONS

The Financial Forecast assumptions are based on the most current information
available. Revenue assumptions are generally moderate with particular attention given
to the top three revenues that represent approximately 75 percent of total revenues.
Expenditure assumptions are based on maintaining current service levels while
containing cost increases where possible. The Forecast assumes the continuation of
Council adopted fee cost recovery policies.

BASE REVENUE ASSUMPTIONS

                                       Page 6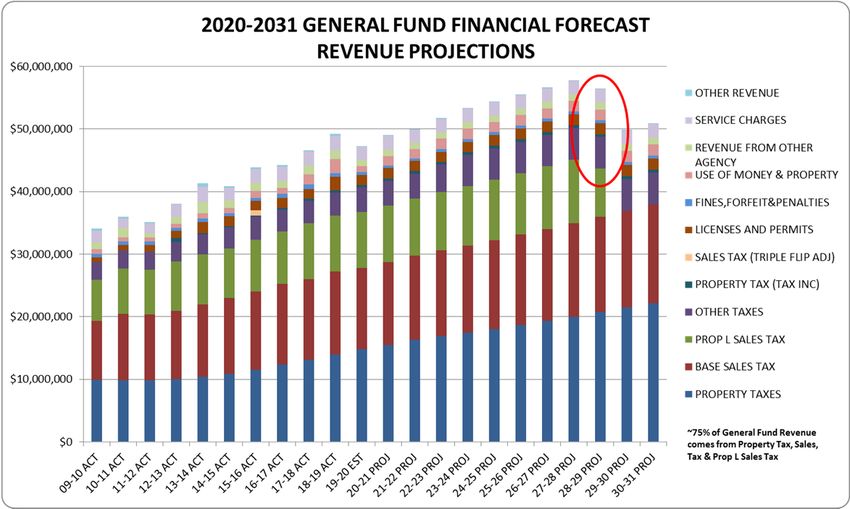
2019-2030 General Fund Financial Forecast

  PROPERTY TAX

  Property tax has traditionally been the General Fund’s most stable and consistent
  revenue and accounts for roughly 30 percent of the total General Fund revenues. In
  recent years, property assessed values have increased between 5.0 to 7.0 percent
  each year with the current 2019-2020 tax year increasing 7.5 percent, slightly above the
  countywide increase of 5.65 over the same tax year. This rise in assessed values has
  in turn helped property tax revenues received by the City increase between six and
  seven percent in recent years. Future increases in both assessed values and property
  tax revenues will be impacted by the regional housing shortage that is causing
  additional upward pressure in market prices in the entire San Diego County region and
  the state, increases in interest rates, and potential difficulties in the ability to afford
  housing in the future. Because of these factors, the forecast assumes a projected
  revenue growth of approximately 5.0 percent for 2021 through 2022 and then 3.5
  percent annually for the remaining forecast period.
16‐    17‐   18‐    19‐     20‐    21‐    22‐    23‐    24‐    25‐    26‐    27‐    28‐    29‐    30‐
17     18    19     20      21     22     23     24     25     26     27     28     29     30     31
ACT    ACT   ACT    EST     PROJ   PROJ   PROJ   PROJ   PROJ   PROJ   PROJ   PROJ   PROJ   PROJ   PROJ
7.1%   5.9   6.5%   6.0%    5.0%   5.0%   3.5%   3.5%   3.5%   3.5%   3.5%   3.5%   3.5%   3.5%   3.5%

  Market sales, particularly commercial sales in the industrial area of the City, will help
  support this increase in property tax revenue. In addition, as total property tax revenues
  increase, its proportionate share of the total General Fund revenues also increases.
  Beginning in Fiscal Year 2019-2020 and continuing throughout the forecast period,

                                             Page 7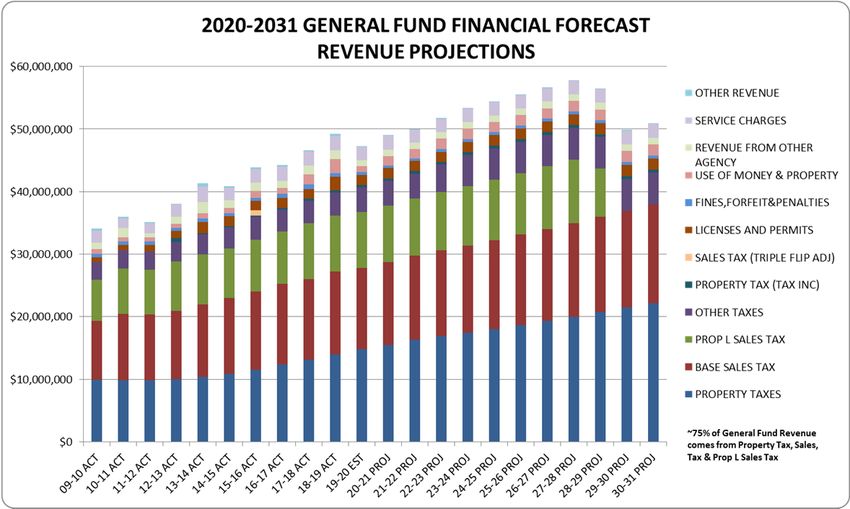
2019-2030 General Fund Financial Forecast

  property tax revenues replace base sales tax as the single biggest revenue source and
  account for more than 30 percent of total General Fund revenues.

  BASE SALES TAX

  At 25 percent of total General Fund revenues, the 1% Base Sales Tax is the second
  biggest General Fund revenue source behind property tax revenue. It is also the most
  volatile and economically sensitive revenue source. Further complicating the future of
  sales tax revenues is the rapidly changing nature of taxable transactions: not only is
  “what is purchased” changing, but “how it is purchased” is also changing. Consumers
  are spending more on non-taxable items such as services, social networking, and
  education and less on traditionally taxable items. Further contributing to the issue is that
  sales are increasingly shifting from traditional brick-and-mortar stores to online sales
  transactions and distributed via the County Pool. The 2018 South Dakota v. Wayfair
  decision further increased the tax revenues collected and allocated to local agencies
  through the County Pool. This has a potentially negative impact as the County Pool
  distributions are based on a pro rata share of all taxable sales.

  Because of these factors, the forecast assumes that revenues will be fairly flat through
  the current 2019-2020 fiscal year then increase approximately 1.8 percent annually for
  the remaining forecast period.
16‐    17‐    18‐    19‐    20‐    21‐    22‐      23‐    24‐    25‐    26‐    27‐    28‐    29‐    30‐
17     18     19     20     21     22     23       24     25     26     27     28     29     30     31
ACT    ACT    ACT    EST    PROJ   PROJ   PROJ     PROJ   PROJ   PROJ   PROJ   PROJ   PROJ   PROJ   PROJ
3.1%   0.7%   2.4%   0.5%   1.8%   1.8%   1.8%     1.8%   1.8%   1.8%   1.8%   1.8%   1.8%   1.8%   1.8%

                                                 Page 8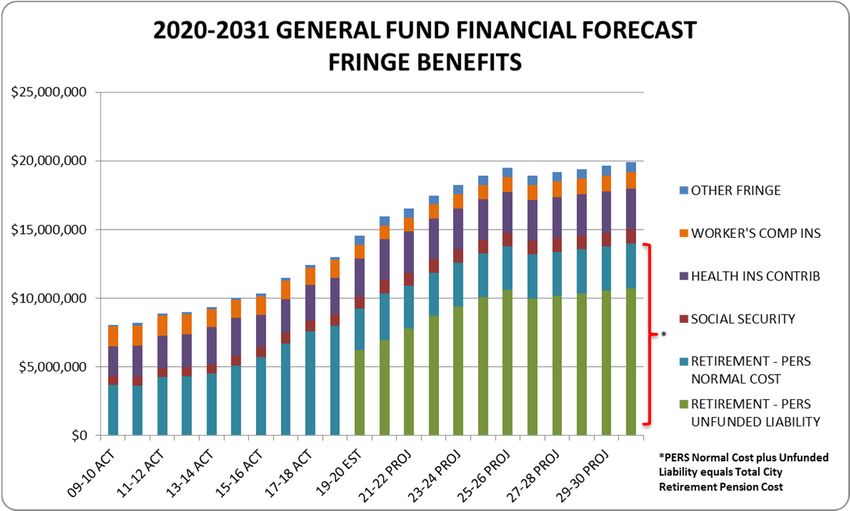
2019-2030 General Fund Financial Forecast

  PROPOSITION L SALES TAX

  In November 2008, the voters of La Mesa approved the temporary ¾ cent (0.75%)
  Proposition L transactions and use tax (commonly referred to as a sales tax) which
  became effective on April 1, 2009. The City began receiving payments from the State
  Board of Equalization in fourth quarter 2009.

  Since 2009, Prop L Sales Tax revenue growth has consistently followed the Base Sales
  Tax growth trends and received at 65 to 67 percent of the Base Sales Tax receipts.
  Prop L tax revenues now account for roughly 17 percent of the total General Fund
  revenues and contribute approximately $9 million to funding General Fund operations
  annually. By 2027-2028, the last full fiscal year of Prop L revenues under the current
  proposition, Prop L Revenues are estimated to exceed $10 million. Proposition L is set
  to sunset in 2028-2029, when the City will receive the remaining three quarters (roughly
  $7.7 million) of tax revenues and then absent any further action by the Council and
  voters, cease receiving any revenues. The forecast assumes the same factors as the
  Base Sales Tax through 2027-2028, before tapering off to zero in subsequent years.
16‐    17‐    18‐    19‐     20‐    21‐    22‐    23‐    24‐    25‐    26‐    27‐    28‐    29‐    30‐
17     18     19     20      21     22     23     24     25     26     27     28     29     30     31
ACT    ACT    ACT    EST     PROJ   PROJ   PROJ   PROJ   PROJ   PROJ   PROJ   PROJ   PROJ   PROJ   PROJ
1.3%   6.1%   0.3%   0.1%    0.9%   1.8%   1.8%   1.8%   1.8%   1.8%   1.8%   1.8%   N/A    N/A    N/A

                                             Page 9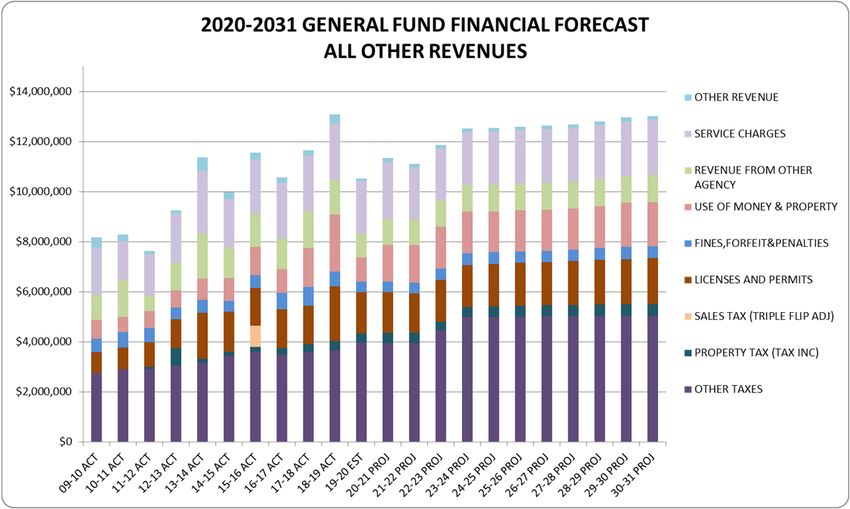
2019-2030 General Fund Financial Forecast

ALL OTHER REVENUES

All other revenues combined constitute roughly 25 percent of total General Fund
Revenues. The largest components of all other revenues include Other Taxes,
Licenses & Permits, and Service Charges. Other sources include Property Tax (Tax
Increment), Revenue from Other Governmental Agencies, and Use of Money &
Property

With the approval of the Cannabis Business Tax in November 2018, All Other Taxes
(also including Franchise, Property Transfer, and Transient Occupancy Tax), become a
more significant component of the total General Fund revenues. Beginning with fiscal
year 2020-2021, the total of All Other Taxes comprises roughly 9 percent of the total
General Fund revenues, up from 6 to 7 percent in previous forecasts. Other Taxes are
historically a stable source of revenue with most revenues increasing 1 to 2 percent
overall over the past five years. Transient Occupancy Tax (TOT) has grown
significantly since the end of the recession, while Gas & Electric and Refuse franchise
taxes remain fairly stable. Cable Television franchise taxes have increased slightly,
although this increase is due more to rate increases than an increase in subscribers.
Finally the forecast includes the approved Cannabis Business Tax and phases in these
revenues as more cannabis-related business begin operating and paying the tax. The
forecast estimated revenues of $375,000 in 2019-2020 then gradually increasing
through 23-24 before reaching the full $1.5 million per year in business tax. For
forecasting purposes, all other taxes are assumed to be fairly flat over the forecast
period.

                                      Page 10
2019-2030 General Fund Financial Forecast
Beginning in 2013, the General Fund began receiving property tax revenues in lieu of
Redevelopment Tax Increment. This General Fund revenue is the City’s share of tax
increment previously received by the Redevelopment Agency. The General Fund
received almost $690,000 in fiscal year 2012-2013, considerably higher than anticipated
at that time. In the subsequent years, however, the revenue was considerably less and
remained so through 2017. As the Successor Agency’s obligations get paid off and
property values rise, the city will see a gradual increase in its share of tax increment.
For the forecast period, the City anticipates receiving between $360,000 and $460,000
each year throughout the forecast period.
Licenses and Permits represent roughly 3 percent of total General Fund revenues and
are very sensitive to fluctuations in economic conditions. As the economic recovery
from the Great Recession picked up steam through 2013-2014, License and Permit
activity increased dramatically from the low of 2008-2009. Since then, activity has
returned to more normal levels as the economy remains strong. Despite a spike in
2018-2019 revenues, Licenses and Permits are assumed to remain fairly consistent
between $1.5 million and $1.8 million through 2031.
Revenue from other agencies comprises roughly 2 percent of total General Fund
revenues. During 2013-2014, the General Fund received several “one time” revenues
that contributed to the Reserve balances. These revenues include a Vehicle License
Fee refund from the State of California, and repayment of an advance of funds to the
former Redevelopment Agency to cover the AB1484 true up payment. Ongoing
revenues from other agencies include reimbursements for costs related to the Heartland
Page 112019-2030 General Fund Financial Forecast
Fire JPA consolidation and funding to cover expenses incurred as a result of public
safety realignment (AB109 R3 public safety realignment funds). The AB109 R3 public
safety realignment funds and reimbursement for costs related to the Heartland JPA are
now ongoing revenues and included in the future years forecast.
Service Charges represent roughly 4 percent of total General Fund revenues. Like
Licenses & Permits, Service Charges, including Community Service fees for recreation
classes and swimming pool admission, and Engineering and Zoning fees were
negatively impacted by the recession but have since recovered beginning in 2012.
Development related fees have increased significantly since 2012 and reflect both
current and anticipated development activity that is expected to occur over the next
several years. Recreation service fees are expected to recover to pre-2008 levels. For
forecasting purposes, service charges are assumed to remain fairly consistent
throughout the forecast period at between $2 million and $2.1 million.
Use of Money & Property includes revenue to be received from the long-term land use
lease at Briercrest Park. Beginning in 2020-2021, the City will receive ongoing
revenues of approximately $415,000 per year as ground rent and park maintenance
revenues to help offset the cost of maintaining Briercrest Park. These revenues will be
received annually throughout the 55-year agreement.
BASE EXPENDITURE ASSUMPTIONS
When developing the expenditure assumptions, as with the revenue assumptions,
historical data, projections from outside sources, and economic trends are all
considered. Salaries and fringe benefits comprise the majority of General Fund
expenditures at roughly 75 percent. Staffing levels are assumed to remain constant and
only merit increases are considered in the salary assumptions for future years beyond
fiscal year 2019-2020. Fringe benefits include retirement contributions for the normal
cost and unfunded liability, contributions to the Section 115 Pension Trust Fund, health
insurance contributions, workers’ compensation, social security, and other types of
benefits. Fringe benefits not related to pension are assumed to remain fairly flat with
increases tied to merit increases or inflation. Pension benefits are projected to increase
at a far greater rate than all other benefits and are discussed in a separate section
below. Materials, Services & Supplies, Personal Expenses, and Capital Equipment are
anticipated to increase slightly over 2019-2020 levels due to inflation.
Page 122019-2030 General Fund Financial Forecast
Included in the 2016-2017 actual amounts is the one-time appropriation for the
repayment of the State Controller’s Office Asset Transfer Review findings in the amount
of $2.4 million. This amount is a one-time expenditure and is reflected as a reserved
amount and not included in the Reserves as the City considers its options on payment
of the finding.
CALPERS RETIREMENT COSTS AND OTHER BENEFITS
As noted earlier, the fastest growing category of the General Fund’s expenditures
continues to be fringe benefits, specifically pension costs. Based on the most recent
CalPERS projections and the anticipated impacts of the recent changes including the
reduced discount rate and fixed unfunded liability contributions, pension costs are
projected to increase roughly 10 percent each year.
This increase began with the 2017-2018 fiscal year and continues through the forecast
period and beyond. These increases reflect the cumulative changes enacted by the
CalPERS Board in recent years to incorporate pension reform, change the smoothing
method for the unfunded liability, adopt revised actuarial assumptions, and most
recently reduce the discount rate and add a fixed amount contribution toward the
unfunded liability. The future projections include estimated increases from the reduced
discount rate on the “normal cost” rate (increase of 1 to 2 percent) and the Unfunded
Liability fixed amount (12 percent each fiscal year through 2023, with additional
increases between 5 and 8 percent each year through 2026).
Page 132019-2030 General Fund Financial Forecast
Beginning in Fiscal Year 2015-2016, the Council approved the establishment of a
Section 115 Pension Trust Account and authorized an initial contribution of $1.5 million.
Additional one time contributions were authorized in 2016-2017 ($600,000) and most
recently 2018-2019 ($3 million). Ongoing contributions of approximately $250,000 to
$350,000 each fiscal year through 2031 are included in forecast. Council approved
these contributions with the expectation that they would be used to offset future
unfunded liability contributions beginning in 2025-2026 when the current increases are
expected to peak. The Section 115 Pension Trust Fund has a current balance of $6.8
million at January 31, 2020, and includes interest earnings of $1.1 million from inception
to date. Based on current projections, the Section 115 Pension Trust Fund will have
approximately $10 million by fiscal year 2025-2026, the time at which the pension
contributions are at their highest levels.
Also reflected as an offset to the City’s pension costs are negotiated cost-sharing
agreements with City employees. These cost sharing agreements were agreed upon by
the City and the employees in 2018 and contribute ongoing annual savings of just over
$300,000 in City pension costs.
City contributions to health insurance are the second largest segment of Fringe
Benefits. Historically, these costs would have been increasing due to the increase in
employee premium costs. Beginning in 2016, these costs reverted to a fixed cost as
part of the 2014-2016 MOU’s and any increases are negotiated as part of the
bargaining process. Reflected in the 2019-2020 amounts are negotiated increases to
the health insurance contribution that began in January 2019, with all subsequent years
remaining constant. Worker’s Compensation insurance rates are approximately $1
Page 142019-2030 General Fund Financial Forecast
million each year and assumed to increase 1 to 2 percent each year beginning 2021-
2022. Finally, the City’s contribution to its Other Post-employment Benefits is expected
to increase beginning 2018-2019 by approximately 2.5 percent through 2024. All other
fringe benefits are assumed to remain constant through the forecast period.
ALL OTHER NON-PERSONNEL OPERATING COSTS
Other non-personnel operating costs include personal expenses such as memberships,
training, conferences, and uniform/boot allowance as well as material, services, and
supplies needed to maintain the city. Most materials, services & supplies are assumed
to remain constant or increase slightly due to inflation. Consistent with prior years’
forecasts, exceptions to these assumptions are in Communications and Technology
Maintenance, Maintenance of Buildings & Grounds, Contributions to Other Agencies,
Equipment Replacement Expense, and all Utilities, including gas, electric and water.
Increases in maintenance of buildings and grounds are estimated to increase 2 percent
throughout the forecast period in order to maintain and replace as needed the City’s
public spaces. Communications and technology maintenance are anticipated to
increase 5 percent in 2020-2022 and 2 percent through the end of the forecast period in
order to maintain and operate the city’s increasing technologies. Increases in
Equipment Replacement Fund Expense are necessary to maintain the city’s
replacement of equipment, vehicles and technology. Increases in Utilities, specifically
Page 152019-2030 General Fund Financial Forecast
electric and water usage are assumed to increase 2½ percent through 2024 as the City
works to implement energy and water savings devices as outlined in the Climate Action
Plan.
INTER-FUND TRANSFERS TO/FROM THE GENERAL FUND
Inter-fund transfers are transactions between the General Fund and other City funds for
items such as support services provided by the General Fund, debt service payments,
and contributions to the Capital Improvement Fund.
Prior to 2012, the single biggest change to inter-fund transfers is the elimination of the
payments for principal and interest on notes that were transferred in to the General
Fund from the former Redevelopment Agency, resulting in a loss of roughly $1 million
annually to the General Fund. Since 2012, the remaining non-redevelopment related
inter-fund transfers to and from the General Fund are primarily for support services and
debt schedules. Transfers in for support services are projected to increase as
personnel costs increase. Transfers out for debt service payments are reduced as those
debts, namely capital equipment leases for the purchase of fire apparatus and
Certificates of Participation for the construction of the Post Office and Library, are paid
in full. The forecast assumes no new long term liabilities are incurred. A nominal
transfer of $62,500 per year from the General Fund to the City’s Capital Improvement
Parks Fund is included throughout the forecast period.
Page 162019-2030 General Fund Financial Forecast
GENERAL FUND RESERVES
General Fund reserve levels have improved considerably since the low point in 2008
when reserves fell to $3.8 million or 11 percent of expenditures. Since then, the City
has received proceeds from the sale of two City-owned properties, “one-time” revenues
from the Briercrest litigation, repayment of funds advanced to the Successor Agency for
enforceable obligations, repayment of Prop L Sales Tax revenues that were diverted to
the City of Filmore, repayment of the “Triple Flip” Sales Tax revenues from the State of
California, and improved property tax revenues and development-related permits and
fees. These increased revenues, combined with expenditure budget savings, have
resulted in ending reserves in excess of 50 percent beginning in Fiscal Year 2013-2014
through 2018-2019.
The 2019-2021 Biennial Budget Update adopted in June 2019 projected a budget deficit
of $3.5 million with estimated ending reserves at June 30, 2020 of $25.5 million or 49.2
percent. Subsequent to the adoption of the Biennial Budget, the beginning reserves at
July 1, 2019 were revised to reflect improved revenues and cost savings. The revised
ending reserves at June 30, 2020 are an estimated $28.1 million or 54.1 percent.
The 2020-2031 General Fund Forecast further revises the estimated ending reserves
for June 30, 2020 upward to $29.2 million or 57.7 percent, higher than the $21.8 million
projected for the 2019-2020 fiscal year.
Page 172019-2030 General Fund Financial Forecast
The prior year General Fund Forecast was the first that extended the forecast to ten
years and beyond the sunset of Proposition L. The prior forecast projected budget
deficits through 2024-2025 before increasing through 2028-2029 and through the final
year of Proposition L tax revenues. Beginning in 2029-2030 and after the sunset, total
revenues once again fall below total expenditures and reserves decline.
Page 182019-2030 General Fund Financial Forecast
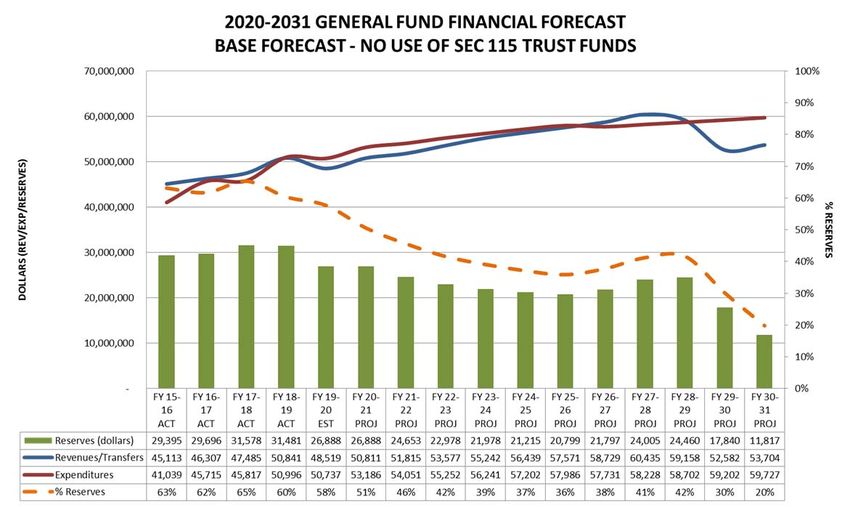
2030-2031 GENERAL FUND FORECAST
The current forecast extends the view to 2030-2031, two years beyond the sunset of
Proposition L. Based on revenue and expenditure projections, expenditures will exceed
revenues in each fiscal year through 2025-2026 requiring the use of reserves to
“balance the budget”. Beginning 2026-2027 this trend reverses with revenues beginning
to exceed expenditures and reserves beginning to increase through 2028-2029.
However, this all changes in 2029-2030 with the sunset of Proposition L and the
elimination of more than $10 million annually in General Fund Revenues.
CHART A: BASE FORECAST WITH NO USE OF SEC 115 TRUST FUNDS
Page 192019-2030 General Fund Financial Forecast
The previous scenario does not include the use of the Section 115 Pension Trust Fund
monies to offset future pension increases. As a comparison, the City’s retirement costs
were offset with Trust Funds in the amount of $1 million annually between fiscal years
2025-2026 through 2030-2031, a total of $6 million over the six years.
CHART B: BASE FORECAST WITH $1 MILLION SECTION 115 TRUST FUNDS
The Council’s current reserve policies are to establish a “Rainy Day Reserve” of 15
percent of budgeted expenditures and a “Cash Flow Reserve” of 25 percent of
budgeted expenditures.
Page 202019-2030 General Fund Financial Forecast
STRESS TEST – POTENTIAL RECESSIONARY SALES TAX
REVENUES
The current forecast projects conservative increases in both sales and Proposition L
transaction taxes. Both of these revenue sources are highly sensitive to downturns in
the economy. If sales tax and Proposition L tax revenues were to decline by 1/2% over
the next two fiscal years followed by several years of flat growth, the impact to reserves
would be severe.
CHART C: DECLINING/FLAT SALES TAX REVENUES
Revised sales tax revenue factors:
16‐ 17‐ 18‐ 19‐ 20‐ 21‐ 22‐ 23‐ 24‐ 25‐ 26‐ 27‐ 28‐ 29‐ 30‐
17 18 19 20 21 22 23 24 25 26 27 28 29 30 31
ACT ACT ACT EST PROJ PROJ PROJ PROJ PROJ PROJ PROJ PROJ PROJ PROJ PROJ
3.1% 0.7% 2.4% 0.5% 1.8% 1.8% 1.8% 1.8% 1.8% 1.8% 1.8% 1.8% 1.8% 1.8% 1.8%
REVISED SALES TAX REVENUE FACTORS
3.1% 0.7% 2.4% 0.5% ‐.5% ‐.5% 0.0% 0.5% 0.5% 0.5% 1.8% 1.8% 1.8% 1.8% 1.8%
Page 21You can also read