White-labels, brands and trust: How mutual fund labels affect retirement portfolios
←
→
Page content transcription
If your browser does not render page correctly, please read the page content below
Trends and Issues
June 2019

White-labels, brands and trust: How mutual
fund labels affect retirement portfolios

                                      Introduction
Julie Agnew,
                                      Finance theory assumes that investors maximize risk-adjusted returns when choosing
William and Mary,
                                      portfolios. In reality, some people are also influenced by irrelevant factors such as
TIAA Institute Fellow
                                      cosmetic changes to investment fund names. Retirement plan menus have been
Angela Hung,                          changing as sponsors adopt new generic, or “white-label,” funds. This study explores
RAND Center for                       how plan participants react to white-label and branded investment options, and,
Financial and Economic
                                      specifically, how brand trust alters participants’ allocations to them. In addition, the
Decision Making
                                      study examines the impact of brand trust on expected returns and risk perceptions.
Nicole Montgomery,                    The findings have important implications for both fund providers and plan sponsors.
University of Virginia
Susan Thorp,                          What are white-label funds?
University of Sydney
Business School                       The popularity of white-label funds in retirement plans motivated this research. In
                                      2014, it was estimated that 25% of retirement plans offered white-label fund options
                                      (Hewitt, 2014).

                                      White-label funds are constructed in a variety of ways. They can consist of only one
                                      underlying mutual fund or a complex combination of different asset types including
                                      collective investment trusts (CITs), separate accounts, mutual funds and recordkeeping
                                      solutions. Importantly, a white-label fund may have several branded funds underlying it.
                                      For example, a white-label large cap equity fund could include multiple large cap mutual
                                      funds managed by more than one firm.

Any opinions expressed herein are those of the authors, and do not necessarily represent the views of TIAA, the TIAA Institute or any other
organization with which the authors are affiliated.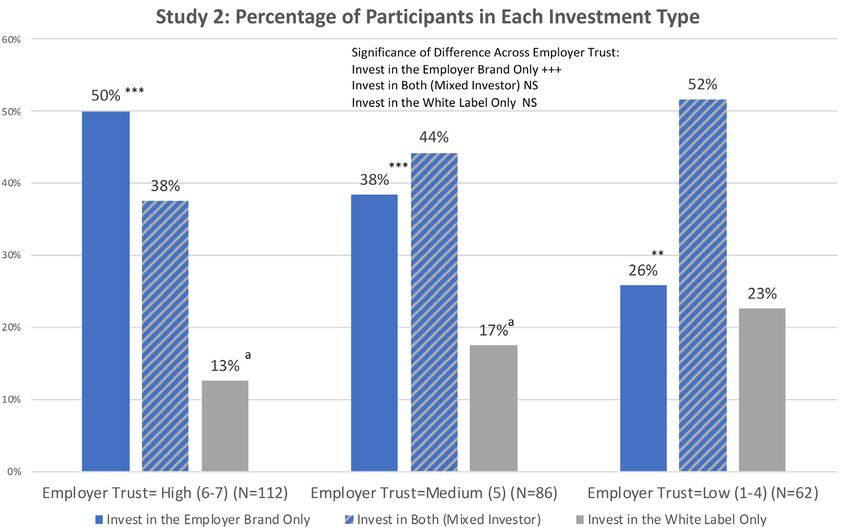
Plan sponsors find white-label funds attractive for a              Plan sponsor liability: Plan sponsors are liable for the
variety of reasons. Bare, Kloepfer, Lucas and Veneruso             investment decisions related to the white-label fund
(2017) highlight why these funds are attracting attention          construction. As choosing managers and setting portfolio
from plans. Some of the reasons they discuss include:              allocations are fiduciary decisions, plan sponsors must
                                                                   make sure to carefully document the fiduciary processes
Flexibility in design: As mentioned earlier, plan sponsors         they employ to construct the funds. Plan sponsors may
can combine a variety of fund types into an option that is         need to seek additional help from the outside or hire
tailored to the plan’s participants. They also can include         additional staff to ensure that they have established
different investment strategies, such as active and                sufficient fiduciary protections.
passive management, into one fund.
                                                                   Additional operational requirements: On top of designing
Scalable capacity: Often, large retirement plans face              and implementing the white-label funds, plan sponsors
issues with the size constraints of active fund managers.          must also continually monitor them. Depending on how
As a result, a large retirement plan may be forced to offer        the funds are made, the sponsors may need to pay
several very similar funds in its stand-alone menu. Plan           their plan’s recordkeeper or trust/custodian for add-
sponsors are concerned that the large size of the menu             on services. The operational items may also require
and similarity of some options could lead to participant           additional resources to carry out.
confusion. By including all the funds under one white-
label option, plan sponsors can simplify their offerings           Need for participant education and customized
and avoid the choice overload problem.                             communications: These funds generate a need
                                                                   for participant education, as well as customized
Cost control: Some funds are too expensive to include              communications. Both can be expensive and time
as a stand-alone option in a retirement plan investment            consuming to implement. Communication can include
menu, but white-label funds provide plan sponsors the              disseminating customized fund fact sheets that report
opportunity to include them under a white-label fund in            fund performance for the white-label options and
a cost-conscious way. By combining the expensive funds             information about the funds underlying those same
with lower-fee funds, participants investing in the white-         options.
label fund can benefit from the added diversification but
not suffer from outsized fees.                                     Retirement plans can include white-label funds in
                                                                   their menus in a variety of ways. They can be the only
Relative simplicity of removing funds: Removing a brand            offerings in the investment menu or offered alongside
name fund from a stand-alone investment menu can be                branded options. In addition, plans can use the
difficult if participants are connected to the brand.              employer’s name in the white-label name. This is, in
                                                                   effect, branding the fund to the employer.
This is not the case for white-label funds where
participants typically do not know the underlying                  Plan menus and fund names:
composition of their white-label option. As a result, if a
                                                                   Why might they matter?
portfolio manager leaves or if performance lags in one
of the underlying funds, plan sponsors can react quickly           Past research shows that investors can be influenced
to remove the branded fund and replace it with another,            by irrelevant factors when making asset allocation
often with the participant unaware of the change.                  decisions. For example, research using administrative
                                                                   data from retirement plans shows that participants
Bare, et. al. (2017) also highlight some drawbacks                 sometimes follow naïve diversification strategies that
related to white-label funds that are summarized here:             are affected by the size of the investment menu (Agnew,
                                                                   2006; Huberman and Jiang, 2006; Benartzi and Thaler,

		                                      White-labels, brands and trust: How mutual fund labels affect retirement portfolios | June 2019   2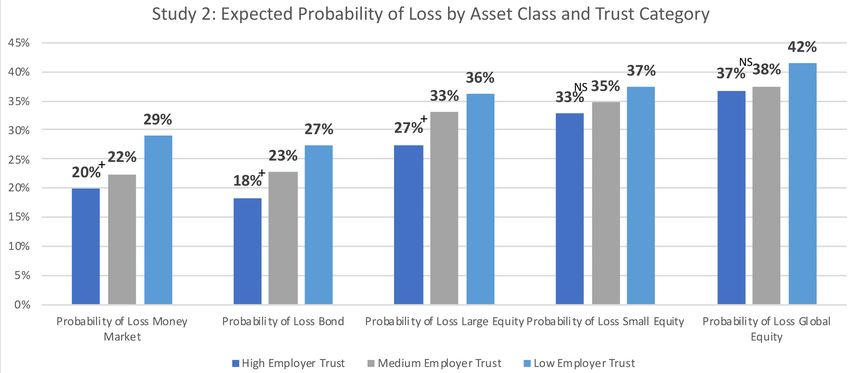
2001). Other investors tilt their portfolios toward certain         (poorly-) trusted branded investment options. Study two
asset classes because funds within that class are more              compared white-label investment options with investment
prevalent in the investment menus (Brown, Liang and                 options labelled with an employer’s name.
Weisbenner, 2007; Tang, Mitchell, Mottola and Utkus,
2010).                                                              In both studies, we provided participants with
                                                                    descriptions of different fund types and explained the
Fund names can also influence investors. Cooper, Gulen              naming convention before they made their allocations.
and Rau (2005) find that funds that make cosmetic                   In study one, participants were told that funds could
changes to their name by adding a popular investment                be managed by one or more portfolio managers. If a
style to their name attract significant inflows even when           professional investment company name preceded the
the fund does not follow the style. In addition, Green              fund name, then that company managed the fund. If
and Jame (2013) find that fluent fund names, which are              “White-label” preceded the fund name, then it was a
typically short and easy to pronounce, attract a broader            fund put together for the employer’s retirement plan and
group of investors, while other researchers find that               given a generic name. Participants were advised that one
investors are attracted to investments that are familiar            or more mutual funds could be held within that fund.
or that they feel loyal to the company, such as local
companies and company stock (Agnew, 2006; Benartzi,                 For study two, these instructions were slightly modified.
2001; Cohen, 2009; Huberman, 2001). The name of the                 In study two, participants were provided a menu with
fund’s investment manager may also draw flows. Sialm                employer-branded white-label funds and generic white-
and Thalm (2015) find that investment management                    label funds. Participants were given almost identical
companies’ past stock performances are related to                   descriptions of the two types of funds: namely that the
inflows to their specific funds even though the individual          funds were put together for their employers’ retirement
fund performance may be unrelated to the company’s                  plan and could include one or more mutual funds. The
overall performance. This spillover effect from the                 main difference was the naming convention. Like the
management company’s brand to the funds is found only               previous study, funds were named based on their asset
when individual funds are labeled with the name of the              class. However, in study two, that name was either
management company.                                                 preceeded by the employer’s name or preceded by the
                                                                    generic term “white-label.”
Taken together, this research motivates our study by
suggesting that menu shifts induced by the introduction             In both studies, we asked participants to imagine that
of white-label funds or relabeling of fund names could              their employer had started a new retirement plan and
affect the allocations of individuals for a variety of              that they needed to allocate a hypothetical retirement
reasons. In addition, the inclusion of an employer’s name           account across a variety of assets. The funds that
in the white-label fund’s name could also affect inflows            participants could choose from depended on which study
depending on the employee’s relationship with the firm.             the participant was randomly enrolled in. In all cases, the
                                                                    menu included two Money Market funds, two U.S Bond
Research design and data                                            Index funds, two U.S. Large Cap Index funds, two U.S.
                                                                    Small Cap Index funds, and two non-U.S. Global Index
Informed by two focus groups facilitated by Distillery Inc.,        funds. Within each asset class, one fund was a branded
we designed and fielded two online experiments engaging             fund and the other was a white label. To incentivize this
940 currently employed retirement plan participants from            exercise, we told participants that two people would
the University of Southern California’s Understanding               be randomly selected to earn a bonus based on their
America Study panel. Participants made incentivized                 allocations and invited them to click a link to a more
investment allocations and predicted investment returns             detailed description of the bonus calculation.
using distribution builders. Study one compared white-
label investment options with otherwise equivalent highly-

		                                       White-labels, brands and trust: How mutual fund labels affect retirement portfolios | June 2019   3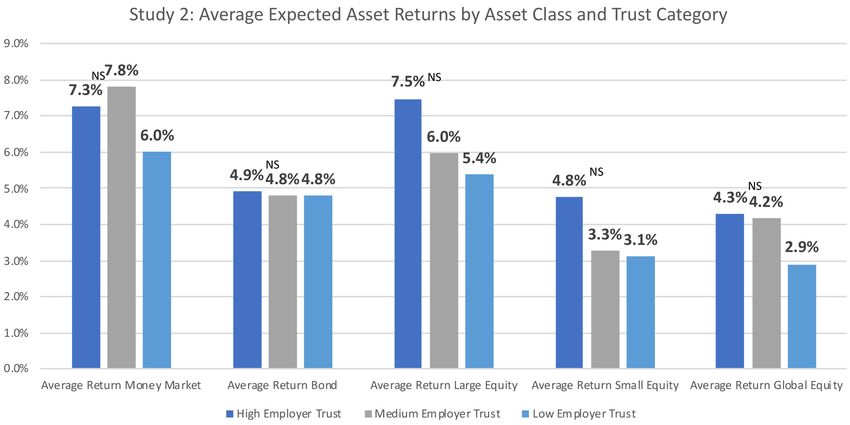
The allocation forms closely resembled retirement plan degree to which the participant trusts several different
fund selection forms. Importantly, participants were items. Using a seven point scale where 1 is “I do not
instructed to assume that investment fees for all the trust at all” and 7 is “I trust completely,” we inquire
funds were waived. As the fees were all zero and the about trust in the stock market, banks, insurance
investments were all index funds, participants should not companies, stock brokers, investment advisers, their
have had a preference between the branded and white- employer, their employer’s retirement plan, and people
label funds within each investment category. in general.
Following the allocation task, participants’ expectations Study one menu and results
of each branded fund’s risk and return were gathered
using a graphical interface called a distribution builder. In study one, we placed participants randomly in one of
As portfolio theory suggests expected returns and risk two treatments. The menu for participants in Treatment
should drive allocation decisions, these estimates should 1 included a highly trusted brand option for each asset
be informative. For each fund, we told investors they had class and a white-label option for each asset class. The
$100,000 to invest in that fund for one year. We then menu for participants in Treatment 2 included a poorly
asked what the investment would be worth in one year. trusted brand option for each asset class and a white-
Participants placed balls in different bins to show how label option for each asset class. We selected the high-
likely they thought different outcomes could be. From trust brand and low-trust brand from a list of six large
participant responses, we calculated expected returns investment company brands during a pretest.
and risk. Participants were not directly asked these
statistics, as research demonstrates that more accurate The results from the analysis were quite striking. First,
responses are obtained through graphical methods like based on their investment allocation decisions, investors
this (Goldstein and Rothschild, 2014). can be divided into three investment types: those that
invest their entire account to the brand option (brand
The survey ended with several questions designed to only), those that invest in the brand options and the
explore participants’ risk tolerance levels, personal white-label options (mixed), and those that invest only
assessment of their own investment knowledge, and in the white-label option (white-label only).
engagement with investment picking. We also ask the
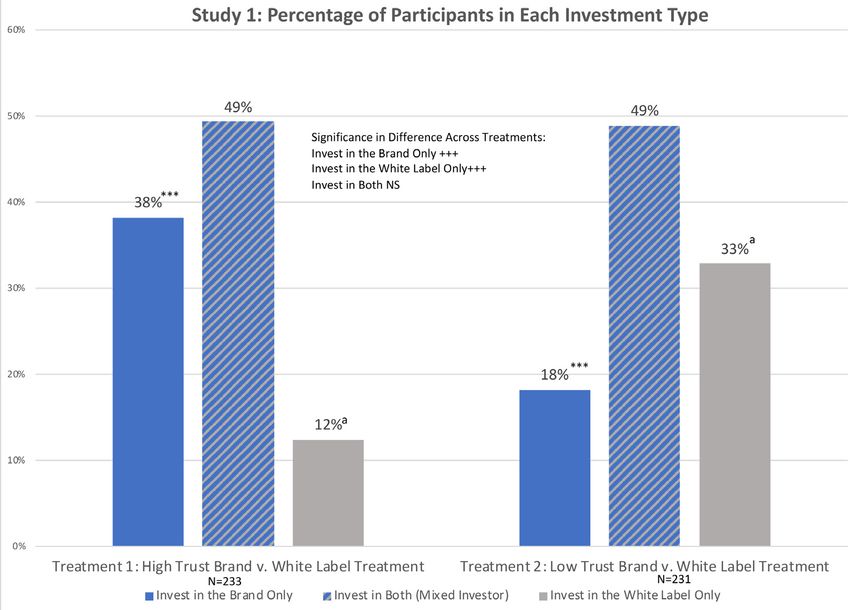
White-labels, brands and trust: How mutual fund labels affect retirement portfolios | June 2019 4Figure 1. Investor types by treatment (study one) Notes: Stars above the brand-only solid blue bars report the significance of within-treatment tests of the differences between the percentage of participants in each investor type. NS Not Significant, *** Significant at the 1% level, ** Significant at the 5% level, * Significant at the 10% level. Letters above the white label-only gray bars report the significance of within-treatment tests of the differences between the percentage of brand- only investors and the percentage of white label-only investors. NS Not Significant, “a” Significant at the 1% level, “b” Significant at the 5% level, “c” Significant at the 10% level. The text box overlaid on the table reports the significance of differences across treatments related to investor types (brand only v. brand only; white label v. white label, mixed v. mixed): NS Not Significant, +++Significant at the 1% level, ++Significant at the 5% level, +Significant at the 10% level. Figure 1 above presents the percentage of participants put everything in the white-label option. In contrast, only that fall into the three investor categories. If brand 18% invest everything in the low-trust brand relative to trust matters, we should observe that, relative to white- the 33% that put everything in the white-label option. label fund investments, more is invested in funds that The remaining 50% of participants in each of these are highly trusted and relatively less is invested in the treatments–high trust and low trust–are mixed investors. low-trust brands. The results are consistent with these Comparing across both treatments, the difference predictions. Within the treatments, the differences in the between total brand allocators is also significant. We find percentage of investors invested only in the brand option a difference of 38% (high trust) versus 18% (low trust) or only in the white-label option are significantly different. when comparing the brand-only investors. Regression For the high-trust treatment, 38% of the participants analysis controlling for demographics, financial literacy invest everything in the high-trust brand versus 12% who and brand measures, confirms this finding. White-labels, brands and trust: How mutual fund labels affect retirement portfolios | June 2019 5
These findings are reinforced when looking closer at the                     treatment is lower than those to the high-trust brand
average asset allocations to the brand and white-label                       (36% to white label versus 64% to high trust), but this
funds. Figure 2 below shows that the average allocation                      pattern reverses in the low-trust treatment (58% to white
to all branded funds is 64% in the high-trust treatment                      label versus 42% to low trust), and all the differences are
compared to 42% in the low-trust treatment. In addition,                     significant.
the average allocation to white-label funds in the first

 Figure 2. Comparison of allocations between brand and white-label funds (study one)

 Notes:
 Stars above the branded fund solid blue bars report the significance of within-treatment tests of the differences between the mean allocations to
 branded funds and white-label funds. NS Not Significant, ***Significant at the 1% level, **Significant at the 5% level, *Significant at the 10% level.
 The text box overlaid on the table reports the significance of differences in mean allocations across treatments comparing brand v. brand and white
 label v. white label. NS Not Significant, +++Significant at the 1% level, ++Significant at the 5% level, +Significant at the 10% level.

Drilling down to the individual fund level in Table 1, the                   money market fund. Comparing across both treatments
pattern observed in Figure 3 remains for each asset                          in the last two columns of the table, the average
class. In the high-trust treatment, the high-trust brand                     difference in allocations between the high-trust brand
garners higher allocations than the white label for every                    and the low-trust brand are also significant, with the high-
asset class (see first two data columns in the table). The                   trust brand always achieving larger allocations. These
differences within asset class are significant. For the                      findings are confirmed by regression estimations of the
low-trust treatment, allocations to the white-label funds                    fraction invested to the brand in total and by fund.
are significantly higher in every asset class except for the

		                                               White-labels, brands and trust: How mutual fund labels affect retirement portfolios | June 2019     6
Table 1. A closer look at asset allocation to individual funds in study one
                                                                                                                                     Across Treatment
                                             Mean Allocations to Each Fund & Within-Treatment Comparisons                              Comparisons
                                     High Trust Treatment (N=233)                         Low Trust Treatment (N=231)

                                                                     Total:                                              Total:   High Trust    White-
                                                    High Trust       White-                              Low Trust       White-    Brand v.    Label v.
                        High Trust       White-     v. White-       Label &   Low Trust       White-     v. White-      Label &   Low Trust     White-
    Fund Allocation       Brand          Label        Label          Brand     Brand          Label        Label         Brand      Brand       Label
    Money Market           17%            10%            a           27%         12%           15%                       28%           b           a

    Bond                   10%              5%           a           14%          6%            8%           c           14%           a           a
    Large Equity           18%              9%           a           26%         11%           15%           a           26%           a           a

    Small Equity           10%              6%           a           16%          8%           10%           c           18%           b           a
    Global Equity           9%              6%           a           16%          5%            9%           a           14%           a           a

    Total Allocations      64%            36%            a                       42%           58%           a                         a           a

Note: “a” denotes significance (p
Figure 3. Predicted asset returns by treatment and asset class (study one) Notes: The pluses (+) above the high-trust fund solid blue bars report the significance of the across-treatment tests of the differences between the average expected asset returns to branded funds and white-label funds. NS Not Significant, +++Significant at the 1% level, ++Significant at the 5% level, + Significant at the 10% level. Figure 4. Expected losses by treatment and asset class (study one) Notes: The pluses (+) above the high-trust fund solid blue bars report the significance of the across-treatment tests of the differences between the expected probability of loss to branded funds and white-label funds. NS Not Significant, +++Significant at the 1% level, ++Significant at the 5% level, + Significant at the 10% level. White-labels, brands and trust: How mutual fund labels affect retirement portfolios | June 2019 8
Study two results                                                             The analysis runs parallel to study one. We once again
                                                                              show in Figure 5 below the percentage of participants
In study two, the menu for participants included what                         in each investment type. For those who have a high
we refer to as a “pure” white-label fund option (because                      level of trust in their employers, 50% of the group invest
the fund is not associated with any firm or company) and                      everything in the employer brand. This compares to 38%
white-label funds that include the employer’s name in                         in the medium employer-trust group and 26% in the low
the funds’ names. At the start of the survey, participants                    employer-trust group. For both high employer-trust and
provided the initials or nickname of their employer. The                      medium employer-trust participants, those percentages
survey was designed so the inputs from those answers                          are significantly greater than the percentage of white
were piped into the fund’s names as they proceeded                            label-only investors in the same trust category. In the low
through the experiment. Thus, each employer-named                             employer-trust category, there is no significant difference
fund was personalized to the participant. In addition,                        between the proportion of participants who allocate
participants in the survey rate the degree to which they                      everything to the white-label fund and the proportion who
trust their employer on a seven-point scale where 1 is “I do                  allocate everything to the employer fund. We also find
not trust at all” and 7 is “I trust completely.” We categorize                that the percentage of employer brand-only investors is
participants based on their responses into three groups:                      significantly different across employer trust levels (see
Employer Trust=High (6-7), Employer Trust=Medium (5),                         the overlaid text box for significance).
and Employer Trust=Low (1-4). The hypothesis tested is
that trust in the employer matters in much the same way
as brand trust mattered in the first study.

 Figure 5. Investor types by treatment (study two)

 Notes:
 Stars above the brand-only solid blue bars report the significance of within-trust category tests of the differences between the percentage of
 participants in each investor type. NS Not Significant, ***Significant at the 1% level, **Significant at the 5% level, *Significant at the 10% level.
 Letters above the white label-only gray bars report the significance of within-trust category tests of the differences between the percentage of
 brand-only investors and the percentage of white label-only investors. NS Not Significant, “a” Significant at the 1% level, “b” Significant at the 5%
 level, “c” Significant at the 10% level.
 The text box overlaid on the table reports the significance of differences across treatments related to investor types (brand only v. brand only; white
 label v. white label, mixed v. mixed): NS Not Significant, +++Significant at the 1% level, ++Significant at the 5% level, +Significant at the 10% level.

		                                                White-labels, brands and trust: How mutual fund labels affect retirement portfolios | June 2019        9
In Figure 6, we examine the mean total allocation to for both the high and medium employer-trust categories. the employer-branded fund by employer trust category. The difference in the low employer-trust category is not Consistent with the results above, the mean total significant. Across trust categories, the allocations to allocations fall as employer trust declines. In addition, employer-branded funds are significantly different. These within trust groups, the difference between the employer- findings are once again consistent with the previous branded fund and the pure white-label fund is significant study and our hypotheses. Figure 6. Comparison of allocations between brand and white-label funds (study two) Notes: Stars above the branded-fund solid blue bars report the significance of within-trust category tests of the differences between the mean allocations to branded funds and white-label funds. NS Not Significant, ***Significant at the 1% level, **Significant at the 5% level, *Significant at the 10% level. The text box overlaid on the table reports the significance of differences in mean allocations across treatments comparing brand v. brand and white label v. white label. NS Not Significant, +++Significant at the 1% level, ++Significant at the 5% level, +Significant at the 10% level. Table 2 reports the allocations to each individual asset direction in every case. However, no significant class fund. Within the high employer-trust category, the difference is found in the low-trust category. When difference between mean allocations to the employer- looking at the sum of the branded investments and brand funds and the white-label funds are significantly white-label investments per trust category (last row of different. For all asset classes, the highly trusted the table), we do find significant differences across trust employer fund receives higher mean allocations. For categories. However, these differences lose significance the participants in the medium employer-trust category, when drilling down to the asset class level. Additional the differences between funds are less strong but still research with a larger sample is needed to confirm or significant (except for global equity) and in the same refute these findings. White-labels, brands and trust: How mutual fund labels affect retirement portfolios | June 2019 10
Table 2. A closer look at asset allocation to individual funds in study two
                                                                                                                                         Across Trust
                                   Mean Allocations to Each Fund Within Trust Categories and Significance Tests
                                                                                                                                         Categories
                Employer Trust High (6-7) (N=112)       Employer Trust Medium (5) (N=86)        Employer Trust Low (1-4) (N=62)

                                          Total:                             Total:                                         Total:
                               Employer White-                    Employer White-                                Employer White-      Employer White-
                               Branded Label &                    Branded Label &                               Branded v. Label &   Branded v. Label v.
 Fund          Employer White- v. White- Employer Employer White- v. White- Employer         Employer    White-   White- Employer     Employer White-
 Allocation    Branded Label     Label   Branded Branded Label      Label   Branded          Branded     Label    Label    Branded    Branded    Label
 Money
                20%       6%       a        26%         16%       9%        c        25%       14%       12%                 26%
 Market

 Bond            9%       4%       a        13%         10%       5%        b        15%        9%        7%                 15%

 Large
                18%      10%       a        27%         18%      13%        c        31%       15%       13%                 27%
 Equity
 Small
                11%       6%       a        18%         10%       6%        b        17%        8%        9%                 17%         c
 Equity
 Global
                10%       5%       a        16%          7%       5%                 12%        9%        7%                 15%
 Equity
 Total
                69%      31%       a       100%         62%      38%        a       100%       53%       47%                100%         a         b
 Allocations

 Note: "a" denotes significance (p
Figure 7. Predicted asset returns by treatment and asset class (study two) Notes: The NS above the high employer-trust fund solid blue bars denotes that there is not a significant difference between the average expected asset returns to employer-branded funds and white-label funds within each asset class. As far as expected risk shown in Figure 8, the orderings money markets, bonds, and large equity. We do not find are reversed for the probability of loss measures, as a significant difference between small equity and global would be anticipated. In addition, we find the hypothesis equity across trust treatments. This again needs to be test that the average loss probabilities are similar across confirmed with a larger sample. the three trust groups is rejected at the 10% level for Figure 8. Expected losses by treatment and asset class (study one) Notes: The pluses (+) above the high employer-trust solid blue bars report the significance of the across-treatment tests of the differences between the expected probability of loss to employer-branded funds and white-label funds within each asset class. NS Not Significant, +++Significant at the 1% level, ++Significant at the 5% level, +Significant at the 10% level. White-labels, brands and trust: How mutual fund labels affect retirement portfolios | June 2019 12
Summary and implications                                           Employer trust affects asset allocations. In the
                                                                   second study, options showing the names of highly
This study explores how plan participants react to white-          trusted employers are more attractive to plan
label and branded options, and, specifically, how brand            participants than equivalent white-label options. It
trust alters participants’ allocations to them. Motivated          follows that plan sponsors could consider adding the
by research showing that people are often influenced by            names of trusted employers to white-label options if
irrelevant factors when making financial decisions, the            their goal is to increase fund flows to these options.
study investigates how the growing trend of adopting
white-label funds in retirement plan menus may affect              Perceptions of expected return and risk affected by
investment allocations.                                            brand trust. In both studies, we find evidence that
                                                                   participants expect higher risk-adjusted returns and
We find several interesting results with real world                lower risk from options that display the name of a
implications. They are:                                            highly trusted brand or highly trusted employer. While
                                                                   the effects in study two (employer brand) are not as
Brand trust affects asset allocations. In both studies,            consistent nor as strong as in study one, they suggest
brand trust plays a large role in asset allocations.               that brand trust may influence these expectations, and
Participants allocate significantly more to trusted brands         more research is needed to confirm or refute this finding.
when choosing between otherwise equivalent investment
options. Specifically, in study one, options showing highly        This study opens up many future avenues of research.
trusted brand names are more attractive than equivalent            Future work should test the findings using administrative
white-label options, and the reverse holds for poorly              data, as well as explore whether menus presenting
trusted brand names. It follows that highly trusted brands         branded funds in separate asset classes from one
could capitalize by displaying their names on investment           another can alter overall allocations across funds.
options while less-trusted brands could consider generic           Importantly, this paper identifies brand trust as another
labelling.                                                         factor plan sponsors should consider when constructing
                                                                   their fund menus.

		                                       White-labels, brands and trust: How mutual fund labels affect retirement portfolios | June 2019 13
References Agnew, Julie R (2006). “Do Behavioral Biases Vary Across Individuals? Evidence From Individual Level 401(k) Data.” Journal of Financial and Quantitative Analysis, 41(4), 939–61. Bare, Rod, Jay Kloepfer, Lori Lucas and James Veneruso (2017). “White-label Funds-A No-Nonsense Design Handbook.” The Journal of Retirement, 4(4), 107-120. Benartzi, Shlomo (2001). “Excessive Extrapolation and the Allocation Of 401(K) Accounts to Company Stock.” Journal of Finance, 56 (5), 1747–64. Benartzi, Shlomo, and Richard Thaler (2001). “Naive Diversification Strategies in Retirement Brown, Jeff R., Nellie Liang and Scott Weisbenner (2007). “Individual Account Investment Options And Portfolio Choice: Behavioral Lessons From 401(k) Plans.” Journal of Public Economics, 91(10), 1992-2013. Cohen, Lauren (2009). “Loyalty-Based Portfolio Choice.” Review of Financial Studies, 22(3), Cooper, Michael J., Huseyin Gulen, and P. Raghavendra Rau (2005). “Changing Names with Style: Mutual Fund Name Changes and their Effects on Fund Flows.” The Journal of Finance, Vol. LX (6), 2825-2858. Goldstein, Daniel G. and David Rothschild (2014). “Lay Understanding of Probability Distributions.” Judgment and Decision Making, 9(1), 1-14. Green, T. Clifton and Russell Jame (2013). “Company Name Fluency, Investor Recognition, and Firm Value.” Journal of Financial Economics, 109, 813-834. Hewitt (2014). “What’s in a Name: White-Label Funds in DC Plans,” Hewitt EnnisKnup white paper (https://www.aon. com/human-capital-consulting/retirement/investment-consulting/bin/pdfs/White_Label_Funds_in_DC_Plans.pdf ). Huberman, Gur (2001). “Familiarity Breeds Investment.” Review of Financial Studies, 14(3), 659–680. Huberman, Gur, and Wei Jiang (2006). “Offering Versus Choice in 401(k) plans: Equity Exposure and Number of Funds.” Journal of Finance, 61(2), 763–801. Sialm, Clemens and T. Mandy Tham (2015). “Spillover Effects in Mutual Fund Companies.” Management Science, 62(5), 1472-1486. Tang, Ning, Olivia S. Mitchell, Gary R. Mottola, and Stephen P. Utkus (2010). “The Efficiency of Sponsor and Participant Portfolio Choices in 401(k) Plans.” Journal of Public Economics, 94(11-12), 1073-1085. White-labels, brands and trust: How mutual fund labels affect retirement portfolios | June 2019 14
About the authors
Julie R. Agnew is the Richard C. Kraemer Term Professor of Business at the Raymond A. Mason School of Business
at William and Mary. Her research and consulting activities examine how behavioral factors and financial literacy
influence financial decisions made by individuals in retirement plans. Her research has been published in top
academic journals, including The American Economic Review, Management Science and the Journal of Financial and
Quantitative Analysis. She frequently presents her research at conferences around the world and has testified as an
invited expert witness to the Senate’s HELP Committee. She is a member of the Pension Research Council Advisory
Board of the Wharton School and a TIAA Institute Fellow. Dr. Agnew earned a B.A. degree from William and Mary in
Economics (High Honors) with a minor in Mathematics and a Ph.D. in Finance from Boston College.

Angela A. Hung (Ph.D., Social Science, California Institute of Technology) is Director of RAND’s Center for Financial
and Economic Decision Making and a Senior Economist at RAND. Dr. Hung has over 18 years of experience in survey,
focus group, interview and experiment design to study individual decision making. Her work focuses on how people
collect and use financial information and how successfully they match their financial decisions to their interests and
goals. Her work on financial decision making and retirement has been sponsored by agencies such as the Consumer
Financial Protection Bureau, the Social Security Administration, the Department of Labor, the Department of the
Treasury, the Department of Defense, the National Institute on Aging, and the World Bank.

Nicole Votolato Montgomery is an Associate Professor at the McIntire School of Commerce at University of
Virginia. Her research and consulting activities focus on consumer behavior. In particular, she studies and advises
organizations on issues related to social media, digital advertising, e-commerce and branding. Her work has appeared
in premiere academic journals, and has been featured in popular press outlets such as the Wall Street Journal,
USA Today, U.S. News and World Report, Wired, and BBC Radio. Dr. Montgomery earned a B.S. degree in Business
Administration, an M.A. in Marketing, and a Ph.D. in Marketing with a minor in Cognitive Psychology from The Ohio
State University.

Susan Thorp is Professor of Finance at the University of Sydney Business School. She researches consumer finance,
focusing on retirement savings. She uses theoretical, empirical and experimental techniques to test consumer
responses to advice, disclosures and choice architecture. Her research has been published in leading international
academic journals and is regularly cited in policy discussions. She is a member of the Steering Committee of the
Melbourne Mercer Global Pensions Index, an annually compiled internationally recognized index of pension system
quality and is a member of the Research Committee of the OECD/International Network on Financial Education.
Professor Thorp earned a B.Ec. (Hons.) degree at the University of Sydney and a Ph.D. in Economics from the
University of New South Wales.

		                                     White-labels, brands and trust: How mutual fund labels affect retirement portfolios | June 2019 15
You can also read