Measuring the Thermal Comfort and the Sound Level in Design Studio Classes in Architecture Engineering Colleges
←
→
Page content transcription
If your browser does not render page correctly, please read the page content below
Journal of Sustainable Development; Vol. 13, No. 4; 2020
                                                                                    ISSN 1913-9063 E-ISSN 1913-9071
                                                                Published by Canadian Center of Science and Education

        Measuring the Thermal Comfort and the Sound Level in Design
            Studio Classes in Architecture Engineering Colleges
          Dr. Hind Abdelmoneim Khogali1,2, Students Mohammad Altuwijr1, Wadhah Alshaikh1, Ibrahim1,
                    Almohaimeed-saleha Alrasheed1, Meznah Aloyuni1 & Alhanouf Almutiri1
1
    College of Architecture Engineering and Digital Design, Dar Al Uloom University, Saudi Arabia
2
    Prince Sultan University, Saudi Arabia
Correspondence: Dr. Hind Abdelmoneim Khogali, College of Architecture Engineering and Digital Design, Dar
Al Uloom University, Architecture Department, Saudi Arabia. E-mail: ahind@dau.edu.sa

Received: April 7, 2020          Accepted: May 14, 2020           Online Published: July 17, 2020
doi:10.5539/jsd.v13n4p35                          URL: https://doi.org/10.5539/jsd.v13n4p35

Abstract
Thermal comfort is one of the most important topics in the course Environmental Control, ARC404 assign to
Architecture program in the college of architecture Engineering and Digital Design, 6 students in this course will
share in the research, will distribute in three groups. This research is aiming to let the students learn and practice
how to measure the thermal comfort in-studio classes focusing on the temperature, the humidity, and the noise,
analysing and find solutions. The methodology of the research is based on using monitor devices; noise level
smart meter, smart temperature and humidity measurement meter with data analysis by using Excel computer
program as well as, distrusting a survey to know the user’s opinion. The college has three types of a studio class,
one facing the courtyard, with large glass window, the second at the middle of the corridor with high-level
window, the third one is far away from the courtyard without any window. The results compared by The United
Nation Environut Protection Agency (EPA) noise levels. The results show that the studio class CBC09 level of
sound exceed 60 dB which consider as noise. Also, the class CBC01 is the most comfortable class because of 25
C° temperature, 40% humidity and 55 DB the sound level is also exceed the limit by EPA. The conclusion of the
research paper will highlight some scientific solutions in walls, ceiling and floors for the studio classes to be
applied in the future.
Keywords: measuring thermal comfort, temperature control, humidity control, sound level control in studio
classes, scientific solutions
1. Introduction
The design studio halls in Architecture department are suffering from noise because the main walls are made
from glass plywood partitions, this cause problem of discomfort for the students and teachers during the lecture
because of sound transfer... Also, because of the glasses are in the basement this cause high humidity in winter
and high temperature in summer.
Although measuring the thermal comfort in design studio classes became significance in measuring the sound
and noise level, temperature and humidity in the class and find out scientific solutions. its significant for the
studio classes in DAU will provide more comfortable places for the students, and for the community, it will
attract more students if we improve the situation in the internal environment.
1.1 Objectives of the Research
1) To measure the thermal comfort in the design studio classes in Architecture Department.
2) To let the student share in scientific research in course Environmental control.
3) To encourage the students using the monitoring system such as, sound smart meter and temperature smart
thermometer
4) To encourage the students working in groups.
5) To learn the students the main steps of doing scientific research.
6) The research will be discussed in Prince Sultan Forum for students researches and this will let DAU students

                                                         35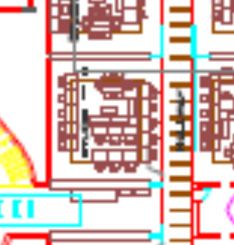
jsd.ccsenet.org                          Journal of Sustainable Development                      Vol. 13, No. 4; 2020

having the experience to share in conferences, discussing their results and have experience in presentation, and
meet with the professionals.
7) To use the main instruments used in the research for other faculty members for other researches in the future
and will establish scientific Lab for female students and faculty members.
a.   Research Problem
The main research question: Do the design studio classes comfortable for students and teachers?
To answer this question, the research will monitor the thermal comfort in-studio classes in the college of
architecture engineering and digital design, the researchers choose three classes in each side male/female
CBC01/ABC01, CBC07/ABC07 and CBC09/ABC09.
Because they have different designs, especially in window size, the amount of natural lighting
2. Literature Review
Abdelmoneim, H. (2020) discussed in the paper Benchmarking case study different global systems compare with
the local system SEBAM, one of the major sustainable eco buildings principles is studying the indoor
environmental quality focusing on the natural ventilation. Abdelmoneim, H. (2020) discussed the Greater
Khartoum local system Assessment Method to Evaluate sustainable- eco -buildings (SBAM) the system
discussed the indoor environmental quality in using the ecological building material, natural ventilation,
sustainable lighting.
Laaeddine, R., Wu, S. & Del, E. (2019) discussed in their paper the Occupancy, windows, opening and, closing,
shading control, equipment use, lighting control, Thermostat adjustment and give the Advantages and
Disadvantages. Mahmoud, S.(2019) discussed in her paper different sources of noise such as image noise,
speakers noise and mechanical system noise which are affect human health. Abdelmoneim, H., (2019) discussed
the six basic factors of thermal confort which are the humidity, the temperature, radiant temperature, air velocity,
metabolic heat, and human clothing this research is focusing on the humidity and temperature and the noise.
Alserf, M., (2019) stated in his book ‘Sustainable Houses in Saudi Arabia’, human health and well being are one
important principle of LEED.
ASHRAE(2019) discussed Standard 62.1-2019 and stated Humidity control requirements are now expressed as
dew point and not as relative humidity.
The united State Environmental Protection Agency EPA (2017) discussed the monitoring system that used in
schools and universities and stated to set the cschool bus and other vehicles inside the school in particular space
for airborne and noise. In addition the added establish and implement a regular schedule for maintaining unit
ventilators, replacing air filters, cleaning supply air diffusers, return registers and outside air intakes and
commission the HVAC system a minimum of once every 5 years.
Hassan, S., (2007) stated in his book ‘Lighting and Acoustics in Architecture’ most of the problems in the
modern design with open spaces are because of using lightweight structure without acoustical privacy especially
in open lecture halls and open spaces which cause spread of the noise between these lecture halls.
Jalil, A., Mjid, M. and Safa, Kh. (2012) published a paper about measuring the noise levels in college of
architecture engineering, civil epartment and stated that the sound level in the whole building reach 76.7which
exceed the limit of acepted sound level at universities.the EPA is recommended the sound level between 40-30
for universities.
(KAUST, 2013) stated in the report that energy-saving can be achieved by studying windows, solar screening,
glazing and building insulations. Hassan, S., (2002) stated in his book the heat transfer in buildings through walls,
heat exchange between the human and the surroundings, the internal thermal comfort can be controlled by using
the natural ventilation through the windows or by using the mechanical means. Mcmullan, R.(2002) discussed
the importance of natural ventilation in classes between 3-4 air changes per hour and added the moisture inside
the buildings caused by human activities like breathing and cooking. (Schiavon, S., 2010) Personalized
ventilation (PV) is an individually controlled air distribution system aimed at improving the quality of inhaled air
and the thermal comfort of each occupant the study reach to the PV may reduce the energy consumption up to 51%
following the natural ventilation. Wazeri, Y., (2010) concluded that the use of interior courtyards has been one of
the useful solutions that have been adopted in ancient Nubian Architecture, especially evident in the Tushki
village. The study proved that a square plan wind tower should not exceed a height of 6 metres in cases, wherein
it is used for a building of 3 metres height. Moreover, the study revealed that the use of rectangular shape is
better than the cubic shape; and its height does not exceed 1 metre over the water level, specifically when the

                                                        36
jsd.ccsenet.org Journal of Suustainable Devellopment Vol. 13, No. 4; 2020
water floww is 10 litres/m
min. (Araújo dee, 2018) measuured the therm mal comfort in space by 2x2 in air tempera ature,
relative huumidity, wind speed, and soolar radiation and computerr by the researrch results. Thhe surface/ volume
ratio is verry important inn conserving hheat transfer inn and out of a bbuilding. To conserve heat oor cold the building
must be ddesigned with a compact forrm in order too reduce the eefficiency of thhe building ass a heat excha anger.
Specificallly, buildings can
c have veryy different perrimeters and aarea ratios deppending on thheir plan form. For
example, aan important raation in eco-buuilding is the S Surface Volum me Ratio (SVR R), which refers to the ratio of
o the
exterior suurface to the enclosed voluume of the buuilding and itt should necesssarily be conntrolled. The main
objective iin calculating the SVR is too minimize thee area of expossed surfaces inn order to reduuce heat gain. This
can be achhieved throughh multi-story buuildings and byy raising the rooof height (Fajjal, 2002).
Alwakil, S Sh. (1989) diiscussed the bbuilding form m as one of tthe important solutions of passive soluttions,
particularly for the Midddle East, the researcher cooncurs that thee building form
m could consttitute a part of
o the
indoor envvironment or a part of the environmentall design proceess like other principles. Coorrespondingly y, the
factors of water, energyy, material, annd site presentt environmentaal, economic aand social aliggnment, while
e, the
outdoor ennvironment shoows environmeental and sociaal alignment.
Fanger, P.O., (1970) used heat balancce equations aand empirical studies in thee context of skin temperatu ure to
define the comfort paraameter, developped the Prediccted Mean Voote index (PMV V) model. Thhe standard the
ermal
comfort suurveys ask subbjects about thheir thermal sensation on a seven-point sscale from colld (-3) to hot (+3).
Corresponndingly, Fangeer’s equations are used to ccalculate the P Predicted Meaan Vote (PMV V) (Fanger, 1970).
(Jaramillo,, A. 2012) disccussed the sounnd level in classes should noot exceed 60 D
Db.
Noise leveels in schools
N
Noise level at proposed
p schoool façade 60 dB
B
Minimum distances bettween educational buildinggs and transpoortation noisee sources: It is considered best
practice too locate schoools 328 ft (1000 m) from anyy busy road oor railway linee; however, it is anticipated
d that
achieving these
that acousstics in the claassroom can immpact on studeent memory reetention and cooncentration leevels. The rese
earch
shows that the acoustic environment can alter perfformance in m mathematics, pproblem- solvinng, reading ab bility,
language sskills, and imppact on literacyy levels
Acoustic P
Panels
Figure 1.. A good absorrber, blow throough it under mmoderate presssure. Absorptioon effectivenesss is a function
n of
thickkness, fibre orientation, densiity, and porosiity (Ermann, M
M. 2005), copyyright @(Ermaann, M. 2005)
37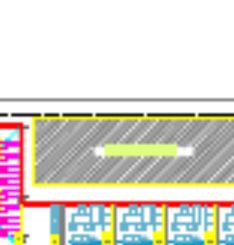
jsd.ccsenet.org Journal of Suustainable Devellopment Vol. 13, No. 4; 2020
Definition of the frequenncy
T
The Frequency is a study souund is produceed by the repeeated back andd forth movem ment of an objeect at
reegular intervaals. The time iinterval over w
which the mottion recurs is called the perriod (Jaramilllo, A.
2012)
O
Or
thhe rate at whiich something occurs over a particular peeriod of time oor in a given sample. (Long
g, M.
2014)
3. The Meethodology
3.1 Firstlyy: The Use of Sound
S Meter annd the Thermoometer
The methoodology of thee research is based on using monitor devicces; sound levvel smart meteer, temperature
e and
humidity mmeasurement smart meter with data anaalysis by usinng Excel com mputer program m. Its quantittative
research based on monitoring by smartt meter
Using thhe Sound levell meter(or SPL
L) is shows de
ecibel
values bby measure thhe environmenntal noise, disp
plays
measureed dB valuess in various forms. You can
experiennce tidy graphiic design with high frame by
y this
smart soound meter
Figurre 2. The soundd level meter, uused to measurre the sound leevel in the studdio class (SOU
UQ.com, 2020))
consumptiion; High stability & aaccuracy .Diisplay
temperaturre, humidity annd time simulttaneously; Me
emory
of MAX & MIN measuuring value; 12 hours / 24 hours
displayingg system seleectable; ℃ /°F unit selectable;
Clock & C
Calendar funcction (month aand date) Dessk-top
placing or Wall
Figure 3. T
The thermometer used in meeasuring the tem
mperature andd Humidity in S
Studio class (S
SOUQ.COM, 2020)
2
3.2 Seconddly: Distributioon Survey
Distributioon survey to thhe students in the studio classes to have thheir response tto the temperaature, humidity
y and
sound leveel.
38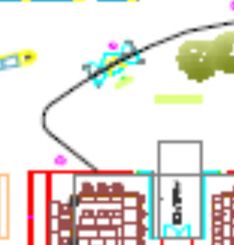
jsd.ccsenet.org                            Journal of Suustainable Devellopment                      Vol. 13, No. 4; 2020

                  Figure 4. The result off the survey:833 % they hear ddisturbance nooise in the classes

                                                           39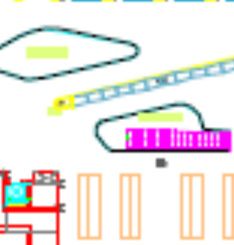
jsd.ccsenet.org Journal of Suustainable Devellopment Vol. 13, No. 4; 2020
C
CBC01
C
CBC07
CBC09
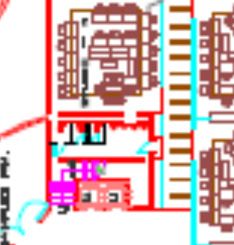
Figurre 5. The locattion of the casee study, Femalee section, Coppyright@DAU
40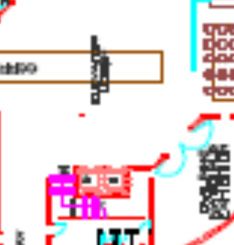
jsd.ccsenet.org                          Journal of Sustainable Development                      Vol. 13, No. 4; 2020

4. Findings

                         Internal and External Temperature
                                       CBC01
                  40
                  20
                   0
                        10‐Feb
                        11‐Feb
                        12‐Feb
                        13‐Feb
                        16‐Feb
                        17‐Feb
                        18‐Feb
                        19‐Feb
                        20‐Feb
                        23‐Feb
                        24‐Feb
                        25‐Feb
                        26‐Feb
                        27‐Feb
                        01‐Mar
                        02‐Mar
                        03‐Mar
                        04‐Mar
                              internal temperature                External temprature

            Figure 6. The average result of the internal 21 C°, The Average result of the External 18 C°

                                         The Humidity in CBC01
                  50
                  40
                  30
                  20
                  10
                   0

                             Figure 7. The Max Humidity 45%, Min Humidity is 15%

                                       The Sound Level in CBC01
                  100
                   80
                   60
                   40
                   20
                    0

                           Sound level Max          Sound level Average        Sound level Min

                          Figure 8. Max Sound Level 62 dB, Average 55 dB, Min 50 dB

                                                        41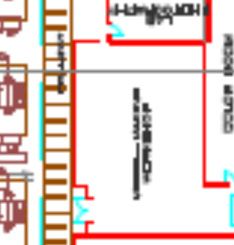
jsd.ccsenet.org Journal of Sustainable Development Vol. 13, No. 4; 2020
Internal and External Temperature‐CBC07
35
30
25
20
15
10
5
0
internal temperature External temprature
Figure 9. The average result of the internal 21 C°, The Average result of the External 20 C
The Humidity ‐Class CBC07
50
45
40
35
30
25
20
15
10
5
0
10‐Feb
11‐Feb
12‐Feb
13‐Feb
14‐Feb
15‐Feb
16‐Feb
17‐Feb
18‐Feb
19‐Feb
20‐Feb
21‐Feb
22‐Feb
23‐Feb
24‐Feb
25‐Feb
26‐Feb
27‐Feb
28‐Feb
29‐Feb
1‐Mar
2‐Mar
Figure 10. The Max Humidity 47 %, Min Humidity is 12%
The Sound Level in Class cbc07
100
80
60
40
20
0
10‐Feb
11‐Feb
12‐Feb
13‐Feb
14‐Feb
15‐Feb
16‐Feb
17‐Feb
18‐Feb
19‐Feb
20‐Feb
21‐Feb
22‐Feb
23‐Feb
24‐Feb
25‐Feb
26‐Feb
27‐Feb
28‐Feb
29‐Feb
1‐Mar
2‐Mar
3‐Mar
4‐Mar
Sound level Max Sound level Average Sound level Min
Figure 11. Max Sound Level, 62 Db. Average 58 dB, Min 50 dB
42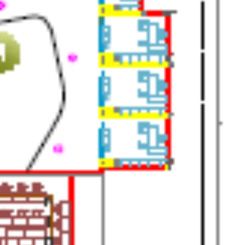
jsd.ccsenet.org                                Journal of Sustainable Development                     Vol. 13, No. 4; 2020

                                       Internal and External Temperature class CBC09
                  35
                  30
                  25
                  20
                  15
                  10
                  5
                  0

                                          internal temperature          External temprature

           Figure 12. The average result of the internal 21 C°, The Average result of the External 20 C°

                                            The Humidity in class CB09
                   50

                   40

                   30

                   20

                   10

                       0

                                  Figure 13. The Max Humidity 47 %. Min Humidity is 12 %

                                           Sound Levels IN vlass CBC09
                           100
                           80

                           60

                           40

                           20
                            0

                                   Sound level Max       Sound level Average        Sound level Min

                                 Figure 14. Max Sound Level 68 db. Average 60 dB, Min 63 dB

                                                                 43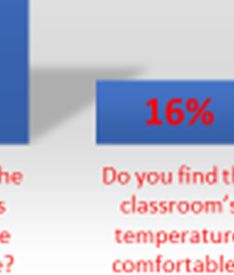
jsd.ccsenet.org                              Journal of Sustainable Development                           Vol. 13, No. 4; 2020

5. Discussion
The location is at the college of architecture engineering, architecture department. The measurements were done
every day ate midday in the three classrooms CBC01, CBC02 and CBC09 this time is the peak time for these
studio classes.
The results of sound level measured by sound meter (Figure 2) for class CBC01 is 55 dB which exceed the limit
of sound for classroom announced by The Environmental Agency (EPA ). In addition, the result of sound level
measured for studio class CBC07 is 58 dB which is also exceed the limit 35 dB announced by EPA. In addition
to that the measurements of sound level of class CBC09 is 60 dB, which is double 35 dB the limit announced by
EPA.
The below table 2 shows the higher measurement of sound level is record for studio classroom CG09
Which is 68 dB at 12.00 pm to 13.00 pm which is the peak time for students at their break time and this studio
classroom is facing the main hall. In addition, the lower measurement shows in Table 2 is measured for class
CBC01 which is 60 dB which still far a way from the limit 35 dB by EPA.
The research results show the percentage of humidity and temperature are normal specially there is HVAC
system in each class that the student could adjust the temperature in summer and winter.

Table 1. The sound level by United State Environmental Protection Agency (EPA)
The activity in the eternal spaces                                       The recommended Noise level (dB)
Seminar room                                                                                35-30
Faculty members room                                                                        40-35
Studio classes                                                                              30-35

Table 2. Shows the average results of the temperature and humidity and the sound level, (EPA, 2017)

   The measurements       CBC01      CBC07       CBC09     The Average   Conclusion

   Internal Temperature   21 C°      21 C°       21 C°     21 C°         Within the limit

   External Temperature   18 C°      20 C°       20 C°     19.3 C°       Within the limit

   Max Humidity           45 %       47%         47%       46.30 %       Within the limit

   Min Humidity           15 %       12%         12%       13.00 %       Within the limit

   Max Sound Level        62 dB      62 dB       68 dB     64.00 dB      CBC09 Exceed the Limit of Sound >35

   Average Sound Level    55 dB      58 dB       60 dB     57.66 dB      Class Cbc01 the sound level within the limit < 35

   Min Sound Level        50 dB      50 dB       63 dB     54.00 dB      Class Cbc01 the sound level within the limit < 35

6. Recommendations
-The research recommends using of insulation materials in the wall panel between the two classes
-In addition, the research recommends closing the opening high-level window between the two classes.
-As well as, the research recommends using of curtains for all the classes
-Change the doors into wooden door instead of glass materials.
-Using of solid walls portion’s instead of lightweight partitions.
-The research recommends regular maintenance of Heating Ventilating Air Conditioning System.
-The researcher agreed to use control system in heating and cooling the class to control the temperature and the
humidity in summer and winter.

                                                            44
jsd.ccsenet.org Journal of Sustainable Development Vol. 13, No. 4; 2020
-The researcher suggested to the false ceiling in 1m. depth for the HVAC system to avoid the vibration.
-The research recommends using carpet on the floor to minimize the noise.
-The research recommends using the monitoring system and measuring the sound level in 3D machine lab and in
the main hall.
Acknowledgement
The Researchers would like to Acknowledge Dar Al Uloom University, specially Deanship of Graduate students
and research for funding this research. Dean of CADD, Research Committee and Prince Sultan University for
giving this opportunity for DAU Students.
References
Abdelmoneim, H. (2019). Sustainable Eco Buildings Assessment Method to Evaluate Residential Buildings in
Greater Khartoum, PhD research, Faculty of Architecture, UOFK, Sudan. Scholar Press, Germany.
Abdelmoneim, H. (2020a). Benchmarking case study, Applying Sustainable Eco-Building Assessment Method
(SEBAM) in Greater Khartoum, comparing with global systems. Journal of Sustainable Development,
13(3). https://doi.org/10.5539/jsd.v13n3p33
Abdelmoneim, H. (2020b). Sustainable-Eco-Buildings Assessment Method (SEBAM) for The Evaluation of
Residential Buildings in Hot dry Climate. Journal of Sustainable Development, 13(3).
Al Serf, M. (2019). Sustainable Houses in Saudi Arabia, Opportunities and Challenges, Universal Publisher.
Alwakil, Sh. (1989). The Climate and The Hot Region Building Architecture, Book Word, Abdelkhalig Tharuat
Press, Egypt.
Araújo de, G. (2018). Relationship between thermal comfort indices an internal temperature of grazing lactating
Holstein Gyr cows in western Amazonia. Amazonica, 48(3), 191-196.
https://doi.org/10.1590/1809-4392201704301
ASHRAE. (2019). ANSI/ASHRAE Standard 62.2-2019, Ventilation and Acceptable Indoor Air Quality in
Residential Buildings, USA.
Badran, R. (2005). The Architecture of Rasem Badran. Thames & Hudson Press, UK.
Ermann, M. (2005). Architectural Acoustics Illustrated. WELLY Pres. Canada.
Fajal, K. (2002). Application on Environmental Design In Hot Desert Area (1st ed.). Cairo: Al Madina Library.
Fanger, P. O. (1970). Analysis and application in Environmental Engineering (1st ed.). USA/New York: Mac
Grew Hill Company.
Hassan, S. (2000). The Principles of Environmental Urban Science (1st ed.). Khartoum: Sudan University.
Hassan, S. (2007). The Lighting and Acoustic in Architecture. Kink Saud Press, Saudi Arabia.
Jalil, A., Mjid, M., & Safa, Kh. (2012). Study of Noise Level in the Building of Engineering college, civil
department. The Iraqui Journal for Mechanical and Material Engineering, 12(4).
Jaramillo, A. (2012). Architectural Acoustics. Routledge Press. UK.
KAUST. (2013). Evaluation of The Green Industry in Saudi Arabia and the GCC Region: Technologies, Market,
Assessment and Business Opportunities, Riyadh, KSA: King Abddulla University for Science and
Technology.
Laaeddine, R., Wu, S., & Del, E. (2019). A Review of Occupant’s Energy Behavior Data Collection Methods and
Techniques. Proceeding of ICITEE, Applied Science University, Bahrain.
Long, M. (2014). Architecture Acoustic. Book Aid Press, UK.
Mahmoud, S. (2019). Empirical Study in Image Denoising Using Total Variation Based On Color Space,
Proceeding of ICITEE, Applied Science University, Bahrain.
Mcmullan, R. (2002). Environmental Science in Building (5th ed.). Martine’s Press, UK.
Schiavon, S. (2010). Energy analysis of the personalized ventilation system in hot and humid climates. Energy
and Buildings, (42), 699–707. https://doi.org/10.1016/j.enbuild.2009.11.009
Souq.com, S. (2020, Feb. 15 Sunday). Sound meter. Retrieved from
https://saudi.souq.com/sa-en/sound-meter/s/?as=1
45jsd.ccsenet.org Journal of Sustainable Development Vol. 13, No. 4; 2020
Teresa, M. (2020). Outdoor Thermal and Acoustic Comfort in Autumn for Senior Citizens in Public Spaces in
Newcastle Upon Tyne, United Kingdom. Journal of Scientific and Technical Research, 24(1).
https://doi.org/10.26717/BJSTR.2020.24.004002
United State Environmental Agency (EPA). (2017). Sensible steps to Healtheir School Environment. P.10, USA.
Waziri, Y. (2010). Principle of Designing Natural Cooling Towers A Study Using Equations and Field
Measurements. Riyadh, KSA, Conference on Technology and Sustainability in the Built Environment, King
Saud University.
Copyrights
Copyright for this article is retained by the author(s), with first publication rights granted to the journal.
This is an open-access article distributed under the terms and conditions of the Creative Commons Attribution
license (http://creativecommons.org/licenses/by/4.0/).
46You can also read