Post-Session Fiscal Report - Dawn Iglesias, Chief Economist David Abbey, Director Presented to the Revenue Stabilization and Tax Policy Committee ...

Page created by Terrence Wallace
 
CONTINUE READING
Post-Session Fiscal Report - Dawn Iglesias, Chief Economist David Abbey, Director Presented to the Revenue Stabilization and Tax Policy Committee ...
Post-Session Fiscal Report
          Dawn Iglesias, Chief Economist
             David Abbey, Director

                  Presented to the
   Revenue Stabilization and Tax Policy Committee
                    June 9, 2021
Post-Session Fiscal Report - Dawn Iglesias, Chief Economist David Abbey, Director Presented to the Revenue Stabilization and Tax Policy Committee ...
Improved economic outlook and faster-than-expected
     recovery in oil prices led to upward revisions to the
       mid-session revenue forecast in February 2021.

   Upward revisions                   February 2021 Consensus
                                      Recurring Revenue Changes
                                                                                           Consensus General Fund
                                                                                         Recurring Revenue Estimates
    primarily in oil- and         (Change from December 2020 estimate, by
                                        Income Source, in millions)
                                                                                                         (in billions)
    gas-related revenues, as   $300

    well as income taxes       $275
                                             Rents and
                                                                                      $8.5
                               $250          Royalties
                                                                                                7.9                       7.9
                               $225             $90                                   $8.0
   “New Money” – FY22         $200                                   Rents and                                                  7.4
                                                                                                                                        7.5
                                                                                      $7.5
    recurring revenue less     $175
                                                                      Royalties
                                                                        $110                            7.0
                                                                                                              7.2
                                            Severance
    FY21 recurring             $150            $94                                    $7.0

    appropriations –           $125
                                                                                      $6.5
                               $100
    projected at $338.6         $75
                                              Income
                                               Taxes                Severance         $6.0
    million, or 4.7 percent     $50
                                                $50                    $98

                                               GRT                                    $5.5
                                $25            $56

   FY20 ending reserve          $0                                     GRT
                                                                        $(10)
                                                                                      $5.0
                               -$25
    balance of $2.5 billion,                   FY21                     FY22          $4.5
    or 35.4 percent                   GRT                     Income Taxes
                                                                                      $4.0
                                      Severance               Investments
                                                                                                      FY21                      FY22
                                      Rents and Royalties     Other

                               *Severance tax amounts include effects on general             Dec 2019         Dec 2020          Feb 2021
                               fund revenue and school tax distributions to the tax
                               stabilization reserve in excess of the five-year                       Source: Consensus Revenue Estimating Group
                               average

                                                                                                                                                   2
Post-Session Fiscal Report - Dawn Iglesias, Chief Economist David Abbey, Director Presented to the Revenue Stabilization and Tax Policy Committee ...
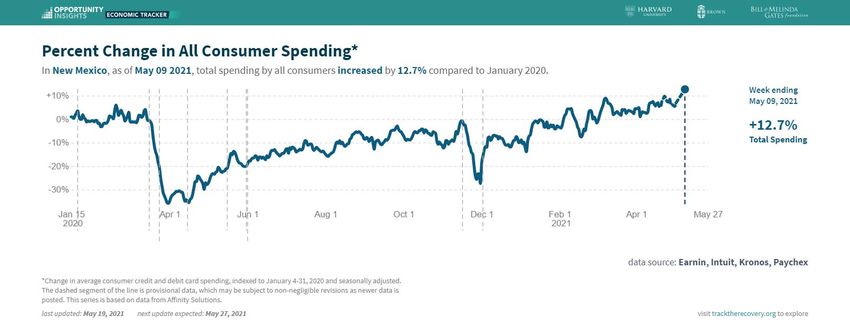
Lawmakers increased recurring budgets by 5.3 percent to
      $7.45 billion. The 2021 session also included $928.6
       million of additional non-recurring appropriations.
   2021 GAA - New General Fund Spending                     2021 Non-Recurring Appropriations (in millions)
          Increases (in millions)
Remove Credits from SEG               $51.7           Special and Supplemental Appropriations        $151.5

Extended Learning Programs            $78.9           Roads and Capital Projects (GAA)               $300.0

Replace Federal Funds                $121.6           Teacher Affordability Scholarship Fund          $20.0
1.5% Compensation                     $63.9           College Affordability Endowment                 $15.0
ERB Increase                          $34.0           Other Fund Transfers                            $15.0
Medicaid                              $14.2           Statewide Broadband                             $85.0
Secretary of State-Elections          $5.9            Unemployment Trust Fund Loans                  $100.0
NMED Staffing                         $2.3            Other Supplemental GAA                          $16.6

DOH Facilities Staffing/Public                        LEDA Recovery Grants                           $200.0
                                      $3.0
Health Services                                       Capital Projects (HB 285)                       $18.2
All Other                             $2.5            All Other                                        $6.9
Total New Recurring                  $378.0           Total Nonrecurring                             $928.6
                                  Source: LFC Files                                                  Source: LFC Files

                      2021 regular session also included $199.7 million of nonrecurring revenue reduction
                       for a gross receipts tax deduction for certain food service establishments and $600
                       personal income tax rebates for low-income individuals.
                                                                                                                         3
Post-Session Fiscal Report - Dawn Iglesias, Chief Economist David Abbey, Director Presented to the Revenue Stabilization and Tax Policy Committee ...
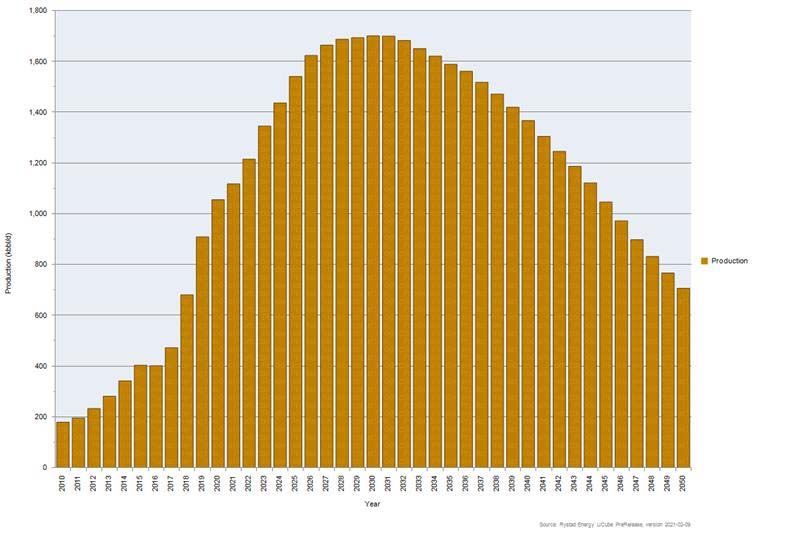
At the end of the session, general fund reserve balances
          were projected to end FY21 at $1.57 billion and to end
                           FY22 at $1.76 billion.

                                                                          General Fund Reserves                                 General Fund Reserve
      Projected draw from reserves in                                              (in billions)                                    Balances:
       FY21 of $1.085 billion (based on                              FY22 Est.
                                                                                                                                     Percent of Recurring
                                                                                                                                       Appropriations
       the February consensus revenue                                FY21 Est.
                                                                        FY20
                                                                                                                        FY22*                          23.6%
       estimate)                                                        FY19
                                                                        FY18                                            FY21*                        21.7%
                                                                        FY17
                                                                                                                         FY20                                  35.4%
                                                                        FY16
                                                                        FY15                                             FY19                            28.9%
           General Fund Reserve Balance Projections                     FY14
                            (in millions)                                                                                FY18                     19.5%
                                                                        FY13
                                                         FY21           FY12                                             FY17             8.3%
    Reserve Fund                             FY20                       FY11
                                                          est.                                                           FY16         2.4%
                                                                        FY10
    Operating Reserve                       $507.2       $88.9          FY09                                             FY15                11.6%
    Appropriation Contingency                                           FY08                                             FY14                11.8%
                                             $8.7        $50.7          FY07
    Fund
                                                                        FY06                                             FY13                11.9%
    State Support Reserve                    $29.1       $15.4          FY05                                             FY12                  13.1%
    Tobacco Settlement Permanent                                        FY04
                                            $241.3       $251.4         FY03                                             FY11              9.6%
    Fund
                                                                        FY02                                             FY10           5.1%
    Tax Stabilization Reserve               $1,727.3    $1,163.4
                                                                             $0.0       $1.0      $2.0      $3.0         FY09            6.6%
    Total Balances                          $2,513.6    $1,569.8
                                                                             Tax Stabilization Reserve                   FY08                  13.1%
                         Source: LFC Post-Session Report, May 2021
                                                                             Tobacco Permanent Fund                      FY07                12.6%
                                                                             Operating Reserve

                                                                                                                                  0%
                                                                                                                                  5%
                                                                                                                                 10%
                                                                                                                                 15%
                                                                                                                                 20%
                                                                                                                                 25%
                                                                                                                                 30%
                                                                                                                                 35%
                                                                                                                                 40%
                                                                             Other Reserves
                                                                            Source: LFC Post-Session Report, May 2021   *Estimated      Source: LFC Post-Session Report,
                                                                                                                                                              May 2021

                                                                                                                                                                       4
Post-Session Fiscal Report - Dawn Iglesias, Chief Economist David Abbey, Director Presented to the Revenue Stabilization and Tax Policy Committee ...
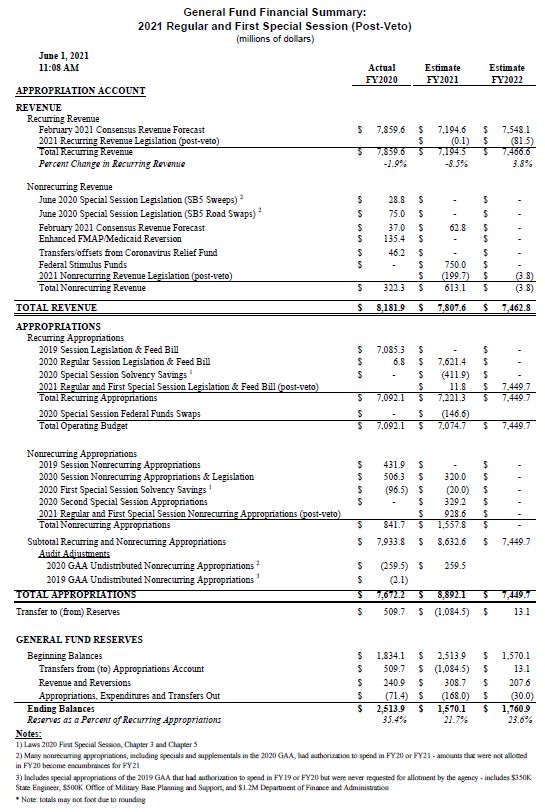
General Fund Financial Summary
LFC Post-Session Report, May 2021
https://www.nmlegis.gov/Entity/LFC/Doc
uments/Session_Publications/Post_Sessio
n_Fiscal_Reviews/May%202021.pdf

                                          5
Post-Session Fiscal Report - Dawn Iglesias, Chief Economist David Abbey, Director Presented to the Revenue Stabilization and Tax Policy Committee ...
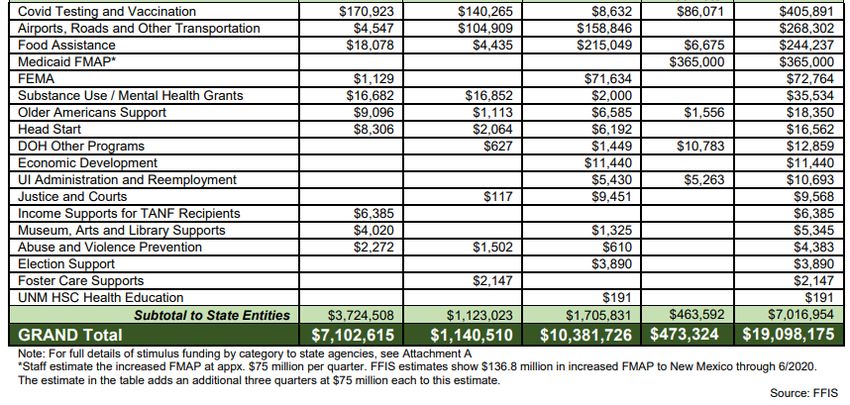
Revenues are currently tracking about $350 million above
     the consensus estimate. Additional revenue will result in a
       smaller draw from reserves to cover the FY21 budget.

                                                  FY21 General Fund Revenue Tracking vs. Forecast
                                                                                     (in millions)
$200.0
                                                                                                                                      General Fund: +$350 million
                                                                                                                                      Tax Stabilization Reserve: +$130 million
          $156.7
$150.0
                                                                                                         $132.8

$100.0
                                                                  $64.2                                    TSR                      $64.2
                                                                                      $48.1                $130
 $50.0                                        $38.4
                                                                                                                                                                        $20.1
                            $3.2
  $0.0
                                                                                                                          ($16.8)
                                                                                                                                                    ($29.3)
($50.0)

                   * Includes excess Oil and Gas Emergency School Tax revenues going to tax stabilization reserve (TSR)                     Source: DFA General Fund Report, LFC Files

                                                                                                                                                                                         6
New Mexico has received over $19 billion in federal funds,
    including direct payments to individuals, support to businesses,
              and funding to state and local governments.

LFC Hearing Brief
Tracking Federal
Stimulus Funds, April
2021
https://www.nmlegis.go
v/handouts/ALFC%200
42921%20Item%201%2
0Federal%20Relief%20
Funds%20Brief%204.29
.21.pdf
Tracking Federal
Stimulus Funds, May
2021
https://www.nmlegis.go
v/handouts/ALFC%200
51821%20Item%2011%2
0Hearing%20Brief%20-
%20Federal%20Relief%
20Funds%20May%2020
21.pdf

                                                                       7
Employment is recovering, but remains 8 percent (71.7
                  thousand jobs) below pre-pandemic levels, and below
                       employment levels in the Great Recession.

                                                       New Mexico Total Nonfarm Employment                                                                                                                                                                             Percentage of Jobs Lost During the Pandemic
880.0                                                                                                                                                                                                                                    863.6                                   Regained by April 2021
860.0                                                                                     "Lost Decade" of Employment                                                                                                                                        Transportation, Warehousing and
                                                                                                                                                                                                                                                                                                                                              86%
840.0                                                                                                                                                                                                                                                                     Utilities
820.0                                                                                                                                                                                                                                                                            Retail Trade                                                 83%
800.0                                                                                                                                                                                                                                             790.2
                     Great Recession                                                                                                                                                                                                                                   Leisure and Hospitality                                             55%
780.0
                                                                                                                                                                                                     COVID-19                                               Health Care and Social Assistance
760.0                                                                                                                                                                                                                                                                                                                                     51%
                                                                                                                                                                                                     Pandemic                                                            (*NSA)
740.0
                                                                                                                                                                                                                                                                 Educational Services (*NSA)                                              50%
720.0
700.0                                                                                                                                                                                                                                                      Professional and Business Services                                             48%
        Jan-08
                 Jul-08
                          Jan-09
                                   Jul-09
                                            Jan-10
                                                     Jul-10
                                                              Jan-11
                                                                       Jul-11
                                                                                Jan-12
                                                                                         Jul-12
                                                                                                  Jan-13
                                                                                                           Jul-13
                                                                                                                    Jan-14
                                                                                                                             Jul-14
                                                                                                                                      Jan-15
                                                                                                                                               Jul-15
                                                                                                                                                        Jan-16
                                                                                                                                                                 Jul-16
                                                                                                                                                                          Jan-17
                                                                                                                                                                                   Jul-17
                                                                                                                                                                                            Jan-18
                                                                                                                                                                                                     Jul-18
                                                                                                                                                                                                              Jan-19
                                                                                                                                                                                                                       Jul-19
                                                                                                                                                                                                                                Jan-20
                                                                                                                                                                                                                                         Jul-20
                                                                                                                                                                                                                                                  Jan-21
                                                                                                                                                                                                                                                                              Other Services                                              45%

                                                                                                                         Source: Bureau of Labor Statistics (seasonally adjusted)                                                                                                Total Private                                           42%

                    As of April 2021, the state had regained 31                                                                                                                                                                                                               Manufacturing                                            31%

                     percent of jobs lost in the pandemic                                                                                                                                                                                                                      Total Nonfarm                                            31%

                    New Mexico’s unemployment rate in April 2021                                                                                                                                                                                                                Construction                            -11%

                     was 8.2 percent                                                                                                                                                                                                                                        Wholesale Trade                              -14%

                    UNM’s Bureau of Business and Economic                                                                                                                                                                                                                 Financial Activities                  -82%

                     Research estimates the state will not reach pre-                                                                                                                                                                                                     Mining and Logging         -183%
                     pandemic employment levels until 2024                                                                                                                                                                                                                       Government       -204%

                                                                                                                                                                                                                                                                                             -300%
                                                                                                                                                                                                                                                                                                 -250%
                                                                                                                                                                                                                                                                                                     -200%
                                                                                                                                                                                                                                                                                                         -150%
                                                                                                                                                                                                                                                                                                             -100%-50% 0% 50%100%150%
                                                                                                                                                                                                                                                                                           Source: BLS; job gains from April 2020 to April 2021, as a
                                                                                                                                                                                                                                                                                            percentage of jobs lost from February 2020 to April 2020
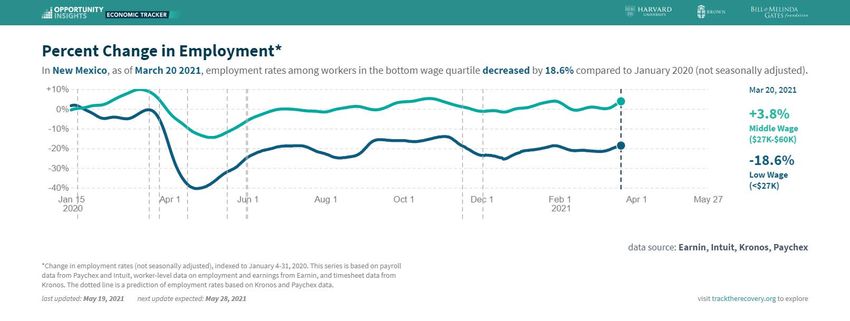
                                                                                                                                                                                                                                                                                                                                                        8
High-wage employment resumed pre-pandemic levels in
July 2020, but low-wage employment remains down 18.6
            percent as of mid-March 2021.

                                                       9
Vaccine rollout, statewide business re-openings, and
federal stimulus checks are boosting consumer spending
and supporting stronger-than-estimated GRT collections.

         Although unemployment remains high, consumer spending in New Mexico began
          exceeding pre-pandemic levels in 2021.
           o   This is the case for all income earners, largely due to federal transfer
               payments through stimulus checks and enhanced unemployment benefits

                                                                                          10
Retail spending remains high, and the leisure and
          hospitality sector is improving.

                                                       Leisure & Hospitality MTGR
                                                 (percent Change from same month in 2018)

                        30.0%

                        20.0%

                                                                                      Vaccine rollout,
                        10.0%                                                         fewer business
                                                                                        restrictions

                         0.0%

                        -10.0%

                        -20.0%

                        -30.0%

                        -40.0%
                                 Jan-19

                                 Mar-19

                                 Oct-19
                                 Nov-19
                                 Dec-19
                                 Apr-19
                                 May-19
                                 Jun-19
                                  Jul-19
                                 Aug-19
                                 Sep-19

                                 Jan-20

                                 Mar-20

                                 Oct-20
                                 Nov-20
                                 Dec-20
                                 Apr-20
                                 May-20
                                 Jun-20
                                  Jul-20
                                 Aug-20
                                 Sep-20

                                 Jan-21

                                 Mar-21
                                 Feb-19

                                 Feb-20

                                 Feb-21
                         Note: includes data for Accommodation and Food
                         Services and for Arts, Entertainment, and Recreation

                                                                                Source: RP500, author's calculations

                                                                                                                       11
Eighteen of the state’s 33 counties are showing year-
     over-year growth for FY21 through March.

                                 Matched Taxable Gross Receipts by County
                                         FY21 vs FY20 thru March
                           Year-over-Year       Year-over-Year                       Year-over-Year       Year-over-Year
           Jurisdiction                                             Jurisdiction
                              Amount               Percent                              Amount               Percent
       Bernalillo County         $326,354,719       2.3%         McKinley County          -$61,626,994         -6.9%
       Catron County               $1,980,036       6.8%         Mora County                 $878,419          3.1%
       Chaves County             -$57,235,718       -5.7%        Otero County             $46,428,917          6.1%
       Cibola County               $7,447,039       2.7%         Quay County               $7,665,457          7.0%
       Colfax County              $15,279,229       6.6%         Rio Arriba County         -$5,503,158         -1.8%
       Curry County                $1,320,078       0.2%         Roosevelt County         $46,090,947          11.5%
       De Baca County             -$5,339,489       -24.6%       San Juan County         -$240,267,959        -10.8%
       Dona Ana County           -$15,346,583       -0.5%        San Miguel County        -$17,155,233         -5.6%
       Eddy County            -$2,363,725,864       -38.0%       Sandoval County          $73,050,641          5.6%
       Grant County              -$40,389,054       -10.4%       Santa Fe County         -$283,516,365         -8.6%
       Guadalupe County           $20,734,461       29.5%        Sierra County             $7,734,991          5.6%
       Harding County             -$1,302,998       -10.5%       Socorro County            $4,134,195          2.7%
       Hidalgo County             $63,293,401      115.5%        Taos County              -$53,720,799         -9.3%
       Lea County             -$1,953,914,282       -35.8%       Torrance County         $145,534,012          88.5%
       Lincoln County               -$762,891       -0.2%        Union County             -$18,470,229        -22.0%
       Los Alamos                $133,633,607       10.2%        Valencia County         $138,957,249          18.0%
       Luna County               $219,628,020       76.0%        Out of State            -$430,317,298         -5.0%
                                                                                                         Source: RP 500

      Counties still showing year-over-year declines are primarily rural, dependent on
      extractive industries, or dependent on tourism.
                                                                                                                           12
Overall GRT collections are still down compared with FY20.
Year-over-year declines are driven primarily by reduced oil
                 and gas drilling activity.
                   Matched Taxable Gross Receipts by Industry - FY21 vs FY20 thru March
                                                        Matched Taxable       Year-over-Year      Year-over-Year
                            Industry
                                                         Gross Receipts          Growth              Change
Mining, Quarrying, and Oil and Gas Extraction                $3,240,256,658     -$2,205,434,251           -40.5%
Utilities                                                    $2,235,729,799       $113,274,658             5.3%
Construction                                                 $6,155,449,695       -$695,090,685           -10.1%
Manufacturing                                                $1,414,022,060       -$151,275,484            -9.7%
Wholesale Trade                                              $2,053,459,480       -$585,434,104           -22.2%
Retail Trade                                                $12,214,479,504       $839,193,612             7.4%
Transportation and Warehousing                                $557,249,525        -$180,760,916           -24.5%
Information                                                  $1,480,814,276       -$737,651,972           -33.3%
Real Estate and Rental and Leasing                           $1,255,565,287       -$164,932,052           -11.6%
Professional, Scientific, and Technical Services             $4,964,460,809        -$55,442,057            -1.1%
Administrative/Support & Waste Management/Remediation        $2,500,834,503       $269,317,031            12.1%
Health Care and Social Assistance                            $2,946,241,630       $313,797,751            11.9%
Leisure and Hospitality Services                             $3,067,478,008       -$646,526,727           -17.4%
Other Industries                                             $5,590,611,659       -$401,484,303            -6.7%
Total                                                       $49,676,652,892     -$4,288,449,498            -7.9%
                                                                                                   Source: RP500

                    •    Most declines in mining, construction, and wholesale trade are in Eddy
                         and Lea Counties and from out-of-state receipts.
                    •    Most declines in the information industry are in Bernalillo County.
                    •    Most declines in leisure and hospitality are in Bernalillo and Santa Fe
                         Counties, but also in Dona Ana, Taos, Eddy, and Lea.
                    •    Growth in retail is statewide, except for Eddy and Lea Counties.
                                                                                                                   13
Despite fewer active drilling rigs, producers are completing
    inventories of drilled-but-uncompleted (DUC) wells…

         New Mexico Active Rig Counts                                               Permian Basin Drilling Activity
                                          114
120                                                            700                                                             4,000

                                                                                                                               3,500
                                                               600
100
                                                                                                  Decline in DUC
                                                                                                  inventory                    3,000
                                                               500
 80
                                                          71
                                                                                                                               2,500
                                                               400

 60                                                                                                                            2,000

                                                               300

                                                                     Completions exceed newly                                  1,500
 40                                                                  drilled wells, indicates use of
                                                               200   DUC inventory
                                                                                                                               1,000

 20
                                                               100
                                                                                                                               500

  0                                                             -                                                              -

                                        Source: Baker-Hughes
                                                                                DUC                    Drilled     Completed

                                                                                                                               Source: EIA

                                                                                                                                        14
…leading to a recovery in New Mexico’s oil and
                                natural gas production.

                                     New Mexico Oil                                                                                                                                                 New Mexico Natural Gas
                                 Average Barrels Per Day                                                                                                                                             Average MCF Per Day
1,300,000                                                                                                                                                             6,500,000
                                                                                                                              1.176 million
1,200,000
                                                                  1.131 million                                                                                       6,000,000
1,100,000

                                                                                                                                                                      5,500,000
1,000,000

 900,000                                                                                                                          Texas                               5,000,000
                                                                                                                                  Winter                                                                                                                                               Texas
                                                                                                                                  Storms                                                                                                                                               Winter
 800,000                                                                                                                                                                                                                                                                               Storms
                                                                                                                                                                      4,500,000                                                                   Price-
                                                                                      Price-
                                                                                                                                                                                                                                                 Induced
 700,000                                                                             Induced
                                                                                                                                                                                                                                                 Shut-Ins
                                                                                     Shut-Ins
                                                                                                                                                                      4,000,000
 600,000

 500,000                                                                                                                                                              3,500,000
                     Sep-18

                                       Jan-19

                                                         May-19

                                                                            Sep-19

                                                                                              Jan-20

                                                                                                                May-20

                                                                                                                                  Sep-20

                                                                                                                                                    Jan-21
                              Nov-18

                                                                                     Nov-19

                                                                                                                                           Nov-20
            Jul-18

                                                                   Jul-19

                                                                                                                         Jul-20
                                                Mar-19

                                                                                                       Mar-20

                                                                                                                                                             Mar-21

                                                                                                                                                                                           Jan-19

                                                                                                                                                                                                             May-19

                                                                                                                                                                                                                               Sep-19

                                                                                                                                                                                                                                                  Jan-20

                                                                                                                                                                                                                                                                    May-20

                                                                                                                                                                                                                                                                                      Sep-20

                                                                                                                                                                                                                                                                                                        Jan-21
                                                                                                                                                                                  Nov-18

                                                                                                                                                                                                                                        Nov-19

                                                                                                                                                                                                                                                                                               Nov-20
                                                                                                                                                                                                                      Jul-19

                                                                                                                                                                                                                                                                             Jul-20
                                                                                                                                                                                                    Mar-19

                                                                                                                                                                                                                                                           Mar-20

                                                                                                                                                                                                                                                                                                                 Mar-21
                                                                                                        Source: TRD's GenTax Reports
                                                                                                                                                                                                                                                                    Source: TRD's GenTax Reports

                                                                                                                                                                                                                                                                                                             15
Thousand Barrels per Day (Excluding Texas)

                                                               1000
                                                                                                     1500
                                                                                                                                    2000
                                                                                                                                                                 2500

                        0
                                       500
            Jan-2011
            Mar-2011
            May-2011
             Jul-2011
            Sep-2011
            Nov-2011
            Jan-2012
            Mar-2012
            May-2012
             Jul-2012
            Sep-2012
            Nov-2012
            Jan-2013
            Mar-2013
            May-2013
             Jul-2013
            Sep-2013
            Nov-2013
            Jan-2014                                                                                                     Texas – down 12.7 percent

                                                                                                                         New Mexico – up 4 percent
            Mar-2014
            May-2014
             Jul-2014
                                                                                                                         North Dakota – down 27 percent
            Sep-2014
            Nov-2014
            Jan-2015
            Mar-2015
            May-2015
                                                                                                                         March 2021 Year-Over-Year Production:

             Jul-2015
            Sep-2015
            Nov-2015
            Jan-2016
            Mar-2016
            May-2016
             Jul-2016
            Sep-2016
            Nov-2016
            Jan-2017
            Mar-2017
            May-2017
             Jul-2017
                                                                                                                                                                        (Thousand Barrels per Day)

            Sep-2017
            Nov-2017
            Jan-2018
            Mar-2018
            May-2018
             Jul-2018
            Sep-2018
            Nov-2018
            Jan-2019
            Mar-2019
            May-2019
             Jul-2019
                                                                                                                                                                                                     Top Oil-Producing States - January 2011 through March 2021

            Sep-2019
            Nov-2019
            Jan-2020
            Mar-2020
            May-2020
             Jul-2020
            Sep-2020
            Nov-2020
            Jan-2021
            Mar-2021
                        0
                                    1000
                                                    2000
                                                                                 3000
                                                                                                            4000
                                                                                                                                             5000
                                                                                                                                                                 6000

                                           Texas (thousand barrels per day)
                                                                                                                                                                                                                                                                   recovered to pre-pandemic levels of oil production.
                                                                                                                                                                                                                                                                  New Mexico is the only top oil-producing state to have

                            Texas
                                           Alaska
                                                    Colorado
                                                                                                            California

     Source: EIA
                                                                      Oklahoma
                                                                                        New Mexico
                                                                                                                              North Dakota

16
Oil and natural gas prices are tracking ahead of the forecast.
        FY21 prices are currently on track to average about $49/bbl
        for the year, and FY22 is on track to average about $57/bbl.

                                                                                                                                                                       Current Oil and Natural Gas Prices

        $70                                                                                                                                                                                                                                                                                                                                                                                                                                                   $14

        $60                                                                                                                                                                                                                                                                                                                                                                                                                                                   $12

        $50                                                                                                                                                                                                                                                                                                                                                                                                      FY22 $47.00 est.                             $10
                   FY19 $51.80                                                                                                                                                                                                                                                                 FY21 $43.50 est.

        $40                                                                                                                                                                                                                                                                                                                                                                                                                                                   $8
                                                                                                                                                              FY20 $44.01

                                                                                                                                                                                                                                                                                                                                                                                                                                                                    $/mcf
$/bbl

                                                                                                                                                                                                                                                                                                                            $7.54 Feb 2021Texas winter
                                                                                                                                                                                                                                                                                                                              storm spiked NM prices
        $30                                                                                                                                                                                                                                                                                                                                                                                                                                                   $6

        $20                                                                                                                                                                                                                                                                                                                                                                                                                                                   $4

        $10                                 FY19 $3.08                                                                                                                                                                                                                                                                                                                                                                                                        $2
                                                                                                                                                                                                                                                                      FY21 $2.45 est.                                                                                                                    FY22 $2.75 est
                                                                                                                                                                  FY20 $1.90
         $-                                                                                                                                                                                                                                                                                                                                                                                                                                                   $-
                                         Oct-18
                                                  Nov-18
                                                           Dec-18

                                                                                                                                                                                                                                                                                                                                                                                               Dec-21
              Jul-18
                       Aug-18
                                Sep-18

                                                                    Jan-19
                                                                             Feb-19
                                                                                      Mar-19

                                                                                                                                                     Oct-19
                                                                                                                                                              Nov-19
                                                                                                                                                                       Dec-19
                                                                                               Apr-19
                                                                                                        May-19
                                                                                                                 Jun-19
                                                                                                                          Jul-19
                                                                                                                                   Aug-19
                                                                                                                                            Sep-19

                                                                                                                                                                                Jan-20
                                                                                                                                                                                         Feb-20
                                                                                                                                                                                                  Mar-20

                                                                                                                                                                                                                                                                 Oct-20
                                                                                                                                                                                                                                                                          Nov-20
                                                                                                                                                                                                                                                                                   Dec-20
                                                                                                                                                                                                           Apr-20
                                                                                                                                                                                                                    May-20
                                                                                                                                                                                                                             Jun-20
                                                                                                                                                                                                                                      Jul-20
                                                                                                                                                                                                                                               Aug-20
                                                                                                                                                                                                                                                        Sep-20

                                                                                                                                                                                                                                                                                            Jan-21
                                                                                                                                                                                                                                                                                                     Feb-21
                                                                                                                                                                                                                                                                                                              Mar-21

                                                                                                                                                                                                                                                                                                                                                                             Oct-21
                                                                                                                                                                                                                                                                                                                                                                                      Nov-21
                                                                                                                                                                                                                                                                                                                       Apr-21
                                                                                                                                                                                                                                                                                                                                May-21
                                                                                                                                                                                                                                                                                                                                         Jun-21
                                                                                                                                                                                                                                                                                                                                                  Jul-21
                                                                                                                                                                                                                                                                                                                                                           Aug-21
                                                                                                                                                                                                                                                                                                                                                                    Sep-21

                                                                                                                                                                                                                                                                                                                                                                                                        Jan-22
                                                                                                                                                                                                                                                                                                                                                                                                                 Feb-22
                                                                                                                                                                                                                                                                                                                                                                                                                          Mar-22
                                                                                                                                                                                                                                                                                                                                                                                                                                   Apr-22
                                                                                                                                                                                                                                                                                                                                                                                                                                            May-22
                                                                                                                                                                                                                                                                                                                                                                                                                                                     Jun-22
                                    New Mexico Oil                                                                                                                                       Weighted WTI Futures (w/differential)                                                                                                               CREG Feb 21 Oil

                                    New Mexico Gas                                                                                                                                       Weighted HH Futures (w/differential)                                                                                                                CREG Feb 21 Gas

                                                                                                                                                                                                                                                    Source: Weighted oil and gas prices derived from EIA, IHS and NYMEX Forecasts; Updated 05/14/21

                                                                                                                                                                                                                                                                                                                                                                                                                                                                   17
What do changes in production and prices
        mean for New Mexico revenues?

• Based on February 2021 estimate for direct oil and
  gas revenues (production taxes and federal royalties),
   – A $1 change in the annual average NM price of oil has about
     an $23 million impact on the general fund
   – A $0.10 change in the annual average NM price of natural gas
     has about a $14 million impact on the general fund
   – Each additional million barrels of oil generates about $3
     million for the general fund
      • NM is currently on track to produce about 390 million barrels in FY21,
        20 million barrels above the February 2021 projection

   – Each additional 10 billion cubic feet of natural gas generates
     about $2 million for the general fund

                                          Note: general fund impacts include effects on the tax stabilization reserve

                                                                                                                        18
2021 LEGISLATION AFFECTING
REVENUES

                             19
Lawmakers provided over $400 million in pandemic
         relief and economic stimulus legislation.

   Chapter 4 (Senate Bill 1) provides a temporary gross receipts tax (GRT) deduction          2021 Pandemic Relief and
    for certain food service establishments (restaurants and bars, food trucks,                   Economic Stimulus
    craft distillers, small brewers, and winegrowers) from March 2021 to June 2021.                   (estimated costs)
    The bill holds local governments harmless by providing for a distribution from the
                                                                                          Legislation                   FY21       FY22
    state to counties and municipalities in the amount of the lost GRT in those areas.
                                                                                          SB 1 – GRT
   Chapter 4 also provides a $600 personal income tax (PIT) rebates to                   deduction for food
                                                                                                                        $90.3
    individuals with incomes less than $31.2 thousand claiming the working families tax   and beverage
                                                                                          establishments
    credit.
                                                                                          SB 1 – PIT rebates of
                                                                                          $600 for low-income          $109.4
   Chapter 6 (Senate Bill 2) waives fees for all liquor license holders in 2021.         working individuals

   Chapter 5 (Senate Bill 3) extends the Small Business Recovery Act through the         SB 2 – Waive fees for
                                                                                                                                    $3.8
                                                                                          liquor license holders
    end of May 2022. The bill increases the available funding for the program from the
    severance tax permanent fund (STPF) from $400 million to $500 million, expands        HB 11 – LEDA
                                                                                                                       $200.0
    the program to allow for loans up to $150 thousand with a 10-year payback period,     Recovery Grants
    and allows proceeds from the loans to be used to make non-Covid-related business      Total General Fund           $399.7       $3.8
    improvements to grow the business’s e-commerce and sales capacity.

   Chapter 3 (House Bill 11) provides up to $100 thousand in Local Economic              SB 3 – Small
    Development Act (LEDA) grants to businesses to assist with rent, lease, and           Business Recovery                *          *
    mortgage payments. Funding is prioritized to qualifying businesses demonstrating      Act Loans
    the greatest percentage reduction in annual revenues.                                 * Reduced general fund earnings on severance tax
                                                                                          permanent fund expected beginning FY23
                                                                                                Source: LFC Post-Session Report, May 2021

                                                                                                                                          20
The 2021 regular session expanded certain tax
           expenditures and anti-pyramiding provisions.

   Chapter 116 (House Bill 291) increases the working families tax credit
    (WFTC) to 20 percent of the federal earned income tax credit through tax year           2021 Tax Expenditures and
    2022 and increases the credit to 25 percent beginning in tax year 2023. The             Anti-Pyramiding Legislation
    final bill also expands the low-income comprehensive tax rebate (LICTR)                             (estimated costs)
    to apply to higher incomes, provides for higher rebates, and creates an
    automatic inflation-adjustment to the rebate amounts.                              Legislation                              FY22    FY23

   Chapter 66 (House Bill 278) expands the manufacturing GRT deduction to             HB 291 - Working
                                                                                                                                $24.9   $22.6
    include the sale of tangible personal property to either a manufacturer or a       Families Tax Credit
    manufacturing services provider. This deduction is intended to reduce              HB 291 - Low-Income
    pyramiding of GRT on the sale of tangible personal property to either a            Comprehensive Tax                        $48.8   $48.9
    manufacturer or a manufacturing services provider. The measure also provides       Rebate
    that receipts from selling or leasing qualified manufacturing equipment may be     HB 255 - Gross receipts
    deducted from gross receipts if the sale or lease is made to a manufacturer or a   and income tax
                                                                                                                                $5.1     $5.1
    manufacturing services provider.                                                   deductions for liquor
                                                                                       license holders
   Chapter 7 (House Bill 255) creates deductions from GRT and the personal
                                                                                       HB 15 - Sustainable
    and corporate income taxes for liquor license holders in an amount equal to        Building Tax Credit
                                                                                                                                  *        *
    gross receipts from alcohol sales by lessees up to $50 thousand of a dispenser’s
    license, or up to $25 thousand of a retailer’s license, for four taxable years.    HB 278 - Manufacturing
                                                                                       Services GRT                             $3.0     $3.0
              Chapter 84 (House Bill 15) extends the sustainable building tax         Deduction
               credit for projects completed by April 2023 and credit claims made      Total General Fund                       $84.0   $81.8
               through the end of tax year 2024.                                       * Applicable to tax year 2024 and 2025

                                                                                                        Source: LFC Post‐Session Report, May 2021

                                                                                                                                                21
The Legislature also passed a number of other measures
    in the 2021 regular session that both reduce and increase
                      general fund revenues.
   Chapter 125 (Senate Bill 256) mandates that 100 percent of projected remaining balances in the fire protection fund
    be distributed to the fire protection grant fund, a change that will reduce the annual reversions to the general fund by about
    $20 million per year.
   Chapter 136 (Senate Bill 317) includes increases to the health insurance premium surtax by 2.75 percentage
    points and create the health care affordability fund.
   House Joint Resolution 1 proposes a constitutional amendment to increase the distribution from the permanent
    school fund (a component of the land grant permanent fund earmarked for public schools) by 1.25 percentage points.
        60 percent of the additional distribution shall be for the provision of early childhood education and 40 percent shall
         be for enhanced instruction for students at risk of failure, extending the school year, and public school teacher
         compensation.
        If passed by voters in the next election and approved by Congress, the measure would provide an additional $221.5
         million distribution from the permanent school fund in FY23 – about $126.9 million for early childhood education
         and about $84.6 million for public education.
   Chapter 65 (House Bill 98) is a tax code clean-up bill proposed by the Taxation and Revenue Department that makes
    a number of changes regarding information published for taxpayers, timing of deposits for income tax receipts, innocent
    spouse relief, wage garnishment for delinquent taxes and late filing fees, and references to the current U.S. Code. The bill
    also clarifies the use of alternative evidence in lieu of nontaxable transaction certificates and makes clarifying changes to
    several tax expenditures, including the rural jobs tax credit, healthcare practitioner deductions, and the food tax deduction.
   Among other bills enacted, Chapter 69 (Senate Bill 218) allows taxpayers to apportion and allocate income pursuant to
    New Mexico’s Uniform Division of Income for Tax Purposes Act. Chapter 83 (Senate Bill 410) provides that New
    Mexico adopt the Multistate Tax Commission’s uniform model statute for federal partnership audits. Chapter 72 (Senate
    Bill 223) authorizes the New Mexico Finance Authority to issue an additional $22 million in cigarette tax revenue bonds
    for completion of the University of New Mexico’s Comprehensive Cancer Center, a measure that will have a future impact by
    delaying the date in which those cigarette tax revenues would be distributed to the general fund.
                                                                                                                                22
The 2021 special session focused on legalizing and taxing
         recreational cannabis and expanded economic
             development measures through LEDA.
   Chapter 4 (House Bill 2) enacts the Cannabis Regulation Act.
         Decriminalizes the possession, use, production, transportation, and sale of commercial cannabis for nonmedical
          adult use and creates a regulatory and taxation structure.
         Creates a new Cannabis Control Division (CCD) within the Regulation and Licensing Department and requires the
          CCD to promulgate rules for licensing and regulating commercial cannabis activities no later than January 1, 2022.
          Commercial cannabis retail sales are required to begin no later than April 1, 2022.
         CCD may promulgate rules that limit the number of cannabis plants a licensee may produce through the end of 2025,
          a provision that could affect the supply and price of commercial cannabis.
         Enacts the Cannabis Tax Act (CTA), which imposes a cannabis excise tax of 12 percent on cannabis retailers and is
          applied to the price paid for a cannabis product. The tax does not apply to retail sales of medical cannabis sold to
          qualified patients or caregivers.
         Imposes gross receipts tax on the sales of commercial cannabis and creates a new GRT deduction for medical
          cannabis sales.
         On full implementation in FY23, revenues from the excise tax and GRT on commercial cannabis are estimated to
          generate at least $30.8 million for the general fund and $16.7 million for local governments. However, after
          accounting for the new GRT deduction for medical cannabis, net new revenue as a result of Chapter 4 in FY23 is
          estimated at $19.2 million to the general fund and $9.4 million for local governments. Revenues are expected to
          increase over 50 percent in FY24 as the legal market develops in the state.
   Chapter 2 (Senate Bill 1) expands the Local Economic Development Act (LEDA) to allow a permanent mechanism for
    tax revenue sharing for certain new, large LEDA projects.
         Allows 50 percent of some state and local GRT and compensating revenue from large LEDA projects (over $350
          million in construction and infrastructure costs) to be placed into the LEDA fund to help with recruitment of those
          large projects.
                                                                                                                                 23
Summary of 2021 Legislation

                                                                     2021 Legislative Sessions Detail
                                                                                          FY21                          FY22                   FY23                      FY24

                                                                                                  Non-                       Non-                      Non-                      Non-
                                                                                   Recurring                  Recurring                 Recurring                Recurring
                                                                                                Recurring                  Recurring                 Recurring                 Recurring
REVENUE
 2021 Regular Session:
       Bill No.
                Pandemic Relief
Ch. 4  SB 1     Restaurant Gross Receipt Tax Deduction                                          $   (199.7)
Ch. 6  SB 2     Waive 2021 Liquor License Fees                                                  $      -                   $    (3.8)
Ch. 5  SB 3     Small Business Recovery Act                                                                   $     -                   $    (5.0)               $    (10.4)
                   Tax Package
Ch. 84    HB 15    Sustainable Building Tax Credit                                                            $     -                   $     -                  $     (2.2)
Ch. 7     HB 255   Alcohol Deliveries                                                                         $    (5.1)                $    (5.1)               $     (5.1)
Ch. 66    HB 278   Manufacturing Services Gross Receipts                                                      $    (3.0)                $    (3.0)               $     (3.0)
Ch. 116   HB 291   Tax Changes                                                                                $   (73.7)                $   (72.5)               $   (100.1)
Ch. 65    HB 98    Omnibus Tax Bill                                                                           $    (1.0)                $    (1.0)               $     (1.0)
                   Other
Passed    HJR 1    Permanent Fund for Early Childhood, CA                                                     $     -                   $   211.5                $   223.9
Ch. 125   SB 256   Fire Protection Grant Fund Changes                                                         $   (19.1)                $   (20.1)               $   (20.6)
Ch. 57    SB 160   Judicial Candidates in Voter Action Act                                                    $     0.2                 $     0.2                $     0.2
Ch. 136   SB 317   No Behav. Health Cost Sharing/Health Insurance Premium Surtax                              $    22.0                 $    38.3                $    38.8
Vetoed    SB 375   Officer Training & Certification (Law Enf. Prot. Fund)                                     $     -                   $    (6.0)               $    (6.0)
 2021 First Special Session:
Ch. 4   HB 2      Cannabis Regulation Act                                          $    (0.1)                 $     0.3                 $    19.2                $     30.1

TOTAL REVENUE                                                                      $    (0.1) $ (199.7) $         (79.3) $      (3.8) $     162.5    $     -     $   150.7     $     -

                                                                                                                                                                                     24
OUTLOOK FOR TAX ISSUES

                         25
Outstanding Tax Policy Issues

   Significant tax reform initiatives left undone (e.g.                Selected Cities Combined Gross
    broadening the GRT base and eliminating certain tax                    Receipts Tax Rate History

    expenditures, lowering GRT rates, addressing tax                 9.0%

    pyramiding for business-to-business services, etc.)              8.5%

        Senate Bill 211 attempted to reduce the state GRT rate by   8.0%
         one-eighth percent; however, the bill did not attempt to
                                                                     7.5%
         make base-broadening measures to offset the costs and did
         not address rising local GRT rates.                         7.0%

   Personal income tax changes tend to focus on additional          6.5%

    rates and brackets for top income earners, rather than           6.0%
    incorporating adjustments to existing rates and brackets.
                                                                     5.5%
   As the world transitions away from fossil fuels, the state
                                                                     5.0%
    will likely need consider how wind and solar energy
    contribute to the recurring tax base, while balancing the        4.5%

    taxation of renewable energy with the state’s
                                                                            Santa Fe                    Las Cruces
    competitiveness for the industry to grow.                               Clovis                      Albuquerque

   Considerations for revenue stability and reducing state                 Farmington                  Hobbs
                                                                            State Rate
    budget dependence on oil and gas revenues.
                                                                             Source: New Mexico Tax Research Institute, TRD

                                                                                                                              26
New Mexico has over 100 tax expenditures that cost over
         $1 billion annually. The state’s top ten tax expenditures
               account for over 75 percent of the total cost.
                                    Tax Expenditure                                5-Year Avg. Cost

 Food GRT Deduction (includes hold harmless distributions to local
                                                                                         $278.5
 governments)

 Prescription Drugs GRT or GGRT Deduction                                                 $93.1

 Health Care Practitioners GRT Deduction (includes hold harmless
                                                                                          $71.3
 distributions to local governments)

 Film Production Tax Credits/Film and Television Tax Credits                             $70.5**
 Hospitals 50% (prior to 2019) or 60% (on and after 2019) GRT
                                                                                          $68.0
 Deduction
 Capital Gains PIT Deduction                                                              $60.1

 Working Families Tax Credit                                                              $57.8*
 NMMIP Assessment Credit                                                                  $51.2

 Apportionment Election of CIT (double/single sales - manufacturing
                                                                                          $27.8
 or computer processing facility)

 Receipts of Nonprofit Organizations Exemption from GRT, except
                                                                                          $27.8
 State and Nat'l Labs
Source: TRD 2020 Tax Expenditure Report
*The working families tax credit (WFTC) was expanded in the 2019 session at an estimated additional cost
of about $40 million per year. The WFTC was further expanded in the 2021 session at an estimated
additional cost of $25 million/year in FY22 and $49 million/year in FY24.
**The film tax credit was expanded in the 2019 session and is estimated to reach a cost of $145 million
annually by FY23.
***The low-income comprehensive tax rebate was expanded in the 2021 session at an estimated
additional cost of $49 million per year. The current 5-year average cost for LICTR is about $18 million.
                                                                                                           27
New Mexico’s state budget remains heavily dependent on
   revenues from the oil and gas industry. In FY21, about 30
percent of state revenues are attributable to oil and gas activity.
                                                         General Fund Revenues Dependent on Oil & Gas Industry
             $5.0                                                                                                                                           50%
                                                                                                                                                                         Severance Taxes to
                                                                                                                                                                         TSR*
             $4.5                                                                                                                                           45%
                                                                                                                                                                         Permanent Funds
             $4.0                                                                                                                                           40%          Distrib.

             $3.5                                                                                                                                           35%          Severance Taxes to
                                                                                                                                                                         GF
             $3.0                                                                                                                                           30%
                                                                                                                                                                         GRT (Eddy, Lea, Out
  billions

                                                                                                                                                                         of State)
             $2.5                                                                                                                                           25%
                                                                                                                                                                         State Land Office
             $2.0                                                                                                                                           20%

             $1.5                                                                                                                                           15%          Federal Mineral
                                                                                                                                                                         Leasing
             $1.0                                                                                                                                           10%
                                                                                                                                                                         % excluding perm.
                                                                                                                                                                         funds & TSR distrib.
             $0.5                                                                                                                                           5%

                                                                                                                                                                         % including perm.
             $0.0                                                                                                                                           0%           funds & TSR distrib.
                      2009

                                 2010

                                            2011

                                                       2012

                                                                   2013

                                                                              2014

                                                                                         2015

                                                                                                    2016

                                                                                                               2017

                                                                                                                      2018

                                                                                                                             2019

                                                                                                                                      2020

                                                                                                                                                2021 est.
       *Oil and gas school tax revenue in excess of the five-year average is distributed to the tax stabilization
       reserve (TSR), softening the general fund's reliance on oil and gas revenues.                                          Source: LFC Analysis based on February 2021 Consensus Revenue Estimate

                                                                                                                                                                                                       28
While energy analytics firms expect NM oil production to
 continue growing for the next few years, production is
        currently expected to peak in the 2030s.
 Rystad Energy – New Mexico Long-Term Oil Production Outlook

                                                               “Recurring” or “nonrecurring”?

                                                                 •    The state will face tough
                                                                      choices in deciding how
                                                                      to treat general fund
                                                                      revenue growth from oil
                                                                      and gas revenues moving
                                                                      forward, particularly
                                                                      when growing recurring
                                                                      budgets

                                                                 •    Focus on diversifying and
                                                                      stabilizing state revenues

                                                                                                   29
The state’s budget needs are expected to grow.

   Base expectations in LFC’s general fund appropriation
                                                                                     General Fund Recurring
    outlook projects recurring budget growth of 3.8 percent,                          Appropriation Outlook
    before adjustments.                                                                    (in millions)
                                                                          $10,000
        Assumes public education spending will increase 4.5 percent,
         other state agency budgets will grow 2.5 percent to 3 percent,
         and Medicaid expenditures will grow 4 percent.                    $9,000

   The adjustment scenario shows an additional $480
    million of recurring budget needs in FY23. Adjustments                 $8,000
    include replacing federal funds and covering unfunded
    budget obligations based on 2021 legislation.
                                                                           $7,000
        Replace enhanced FMAP for Medicaid ($75 million)
        Replace enhanced FMAP for DD ($20 million)
                                                                           $6,000
        Replace Public Education Reform Fund ($50 million)
        HB4 – Civil Rights Act ($9 million)
                                                                           $5,000
        SB42 – Increase ERB Contributions ($34 million)
        SB317 – No Behavioral Health Cost-Sharing and Health
         Insurance Premium Surtax ($37.5 million)                          $4,000

                                                                                          FY05
                                                                                          FY06
                                                                                          FY07
                                                                                          FY08

                                                                                          FY10
                                                                                          FY11
                                                                                          FY12
                                                                                          FY13
                                                                                          FY14
                                                                                          FY15

                                                                                          FY20

                                                                                    FY22 Outlook
                                                                                    FY23 Outlook
                                                                                    FY24 Outlook
                                                                                    FY25 Outlook
                                                                                      FY21 GAA
                                                                                          FY09

                                                                                          FY16
                                                                                          FY17
                                                                                          FY18
                                                                                          FY19
        HJR1 – LGPF for Early Childhood and Public Education
         Initiatives ($211.5 million)
                                                                                          Recurring GF
        HB2 – Cannabis Regulation Act ($17 million)                                      Appropriations      Source: LFC Files

                                                                                                                              30
Phone: 505-986-4561
Email: dawn.iglesias@nmlegis.gov

QUESTIONS?

                                   31
You can also read