Second Quarter 2021 Earnings 52909940 - Macy's, Inc.
←
→
Page content transcription
If your browser does not render page correctly, please read the page content below

Second Quarter 2021 Earnings

                        52909940

                                   Jeff Gennette, Chairman & CEO
                                   Adrian Mitchell, CFO
                                   19 August 2021 (Revised)        0
Safe Harbor Statement

All statements in this presentation that are not statements of historical fact are forward-looking statements within the meaning of the Private
Securities Litigation Reform Act of 1995. Such statements are based upon the current beliefs and expectations of Macy’s management and are
subject to significant risks and uncertainties. Actual results could differ materially from those expressed in or implied by the forward-looking
statements contained in this release because of a variety of factors, including the effects of the novel coronavirus (COVID-19) on Macy's
customer demand and supply chain, as well as its consolidated results of operation, financial position and cash flows, Macy’s ability to
successfully implement its Polaris strategy and restructuring, including the ability to realize the anticipated benefits within the expected time
frame or at all, conditions to, or changes in the timing of proposed real estate and other transactions, prevailing interest rates and non-recurring
charges, the effect of potential changes to trade policies, store closings, competitive pressures from specialty stores, general merchandise
stores, off-price and discount stores, manufacturers’ outlets, the Internet and catalogs and general consumer spending levels, including the
impact of the availability and level of consumer debt, possible systems failures and/or security breaches, the potential for the incurrence of
charges in connection with the impairment of intangible assets, including goodwill, Macy’s reliance on foreign sources of production, including
risks related to the disruption of imports by labor disputes, regional or global health pandemics, and regional political and economic conditions,
the effect of weather and other factors identified in documents filed by the company with the Securities and Exchange Commission, including
under the captions “Forward-Looking Statements” and “Risk Factors” in the Company’s Annual Report on Form 10-K for the year ended
January 30, 2021 and the Company’s Quarterly Report on Form 10-Q for the quarter ended May 1, 2021. Macy’s disclaims any intention or
obligation to update or revise any forward-looking statements, whether as a result of new information, future events or otherwise, except as
required by law.

This presentation includes non-GAAP financial measures that exclude the impact of certain financial statement items. Additional important
information regarding these non-GAAP financial measures as well as others used in the earnings release can be found on the Investors section
of our website and in the appendix of this presentation.

                                                                                                                                                       1
Second Quarter and First Half Results

                                        2
Second Quarter Snapshot

                      millions, except per share figures and percentages   2Q21      2Q20      2Q19
Net Sales                                                                  $5,647   $3,559     $5,546
  Comp sales - owned                                                       61.2%    (34.7%)    0.2%
  Comp sales - owned + licensed                                            62.2%    (35.1%)    0.3%
Credit card revenues, net                                                  $197      $168      $176
Gross margin                                                               $2,294    $841      $2,151
  Gross margin rate                                                        40.6%    23.6%      38.8%
Selling, general & administrative expense (SG&A)                           $1,898   $1,398     $2,177
   SG&A rate                                                               33.6%    39.2%      39.3%
Asset sale gains                                                            $6         -        $7
Earnings before interest, taxes, depreciation and
                                                                           $753     $ (422)    $400
amortization (EBITDA)
Adjusted EBITDA                                                            $836     $ (142)    $402
Diluted earnings per share (EPS)                                           $ 1.08   $ (1.39)   $ 0.28
Adjusted Diluted EPS                                                       $ 1.29   $ (0.81)   $ 0.28
                                                                                                        3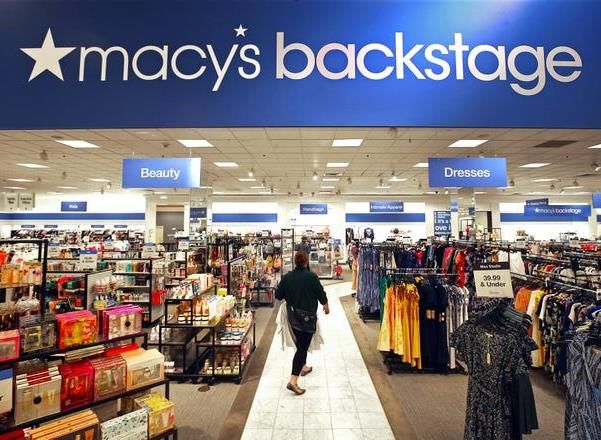
Spring Season Snapshot

                      millions, except per share figures and percentages    1H21      1H20        1H19
Net Sales                                                                  $10,353    $6,576     $11,050
  Comp sales - owned                                                       61.8%     (40.0%)      0.4%
  Comp sales - owned + licensed                                            63.0%     (40.2%)      0.5%
Credit card revenues, net                                                   $356       $299       $348
Gross margin                                                               $4,111     $1,357     $4,252
  Gross margin rate                                                        39.7%      20.6%      38.5%
SG&A                                                                       $3,646     $2,995     $4,287
  SG&A rate                                                                35.2%      45.4%      38.8%
Asset sale gains                                                            $12        $16        $49

EBITDA                                                                     $1,207    $ (4,294)    $846

Adjusted EBITDA                                                            $1,309    $ (830)      $849
Diluted EPS                                                                $ 1.41    $ (12.91)   $ 0.71
Adjusted Diluted EPS                                                       $ 1.68    $ (2.83)    $ 0.72
                                                                                                           4
Second Quarter Highlights

• Diluted EPS of $1.08 and Adjusted diluted EPS of $1.29 exceeding expectations, with Adjusted diluted EPS up $1.01 to 2Q19
• Adjusted EBITDA margin of 14.8% exceeded the margin in 2Q19 by 760 basis points
• Comparable sales up 5.8% on an owned basis and up 5.9% on an owned plus licensed basis versus 2019
   • Trend improvement of 16 percentage points compared to 1Q21
   • May and July posted mid-single digit comparable sales; June posted high-single digit comparable sales
• Digital sales grew 45% over 2Q19
   • Digital penetration was 32% of net sales and a 10-percentage point increase over 2Q19
• The company brought approximately 5 million new customers into the Macy's brand, a 30% increase compared to 2Q19
   • 41% of new customers came through the digital channel in 2Q21
• The company saw Platinum, Gold and Silver customers in its Star Rewards Loyalty program re-engage, with the average customer spend up 15% compared to
  2Q19, a 5-percentage point trend improvement from 1Q21
   • The company’s Bronze segment, its youngest and most diverse loyalty tier, continued to grow, adding approximately 2 million members.
• Gross margin was 40.6%, up 180 basis points from 2Q19
   • Merchandise margin improved 350 basis points from 2Q19 to 44.9%
   • Delivery expense accounted for 4.3% of sales during 2Q21, 170 basis points higher than 2Q19
• Inventory was down 14.5% from 2Q19
    • Driven by market dynamics and the company’s execution of its Polaris strategy.
    • Inventory turn for the trailing twelve months was 3.2 times, improving by 15% to 2Q19, while the trailing six months inventory turn was 1.5 times, improving by
      18% to 2Q19
• SG&A expense of $1.9 billion, a $279 million improvement from 2Q19
   • SG&A as a percent of sales was 33.6%, an improvement of 570 basis points from 2Q19
                                                                                                                                                                        5
Second Quarter Earnings Highlights
(Comparison to 2Q19 included below to more appropriately benchmark our performance)

millions, except per share figures and
percentages                               2Q21                                                      Notes

Credit Revenue                            $197
                                                    • Good credit health in our customers continuing and resulting in lower bad debt levels
         Change to 2Q19                   +$21

Gross Margin                              $2,294    • Driven by both tighter inventories and the accelerated momentum of our Polaris pricing, promotion,
                                                      and inventory initiatives
         Change to 2Q19                   +$143     • Merchandise margin improved 350 basis points due to leaner inventories and $110 million due to
                                                      pricing and promotion initiatives driven by the Polaris plan
Gross Margin Rate                         40.6%
                                                    • Delivery expense accounted for a degradation of about 170 basis points on gross margin rate due to
         Change to 2Q19                  +180 bps     increased digital penetration

SG&A Expense                              $1,898

         Change to 2Q19                   -$279     • Permanent Polaris SG&A cost expense savings derived in 2020, disciplined expense management
                                                      and improved productivity, along with a tight labor market, contributed to the second quarter SG&A
SG&A Rate                                 33.6%       performance

         Change to 2Q19                  -570 bps

Adjusted EBITDA margin                    14.8%

         Change to 2Q19                  +760 bps
                                                    • Driven by strong performance in key value creation metrics: sales, gross margin, inventory
Adjusted Diluted EPS                      $1.29       productivity, and expense management

         Change to 2Q19                   +$1.01                                                                                                           6
Q2 2021 Polaris Update

   Win with               Deliver Clear           Excel in Digital          Enhance Store              Modernize                  Enable
Fashion & Style               Value                 Shopping                 Experience               Supply Chain            Transformation

Wide assortment of      Leveraging data and      Upgraded search           Improved trend in        Continuing to update     Continuing to
brands and              analytics tools to       function to Google        stores sales, 18         infrastructure and       modernize
categories able to      most efficiently plan,   Cloud, utilizing AI and   percentage point         network, while           technology
flex with customer      place and price          machine learning to       sequential               leveraging improved      foundations; ensuring
demand                  inventory                improve customer          improvement from         data and analytics       agility to react to
                                                 experience                1Q21                     capabilities in          customers and the
Pandemic-               Higher full-price sell                                                      fulfillment strategies   market regardless of
impacted categories     through and lower        Improved customer         Applying                 to meet customers'       channel
improving – dressy,     clearance at Macy’s,     account experience        Contemporary sitelet     desire for speed and
luggage, denim          Backstage and            and advanced              U40 strategy to a        convenience              Building out data
                        Bloomingdale’s           product                   physical format to                                science and analytics
Launched U40 brand:                              recommendations to        launch in 160 stores     Supported ability to     capabilities with a
And Now This            Improved inventory       be real-time, data-                                stay agile and           focus on areas of
                        planning and better      driven and to help        Comparable sales for     navigate disruptions     competitive
Announced               merchant execution       customers discover        Backstage store-         by adjusting freight     differentiation
partnership with Toys   supported ability to     what they need or         within-store locations   strategies, working
‘R’ Us to expand toy    chase inventory to       inspire them to           open more than one       closely with brand
offering                achieve higher sell-     expand shopping           year continue to         partners and pushing
                        throughs, turnover                                 outperform full line     for more product
                        and AUR                                            Macy’s stores by 28                                                   7
                                                                           points
Credit Card Revenue

                                Performance Metrics                                    2Q21

                      New accounts                                         618K, Down 17% to 2Q19

                      Proprietary card penetration rate                  41.4%, Down 530 bps to 2Q19

                      •   Net credit card revenue of $197 million
                            • Up $21 million from 2Q19
                      •   Represented 3.5% of sales
                            • 30 bps higher than 2Q19
                      •   Digital new accounts up 60% vs. 2Q19
                            • Driven by stronger approval rates, consistent with a healthier online credit
                               customer and stronger application flow

                      •   Evaluating options for our Credit Card program to make the best choice that
                          aligns to our overall business strategies, including a potential transfer to another
                          financial services entity or a modified arrangement with Citi
                                                                                                                 8
Capital Allocation Highlights: 1H2021

                                         Strengthening Balance Sheet, Optimizing Capital Allocation and
                                                       Returning Capital to Shareholders
•   Free cash flow of $769 million
    •    Cash flow from operating activities of $965 million, up from $350 million in 2019; variance due to EBITDA growth as well as improved working
         capital
        –   Working Capital outflow of $36 million in 2021, improved from an outflow of $360 million in 2019 benefiting from inflows related to
            payables driven by longer payment terms, lower spending levels and timing of payments partially offset by an increase in merchandise
            inventories resulting from sales demand
    •    Capital expenditures of $230 million, down from $501 million in 2019, due primarily to a reduction in capital projects and spend as result of
         COVID-19

• $2.1 billion in cash at the end of 2Q21 due to strong performance and strong cash generation from Polaris cost-saving initiatives, giving us
  the confidence to execute on our capital allocation strategy
    • Repaid $1.3 billion in Senior Secured Notes in 3Q21
        –   Planned repayment of $294 million unsecured debt due in January 2022
        –   Expected to result in a leverage ratio no more than 2.5x by year-end
    •    Reinstatement of dividend, allows return of up to $95 million of cash to investors in 2021; nearly $200 million annually
        –   Starting with 15¢ a quarter, expected to grow over time with appropriate approvals from Board of Directors
    • Share repurchase program
        –   $500 million authorization                                                                                                                   9
Prudent De-levering of the Balance Sheet
Expect to achieve leverage ratio of no more than 2.5x by year-end 2021
($ Millions)
1,400 3.3 3.5
1,612
1,200 2.9 3.0
2.7 1,101
COVID-19
2.5 2.5
954 Impacted
1,000 2.5
800 751 2.0
600 567 1.5
539
400 1.0
200 0.5
- -
FY 2016 FY 2017 FY 2018 FY 2019 FY 2020* FY 2021e^
Debt Repayments Leverage Ratio
*Excludes $1.5 billion revolving credit facility repayment.
^FY 2021 estimate; proforma as of January 29, 2022. Excludes $500 million debt refinance during 1Q21. 10Remaining Debt Maturities, Post $1.3 Billion Senior Secured Debt Paydown
($ Millions) 3.24%
6.08%
13 5.28%
4.38%
183
665
81
387 385
3.88%
579 4.30%
294 5.13%
6.85% 6.38% 250 250
74 193
6.79%
133 7.88% 6.90%
7.60% 5
71 12
6 5 5
Fiscal Year 2021 2022 2023 2024 2025 2026 2027 2028 2029 2030 2031 2032 2033 2034 2035 2036 2037 2038 2039 2040 2041 2042 2043
Unsecured 2nd Lien Secured Notes
11
*% represents weighted average interest rateBrand and Channel Performance
12Digitally Led Omnichannel Model
Committed to delivering a dynamic, seamless
integration between physical stores and digital
shopping – the most effective way to meet the needs of
an omnichannel customer
• The Macy’s, Inc. Omnichannel ecosystem includes a strong fleet of stores
in the best mall and off-mall locations that are fully integrated with online
and mobile platforms
Stores Digital
• Well-integrated strategy built on a strong brand leveraging every
advantage of brick & mortar and every opportunity of digital
• Later this year, Macy’s, Inc. will open three new off-mall Market by
Macy's locations in the Atlanta and Dallas areas and its first small
format Bloomie's location in the D.C. metro area
• The Macy’s, Inc. Omnichannel customer
Order
• Shops frequently, 3 times more than single-channel customer Fulfilment
• Purchases across categories, 2 to 3 times more than single-
channel customer
• Spends more, 2.5 to 3.5 times more than single-channel customer
13Brand Second Quarter Highlights
2Q21
Comparable sales - owned + licensed Up 5.2% compared to 2Q19; 15.6pt improvement to 1Q21
Digital Penetration 31%
2Q21
Comparable sales - owned + licensed Up 11.5% compared to 2Q19; 18.6pt improvement to 1Q21
Digital Penetration 32%
2Q21
Comparable sales - owned + licensed Up 2.2% compared to 2Q19; 17.6pt improvement to 1Q21
Digital Penetration 20%
14Digital Channel: 2Q21 Highlights
Performance Metrics
2Q21 (unless otherwise noted)
Sales Up 45% to 2Q19
Penetration 32% of net sales
Sales from Mobile Devices* 61% of digital demand sales
Average Number of Visits* 519 million, up 22% to LLY
Conversion Rate* 4.0%, up 10% to LLY
Vendor Direct % of Digital Sales* 17%
Digital Sales Fulfilled by Stores* 24%
*: Figures above reflect macys.com only.
15Macy’s Merchandising Update
Met and flexed with customer demand supported by wide assortment of
categories, products and brands at price points ranging from value to luxury
Top Performing Categories
• Continued strength in pandemic-driven products and categories
• Loungewear, fragrances, fine jewelry, textiles, housewares
• Dormant categories showing renewed life
• Dresses, denim, luggage
Attracting Under-40 Customer
• New brands and categories
• And Now This
• Customer responding well; seeing full-price sell-throughs
• Connecting with millennial parents
• One stop shop for parenting needs
• Back-to-school, back-to-work, holiday and gifting through the year
• Toys ‘R’ Us
• Exclusive partnership designed to help fully realize the opportunity in the toy
category
16Star Rewards Loyalty Members
Platinum Gold Silver Bronze
Macy’s 2Q21 and
Sales* $1.4B $707M $476M $671M
1H21 Customer
Profile Active Customers 2.6M 2.9M 3.4M 3.7M
Average Spend per Customer $532 $247 $141 $177
Average Visits 4.7 2.7 1.7 1.8
Average Spend per Visit $113 $92 $85 $99
Under 40** 19% 20% 19% 26%
Diverse 50% 49% 42% 56%
• Platinum, Gold and Silver Star Rewards members re-engage, with the average
customer spend up 15% compared to second quarter 2019 and a 5-percentage point
trend improvement from first quarter 2021.
• Bronze segment, youngest and most diverse loyalty tier continued to grow,
adding approximately 2 million members.
Replace Image
• Approximately 5 million new customers came into the brand, a robust 30%
improvement compared to 2Q19
• 41% of new customers came through the digital channel in 2Q21
*Comparable owned-plus-licensed total sales 17
**Represents a year-to-date basisEnd of Q2 2021 End of Q1 2021
Macy’s Stores Opened in 2Q21 6 -
Backstage Total Store Count 262 256
Highlights Stores within Stores 255 250
Freestanding 7 6
FY2021 Store Count Goal = 270
• Comparable sales for Backstage store-within-store locations open more than one
year continue to outperform full line Macy’s stores by 28 points
• Freestanding Backstage locations delivered positive comparable sales
• 7 Stores within stores and one freestanding to open in 2H21
• Customers under-40 made up about 26% of Backstage store-within-store customers,
slightly higher than Macy’s full-price customers
• Significant cross-shopping*
• 18% of cross shoppers represent 33% of sales in SWS
• Customers who shopped two or more times represent half the sales in SWS
• Cross shoppers made 2 additional visits vs. Full Line Only customers
• Continuing to aggressively grow Backstage
• Expanding in strategic locations that advance the Macy’s strategy and optimizes
its brand
18
*Represented from a trailing 12-month basisBloomingdale’s and Bluemercury Highlights
• Strong performance both in-store and online drove positive comp sales growth
• Comparable sales on an owned-plus-licensed basis were up 11.5%
• 18.6-point sequential trend improvement compared to 1Q21
• Improvement across all categories with strong double-digit growth in men’s
and women’s shoes, sunglasses, handbags, fine jewelry, fragrances and
home.
• Benefited from an increase in full price sell-throughs as a result of leaner
inventory and strategic investments in merchandise
• Continued to see sequential sales improvement quarter over quarter
• Comparable owned-plus-licensed sales up 2.2% versus 2Q19
• Saw strength in treatment, home fragrance, with growth in private brands M-61
Skincare and Lune and Aster Cosmetics
• Strong performance in skincare while color makeup improved but soft compared
19
to 2019Expectations
202021 Expectations
2021 EXPECTATIONS 2021 EXPECTATIONS
Revised as of 5/18/2021
$23,550 million to $23,950 million $21,725 million to $22,225 million
Net sales
Increase between ~ 36% and 38% compared to 2020 Increase between 25% and 28% compared to 2020
Digital Between $8,350 million and $8,450 million Approximately $8 billion
Credit card revenues, net Approximately 3.1% of net sales Approximately 3% of net sales
Gross margin rate Increase by up to 9 percentage points from 2020 Increase by up to 8 percentage points from 2020
Improve up to 250 basis points compared to 2019 Improve approximately 135 basis points compared
SG&A expense rate
levels to 2019 levels
Gains on sale of real estate (ASG) Between $60 million and $90 million Between $60 million and $90 million
Benefit plan income Approximately $65 million Approximately $60 million
Depreciation and amortization Approximately $900 million Approximately $900 million
Adjusted EBITDA Margin Approximately 11% to 11.5% Approximately 9% to 9.5%
Interest expense, net Approximately $270 million Approximately $320 million
Adjusted tax rate Approximately 24% Approximately 25%
Diluted shares outstanding* Approximately 320 million Approximately 320 million
Adjusted diluted EPS Between $3.41 and $3.75 Between $1.71 and $2.12
Capital Expenditures Approximately $650 million Approximately $650 million
21
*Diluted shares outstanding do not factor in share repurchases.Back Half 2021 Expectations (Revised 8/19/21)
3Q21 EXPECTATIONS
Net sales $5,040 million to $5,190 million
Adjusted diluted EPS Approximately $0.17 to $0.26
• Solid back half of 2021 expected with positive comparable sales vs. 2019 and 2020 in both quarters
• Expect 3Q21 and 4Q21 comparable sales, at the high-end of the guidance range, to perform in line
with May and July results
• Back half expectations include continuing contribution from Polaris initiatives as well as estimated impacts
from supply chain constraints, tight labor market, elevated levels of holiday shipping surcharges and
potential unforeseen impacts from COVID variants
• They do not contemplate a return to government-mandated shutdowns, should they prove necessary
• Targeting a normalized cash balance of approximately $1 billion
22Other Expectations in 2022 and Beyond
• Increasing long-term Adjusted EBITDA margin target to remain in the low-double digits – beginning
next year
• Over the next couple of years, expect capital expenditures to increase to approximately $1 billion,
annually
• Reopening of U.S. to international tourists and return to a more normalized work environment are
expected to be tailwinds once they occur
23Macy’s, Inc. Store Count - As of July 31, 2021
End of 1Q21 End of 2Q21 Change in Store Locations from 1Q21
Boxes Store Locations Boxes Store Locations
Macy's Flagships 16 11 16 11
Macy's Magnets 429 384 429 384
Macy's Core 445 395 445 395
Macy's Neighborhood 63 58 62 57 -1
Macy's Furniture 52 47 52 47
Macy's Furniture Clearance 2 2 2 2
Freestanding Backstage 6 6 7 7 +1
Macy's Small Format 2 2 2 2
Stores converted to Fullfilment Centers 2 2 2 2
Total Macy's 572 512 572 512 0
Bloomingdale's Dept. Stores 35 33 35 33
Bloomingdale's Furniture/Other 1 1 1 1
Bloomingdale's The Outlet 19 19 20 20 +1
Total Bloomingdale's 55 53 56 54 1
Bluemercury 160 160 160 160
Total Macy's, Inc. 787 725 788 726 1
• Excluded in the count above is 255 Macy’s Store Within Store Backstage locations located within Macy’s stores
Notes:
* A and B malls included in the above store types are flagship of 11, magnets of 344, core of 358 and Neighborhood of 27.
(1) Using store locations combines multi-box stores into a single location, providing a more accurate count of the store fleet 24Appendix
25Reconciliation of GAAP to Non-GAAP Financial
Measures
The company reports its financial results in accordance with U.S. generally accepted accounting principles (GAAP). However, management believes that certain non-
GAAP financial measures provide users of the company's financial information with additional useful information in evaluating operating performance. Management
believes that providing supplemental changes in comparable sales on an owned plus licensed basis, which includes adjusting for the impact of comparable sales of
departments licensed to third parties, assists in evaluating the company's ability to generate sales growth, whether through owned businesses or departments
licensed to third parties, and in evaluating the impact of changes in the manner in which certain departments are operated. Earnings (loss) before interest, taxes,
depreciation and amortization (EBITDA) is a non-GAAP financial measure which the company believes provides meaningful information about its operational
efficiency by excluding the impact of changes in tax law and structure, debt levels and capital investment. In addition, management believes that excluding certain
items from EBITDA, net income (loss) and diluted earnings (loss) per share that are not associated with the company’s core operations and that may vary
substantially in frequency and magnitude from period-to-period provides useful supplemental measures that assist in evaluating the company's ability to generate
earnings and to more readily compare these metrics between past and future periods.
The company does not provide reconciliations of the forward-looking non-GAAP measures of adjusted EBITDA and diluted earnings per share to the most directly
comparable forward-looking GAAP measures because the timing and amount of excluded items are unreasonably difficult to fully and accurately estimate. For the
same reasons, the company is unable to address the probable significance of the unavailable information, which could be material to future results.
Non-GAAP financial measures should be viewed as supplementing, and not as an alternative or substitute for, the company's financial results prepared in accordance
with GAAP. Certain of the items that may be excluded or included in non-GAAP financial measures may be significant items that could impact the company's financial
position, results of operations or cash flows and should therefore be considered in assessing the company's actual and future financial condition and
performance. Additionally, the amounts received by the company on account of sales of departments licensed to third parties are limited to commissions received on
such sales. The methods used by the company to calculate its non-GAAP financial measures may differ significantly from methods used by other companies to
compute similar measures. As a result, any non-GAAP financial measures presented herein may not be comparable to similar measures provided by other
companies.
26Changes in Comparable Sales – Macy's Inc.
July 31, 2021 versus July 31, 2021 versus
13 weeks ended 13 weeks ended
Macy’s, Inc. August 1, 2020 August 3, 2019
Increase in comparable sales on an owned basis (Note 1) 61.2% 5.8%
Impact of growth in comparable sales of departments licensed to third parties (Note 2) 1.0% 0.1%
Increase in comparable sales on an owned plus licensed basis 62.2% 5.9%
July 31, 2021 versus July 31, 2021 versus
26 weeks ended 26 weeks ended
Macy’s, Inc. August 1, 2020 August 3, 2019
Increase (decrease) in comparable sales on an owned basis (Note 1) 61.8% (2.4%)
Impact of growth in comparable sales of departments licensed to third parties (Note 2) 1.2% 0.3%
Increase (decrease) in comparable sales on an owned plus licensed basis 63.0% (2.1%)
Notes:
1. Represents the period-to-period percentage change in net sales from stores in operation during the 13 and 26 weeks ended July 31, 2021 and the 13 and 26 weeks ended August 1, 2020 and
August 3, 2019, respectively. Such calculation includes all digital sales and excludes commissions from departments licensed to third parties. Stores impacted by a natural disaster or
undergoing significant expansion or shrinkage remain in the comparable sales calculation unless the store, or material portion of the store, is closed for a significant period of time. No stores have
been excluded as a result of the COVID-19 pandemic. Definitions and calculations of comparable sales may differ among companies in the retail industry.
2. Represents the impact of including the sales of departments licensed to third parties occurring in stores in operation throughout the year presented and the immediately preceding year and all
online sales in the calculation of comparable sales. The company licenses third parties to operate certain departments in its stores and online and receives commissions from these third parties
based on a percentage of their net sales. In its financial statements prepared in conformity with GAAP, the company includes these commissions (rather than sales of the departments licensed
to third parties) in its net sales. The company does not, however, include any amounts in respect of licensed department sales (or any commissions earned on such sales) in its comparable
sales in accordance with GAAP (i.e., on an owned basis). The amounts of commissions earned on sales of departments licensed to third parties are not material to its net sales for the periods 27
presented.Changes in Comparable Sales- Macy’s brand,
Bloomingdale’s brand and Bluemercury brand
Versus 13 weeks ended
Macy’s August 3, 2019
Increase in comparable sales on an owned basis (Note 1) 5.5%
Impact of growth in comparable sales of departments licensed to third parties (Note 2) (0.3%)
Increase in comparable sales on an owned plus licensed basis 5.2%
Versus 13 weeks ended
Bloomingdale’s August 3, 2019
Increase in comparable sales on an owned basis (Note 1) 8.5%
Impact of growth in comparable sales of departments licensed to third parties (Note 2) 3.0%
Increase in comparable sales on an owned plus licensed basis 11.5%
Versus 13 weeks ended
Bluemercury August 3, 2019
Increase in comparable sales on an owned basis (Note 1) 2.2%
Impact of growth in comparable sales of departments licensed to third parties (Note 2) 0.0%
Increase in comparable sales on an owned plus licensed basis 2.2%
28Earnings (Loss) Before Interest, Taxes, Depreciation, and
Amortization Excluding Certain Items
13 weeks ended 13 weeks ended 13 weeks ended
In millions July 31, 2021 August 1, 2020 August 3, 2019
Most comparable GAAP measure:
Net income (loss) $345 $(431) $86
Net sales 5,647 3,559 5,546
Net income (loss) as a percent to net sales 6.1% (12.1%) 1.6%
Non-GAAP measure:
Net income (loss) 345 (431) 86
Interest expense, net 80 69 47
Losses on early retirement of debt 3 - -
Financing costs - 3 -
Federal, state and local income tax expense (benefit) 105 (298) 30
Depreciation and amortization 220 235 237
Earnings (loss) before interest, taxes, depreciation and amortization 753 (422) 400
Impairment, restructuring and other costs 2 242 2
Settlement charges 81 38 -
Adjusted EBITDA 836 (142) 402
Adjusted EBITDA as a percent to net sales 14.8% (4.0%) 7.2%
29Earnings (Loss) Before Interest, Taxes, Depreciation,
and Amortization Excluding Certain Items
26 weeks ended 26 weeks ended 26 weeks ended
In million July 31, 2021 August 1, 2020 August 3, 2019
Most comparable GAAP measure:
Net income (loss) $448 $(4,012) $223
Net sales 10,353 6,576 11,050
Net income (loss) as a percent to net sales 4.3% (61.0%) 2.0%
Non-GAAP measure:
Net income (loss) 448 (4,012) 223
Interest expense, net 159 117 94
Losses on early retirement of debt 14 - -
Financing costs - 3 -
Federal, state and local income tax expense (benefit) 142 (874) 57
Depreciation and amortization 444 472 472
Earnings (loss) before interest, taxes, depreciation and amortization 1,207 (4,294) 846
Impairment, restructuring and other costs 21 3,426 3
Settlement charges 81 38 -
Adjusted EBITDA 1,309 (830) 849
Adjusted EBITDA as a percent to net sales 12.6% (12.6%) 7.7%
30Net Income (Loss), Excluding Certain Items and Asset Sale Gains
13 weeks ended 13 weeks ended 13 weeks ended
In millions July 31, 2021 August 1, 2020 August 3, 2019
Most comparable GAAP measure:
Net income (loss) $345 $(431) $86
Non-GAAP measure:
Net income (loss) $345 $(431) $86
Impairment, restructuring and other costs 2 242 2
Settlement charges 81 38 -
Losses on early retirement of debt 3 - -
Financing costs - 3 -
Income tax impact of certain items identified above (20) (103) -
As adjusted to exclude certain item above 411 (251) 88
Gains on sale of real estate (6) - (7)
Income tax impact of gains on sale of real estate 2 - 2
As adjusted to exclude gains on sale of real estate and other certain items
identified above $407 $(251) $83
31Net Income (Loss), Excluding Certain Items and Asset Sale Gains
26 weeks ended 26 weeks ended 26 weeks ended
In millions July 31, 2021 August 1, 2020 August 3, 2019
Most comparable GAAP measure:
Net income (loss) $448 $(4,012) $223
Non-GAAP measure:
Net income (loss) $448 $(4,012) $223
Impairment, restructuring and other costs 21 3,426 3
Settlement charges 81 38 -
Losses on early retirement of debt 14 - -
Financing costs - 3 -
Income tax impact of certain items identified above (27) (336) (1)
As adjusted to exclude certain item above 537 (881) 225
Gains on sale of real estate (12) (16) (49)
Income tax impact of gains on sale of real estate 3 4 13
As adjusted to exclude gains on sale of real estate and other certain items
identified above $528 $(893) $189
32Diluted Earnings (Loss) Per Share, Excluding Certain
Items and Asset Sale Gains
13 weeks ended 13 weeks ended 13 weeks ended
July 31, 2021 August 1, 2020 August 3, 2019
Most comparable GAAP measure:
Diluted earnings (loss) per share $1.08 $(1.39) $0.28
Non-GAAP measure:
Diluted earnings (loss) per share $1.08 $(1.39) $0.28
Impairment, restructuring and other costs 0.01 0.78 -
Settlement charges 0.25 0.12 -
Losses on early retirement of debt 0.01 - -
Financing costs - 0.01 -
Income tax impact of certain items identified above (0.06) (0.33) -
As adjusted to exclude certain item above 1.29 (0.81) 0.28
Gains on sale of real estate (0.02) - (0.02)
Income tax impact of gains on sale of real estate 0.01 - 0.01
As adjusted to exclude gains on sale of real estate and other
certain items identified above $1.28 $(0.81) $0.27
33Diluted Earnings (Loss) Per Share, Excluding Certain
Items and Asset Sale Gains
26 weeks ended 26 weeks ended 26 weeks ended
July 31, 2021 August 1, 2020 August 3, 2019
Most comparable GAAP measure:
Diluted earnings (loss) per share $1.41 $(12.91) $0.71
Non-GAAP measure:
Diluted earnings (loss) per share $1.41 $(12.91) $0.71
Impairment, restructuring and other costs 0.07 11.02 0.01
Settlement charges 0.25 0.12 -
Losses on early retirement of debt 0.04 - -
Financing costs - 0.01 -
Income tax impact of certain items identified above (0.09) (1.07) -
As adjusted to exclude certain item above 1.68 (2.83) 0.72
Gains on sale of real estate (0.04) (0.05) (0.15)
Income tax impact of gains on sale of real estate 0.02 0.01 0.04
As adjusted to exclude gains on sale of real estate and other
certain items identified above $1.66 $(2.87) $0.61
34Free Cash Flow
26 weeks ended 26 weeks ended 26 weeks ended
In millions July 31, 2021 August 1, 2020 August 3, 2019
Net cash provided (used) by operating activities $965 $(7) $350
Purchase of property and equipment (142) (228) (378)
Capitalized software (88) (61) (123)
Disposition of property and equipment 34 31 59
Free Cash Flow $769 $(265) $(92)
35You can also read