Investor Presentation - Innovation Through Simulation NASDAQ: ANSS - Investor Relations - ANSYS
←
→
Page content transcription
If your browser does not render page correctly, please read the page content below
Innovation Through Simulation

                                           Investor Presentation
                                               Second Quarter 2018

    NASDAQ: ANSS

1    © 2018 ANSYS, Inc.   August 7, 2018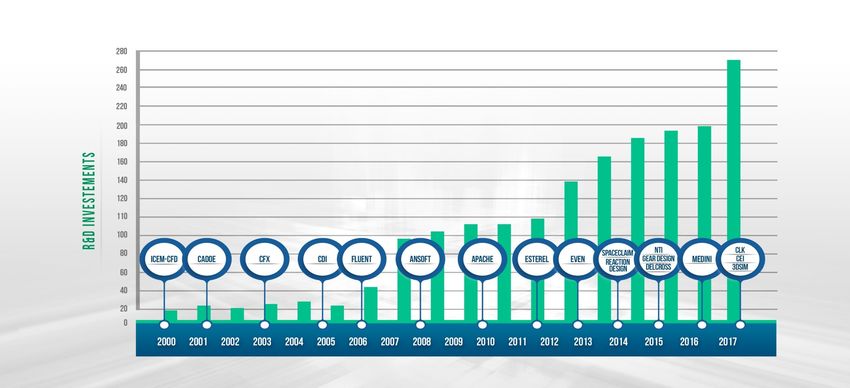
Safe Harbor
Certain statements contained in this presentation regarding matters that are not historical facts, including, but not limited to, statements regarding our projections for
the third quarter of 2018 and fiscal year 2018 (both GAAP and non-GAAP to exclude acquisition accounting adjustments to deferred revenue, acquisition-related
amortization, stock-based compensation expense and acquisition-related transaction costs with related tax impacts); statements regarding management's use of non-
GAAP financial measures; statements regarding investing in the business; statements regarding the Tax Cuts and Jobs Act; and statements regarding the intent to
integrate ANSYS Discovery Live within PTC's Creo 3D CAD software are "forward-looking" statements (as defined in the Private Securities Litigation Reform Act of
1995). Because such statements are subject to risks and uncertainties, actual results may differ materially from those expressed or implied by such forward-looking
statements. All forward-looking statements in this press release are subject to risks and uncertainties, including, but not limited to, the risk that adverse conditions in
the global and domestic markets will significantly affect ANSYS’ customers’ ability to purchase products from the Company at the same level as prior periods or to pay
for the Company’s products and services; the risk that declines in ANSYS’ customers’ business may lengthen customer sales cycles; the risk of declines in the
economy of one or more of ANSYS’ primary geographic regions; the risk that ANSYS’ revenues and operating results will be adversely affected by changes in currency
exchange rates or economic declines in any of the countries in which ANSYS conducts transactions; the risk that the assumptions underlying ANSYS' anticipated
revenues and expenditures will change or prove inaccurate; the risk that ANSYS has overestimated its ability to maintain growth and profitability, and control costs;
uncertainties regarding the demand for ANSYS' products and services in future periods; uncertainties regarding customer acceptance of new products; the risk of
ANSYS’ products' future compliance with industry quality standards and its potential impact on the Company’s financial results; the risk that the Company may need to
change its pricing models due to competition and its potential impact on the Company’s financial results; the risk that ANSYS' operating results will be adversely
affected by possible delays in developing, completing or shipping new or enhanced products; the risk that enhancements to the Company's products or products
acquired in acquisitions may not produce anticipated sales; the risk that the Company may not be able to recruit and retain key executives and technical personnel; the
risk that third parties may misappropriate the Company’s proprietary technology or develop similar technology independently; the risk of unauthorized access to and
distribution of the Company’s source code; the risk of the Company’s implementation of its new IT systems; the risk of difficulties in the relationship with ANSYS’
independent regional channel partners; the risk of ANSYS’ reliance on perpetual licenses and the result that any change in customer licensing behavior may have on the
Company’s financial results; the risk that ANSYS may not achieve the anticipated benefits of its acquisitions or that the integration of the acquired technologies or
products with the Company’s existing product lines may not be successful; the risk of periodic reorganizations and changes within ANSYS’ sales organization; the risk
of industry consolidation and the impact it may have on customer purchasing decisions; and other factors that are detailed from time to time in reports filed by ANSYS,
Inc. with the Securities and Exchange Commission, including ANSYS, Inc.'s 2017 Annual Report on Form 10-K. We undertake no obligation to publicly update or revise
any forward-looking statements, whether changes occur as a result of new information or future events, after the date they were made.

  2       © 2018 ANSYS, Inc.      August 7, 2018
ANSYS is the simulation leader

FOCUSED                                       TRUSTED                      More than
                                                                                                 PROVEN                                GLOBAL
This is all we do.                                                         45,000                 Member of the                              3,200+
Leading product technologies in all
physics areas. Largest development
                                                 97100
                                                  of the
                                                                           customers worldwide
                                                                                                  prestigious
                                                                                                                                 500
                                                           industrials
                                                                         ISO 9001-2015
team focused on simulation
                                                                            CERTIFIED            $15B+ market capitalization

LARGEST                                       INDEPENDENT                                        COMMITTED                             DRIVEN
3x     the size of our nearest
competitor (revenue)
                                                 Long-term financial stability
                                                                  CAD agnostic
                                                                                                 Overall customer satisfaction

                                                                                                              87.8%
                                                                                                 globally is at
                                                                                                                                       Helping customers address new
                                                                                                                                       market challenges: digital
                                                                                                                                       exploration, additive
                                                                                                                 in 2017               manufacturing and digital twins

    3       © 2018 ANSYS, Inc.        August 7, 2018
World-class companies leveraging our platform

4   © 2018 ANSYS, Inc.   August 7, 2018
Key 2017 achievements

     ➢ Reported $1.1 billion in revenue at double-digit growth
     ➢ Added to the S&P 500 Index
     ➢ Maintained industry-leading margins for sector and software vertical
     ➢ Provided long-term financial objectives
     ➢ Executed on capital allocation strategy through acquisitions and share
       repurchases
     ➢ Established our Pervasive Simulation strategy
     ➢ Outlined our next generation technology roadmap

 5     © 2018 ANSYS, Inc.   August 7, 2018
(Non-GAAP) – as of June 30, 2018
                                                 Q2 2018   Q2 YTD 2018
                                                 $299M       $584M
                   Revenue

                                                 45.5%       45.4%
                   Operating Margin

                   Tax rate                      22.0%       21.2%

                   EPS                           $1.24       $2.46

 ASC 605

 6         © 2018 ANSYS, Inc.   August 7, 2018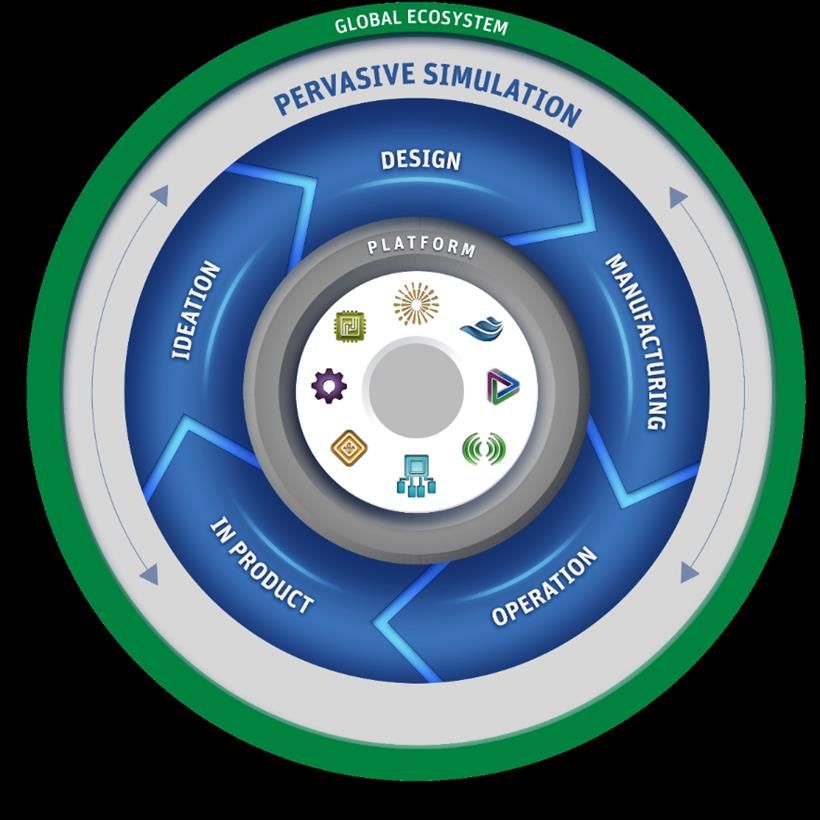
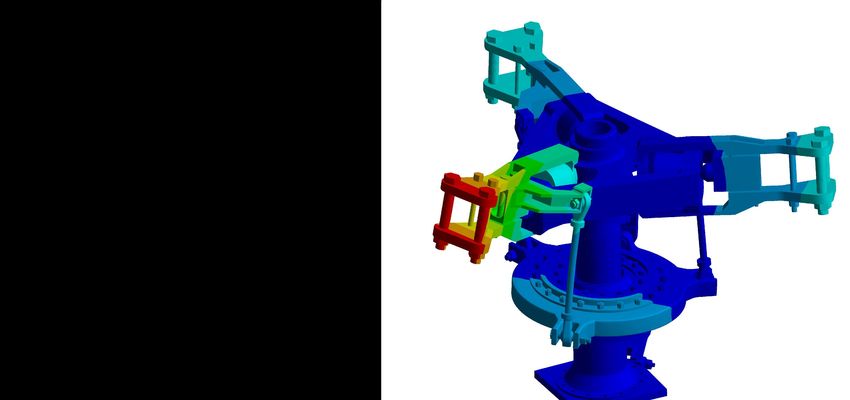
ANSYS offers the only true simulation platform with best-of-breed simulation
across all major physics

                          Market Leader Across Individual Physics with Industry-Leading Platform

                                                                      Semiconductor     Mission-critical
    Structures                   Fluids      Electromagnetics                                              Optical
                                                                         Power        Embedded Software

                                                           Platform

7    © 2018 ANSYS, Inc.    August 7, 2018
OUR MISSION
EMPOWER OUR CUSTOMERS
TO DESIGN AND DELIVER
TRANSFORMATIONAL
PRODUCTS

8   © 2018 ANSYS, Inc.   August 7, 2018
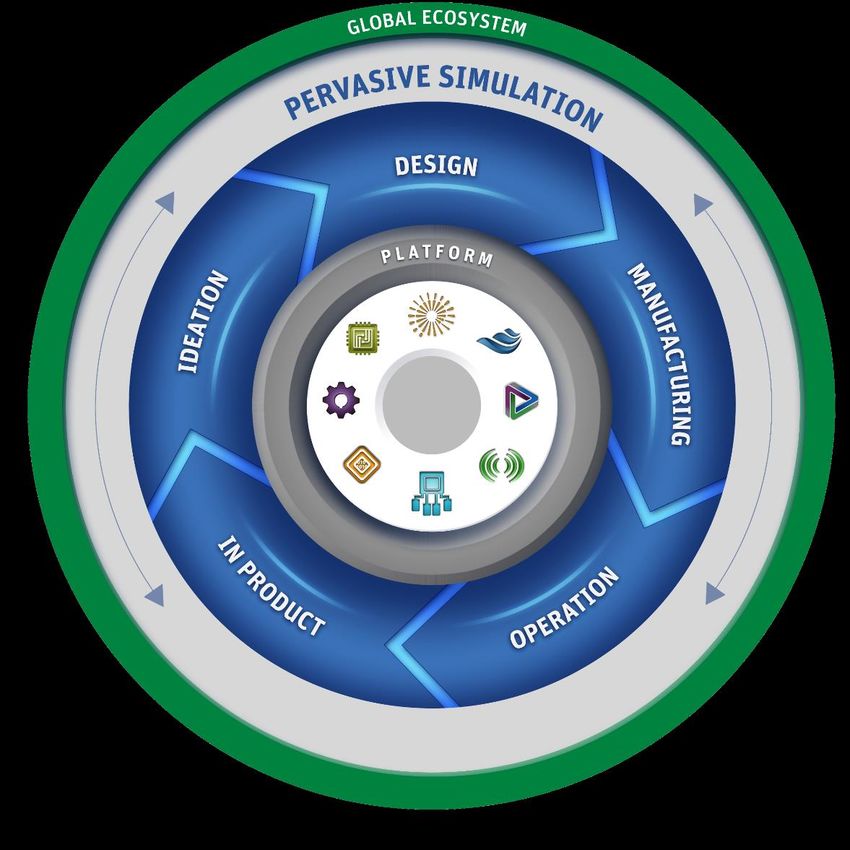
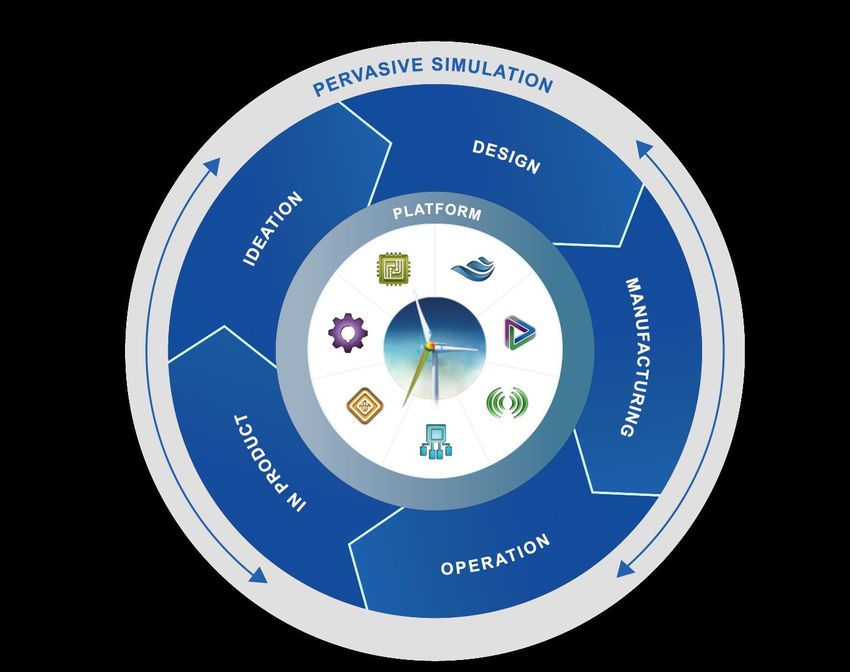
OUR LONG-TERM VISION
IDEATION                                          PERVASIVE SIMULATION                           DESIGN
                                                  … integration across all physics on a single
                                                  platform
                                                                                                 Reduce development time 9X while
80% of costs locked in early in the
                                                                                                 warranty costs 89% more likely to
design phase
                                                                                                 decrease

                                                                                                 MANUFACTURING

                                                                                                 Reduce weight of part by 25%
                                                                                                 through topology optimization and
                                                                                                 additive manufacturing

  IN PRODUCT
                                                                                                 OPERATIONS
  Reduce time needed to validate
  autonomous vehicles from 10,000                                                                Increased performance with 10-20%
  years to 2-3 years                                                                             reduction in maintenance costs
                                                                                                 Extend asset life; increase efficiency
                                                                                                 of assets

   9      © 2018 ANSYS, Inc.     August 7, 2018
Our key growth initiatives

                            ➢ Low penetration of    1. Increase
                              engineering           simulation
                              simulation usage      intensity

                           2. New applications                    3. Expand the product
                                                                  lifecycle

                            ➢   Medical                           ➢   Design phase
                            ➢   Additive manufacturing            ➢   Manufacturing phase
                            ➢   Autonomous vehicles               ➢   Operations – digital twins
                            ➢   Consumer                          ➢   Digital development

 10   © 2018 ANSYS, Inc.        August 7, 2018
Our customers face increased pressure to deliver on the classic challenges
Time-to-market Cycle Times New Product Rollouts
30% 2 years 66%
11 © 2018 ANSYS, Inc. August 7, 2018The digital revolution is making the problem even harder
Denser integrated circuits Connected capabilities
deliver
Chips speed, energy
are ever more complex and sophisticated increase the value
Every product will of
soon be connected (and smart)
efficiency and lower cost products to consumers
Additive manufacturing
Electronics are stimulating
Electronics are everywhere marketmanufacturing
Additive projected to is transforming manufacturing
innovation in the auto industry
exceed $25B by 2021
Composite materials increase
Products are
aircraft efficiency andmade of increasingly
generate 20B+The Internet ofdevices
IoT-enabled Things is changing the way
products are delivered and maintained
significant complex composite materials
cost savings by 2020
12 © 2018 ANSYS, Inc. August 7, 2018SIMULATION IS THE ANSWER 13 © 2018 ANSYS, Inc. August 7, 2018
A time of profound industry transformation
              Greatest value creation               Product complexity is             Engineering simulation
      1                                         2                             3
              since the industrial revolution       increasing dramatically           critical to the products of
                                                                                      tomorrow
                                                                                  Top 3 technologies that will have the
                                                                                  biggest impact on product design and
                                                                                  development over the next 5 years?

                                                                                   1. Additive Manufacturing
                                                                                   2. Engineering Simulation
                                                                                   3. Advanced Materials

                                                                                  SIMULATION vs NO SIMULATION
                                                                                  Simulated Environments Experience:

      +$11 trillion potential by 2025

 14       © 2018 ANSYS, Inc.   August 7, 2018
Simulation enables product managers to…
• Drive INNOVATION • Lower CYCLE TIME • Increase QUALITY
• Manage COMPLEXITY • Reduce COSTS • Eliminate RISK
…which is driving simulation usage
Top 3 responses to: Which of the following are driving your company to use more simulation?
Complexity of products has increased 64%
Products to market faster 61%
Quality of products has increased 45%
0 10 20 30 40 50 60 70 80 90 100%
% of respondents mentioned
Source: ANSYS customer survey April 2017 (N = 582)
15 © 2018 ANSYS, Inc. August 7, 2018WHERE DOES SIMULATION GO FROM HERE? 16 © 2018 ANSYS, Inc. August 7, 2018
Our ongoing financial commitment to deliver value

               in millions

 17   © 2018 ANSYS, Inc.     August 7, 2018
We are expanding our technology to enable next-generation use cases
ADDITIVE MANUFACTURING
DIGITAL EXPLORATION
DIGITAL TWIN / IOT
18 © 2018 ANSYS, Inc. August 7, 2018Recent acquisitions and new product announcements
• Additive manufacturing
• Optical – 5th physics area
• Applications in AV, aero and electronics
• Discovery family
• Democratize simulation within
design communities
19 © 2018 ANSYS, Inc. August 7, 2018ANSYS Discovery Live
A new paradigm in 3D design exploration, bringing real
time simulation into the hands of every engineer.
Features:
• Speed – Instantaneous simulation experience
• Ease of use – Run 1st simulation in minutes.
• Geometry Enabled – Edit geometry from any CAD source.
• Interactive – Edit physics inputs, geometry, or alter display
characteristics, and simulations update in real-time.
Technology
• Massively parallel solvers and post-processing running on
GPUs
• Fast, flexible, CAD-neutral geometry platform (SpaceClaim)
• Volumetric simulation approach
Benefits:
• Quickly create & test multiple design variations
• Minimal learning curve
• Negligible setup time (no meshing/time step) choices
• Robust - no failed simulations
• Scales with future compute advances
20 © 2018 ANSYS, Inc. August 7, 2018Expanding the ANSYS ecosystem through partnerships
• SAP incorporating ANSYS Twin Builder in cloud-based Predictive Engineering
Insights
• Replace time-based maintenance of industrial assets with predictive and
prescriptive maintenance
• Will help sell flagship products to R&D groups
• PTC embedding ANSYS Discovery Live and AIM within Creo for CAD-embedded
simulation
• Improve ideation and enable designers to develop better, lower-cost products
• Will create opportunities to sell flagship products to experts / analysts
• Synopsys integrating ANSYS RedHawk with Synopsys IC Compiler for earlier
signoff accuracy
• Accelerate time to market of next generation of high-performance computing,
mobile and automotive products
21 © 2018 ANSYS, Inc. August 7, 2018The cloud opportunity for simulation
Product complexity, and need for agility and collaboration driving cloud adoption
REDUCED MORE ACCURATE BETTER DESIGN NEW MARKETS &
TURNAROUD RESULTS TRADEOFFS APPLICATIONS
ENHANCE ENGINEERING MAKE MORE ACCURATE INNOVATE FASTER BY EXPAND SIMULATION
PRODUCTIVITY BY REMOVING DESIGN DECISIONS BY ENABLING USERS TO THROUGHOUT PRODUCT
HARDWARE RESOURCE INCORPORATING FINER CONSIDER MORE DESIGN LIFECYCLE AND DEPLOY FOR
CONSTRAINTS AND MESHES, HIGHER FIDELITY IDEAS AND SHARE RESULTS NON-TRADITIONAL
INCREASING SIMULATION PHYSICS AND COMPLETE WITH MORE ENGINEERS APPLICATIONS AND USERS
THROUGHPUT SYSTEMS
22 © 2018 ANSYS, Inc. August 7, 2018Our go-to-market strategy
➢ Top 25 ANSYS customers
➢ Dedicated experts to engage in consultative selling
Enterprise
Accounts
➢ 150-200 ANSYS customers
➢ Replicating model of Top 25
Strategic Accounts
➢ 10-20% of sales
➢ Clearly defined resources between
Territory Accounts strategic and territory accounts
➢ 24% of sales
Channel Accounts ➢ CustomersIncreasingly strong financial foundation
➢ Crossed the $1B revenue threshold in 2017
➢ Diversified customer base and revenue streams
➢ High rate of recurring revenue
➢ Continuing to build deferred revenue and backlog
➢ Strong balance sheet
➢ Industry leading margins
➢ Generating strong business momentum
24 © 2018 ANSYS, Inc. August 7, 2018Diverse revenue sources
Non-GAAP Revenue (ASC 605) By Segment Non-GAAP Revenue (ASC 605) as a % of Total
$1,098
$941 $944 $989
$379
$340 34% 34% 34% 35% 35%
$320 $317
$ in millions
$584
$248
$239 $228 26% 25% 23% 23% 20%
$248 $204
$115
$395 $441 37% 39% 40% 40% 42%
$348 $365
$247
$25 $23 $26 $30 $18 3% 3% 3% 3% 3%
2014 2015 2016 2017 Q2 YTD 2018 2014 2015 2016 2017 Q2 YTD 2018
Service Maintenance Perpetual License Lease License Service Maintenance Perpetual License Lease License
ASC 605
25 © 2018 ANSYS, Inc. August 7, 2018Diverse geography mix
FY 2017 Revenues By Geography Q2 YTD 2018 Revenues By Geography
Other Other
North
Asia-Pacific Asia-Pacific
America North
20% 16%
39% America
41%
Japan
Japan
12%
12%
Other Other
Europe UK Germany Europe UK Germany
16% 3% 10% 17% 3% 11%
26 © 2018 ANSYS, Inc. August 7, 2018Diverse industry mix
Trailing Twelve Months Sales By Industry – Q2 2018
Construction Bio-Med
Academic Consumer Products
2% 2%
4% 1%
Materials &
Chemicals
6%
Energy
High Tech
9%
31%
Industrial
Equipment
12%
Aerospace &
Defense
17%
Automotive
16%
27 © 2018 ANSYS, Inc. August 7, 2018High recurring revenue
Q2 2018 Revenue Q2 2018
Direct vs. Indirect Recurring vs. New
24% 24%
76% 76%
Direct Indirect Recurring Non-Recurring
28 © 2018 ANSYS, Inc. August 7, 2018Continuing to build deferred revenue and backlog
FY17 Deferred Revenue & Backlog Q2 Y-O-Y Deferred Revenue & Backlog
$770 $816
$638 $656
$ in millions
$ in millions
$468 $504
2014 2015 2016 2017 Q2 2017 Q2 2018
Note: Includes long-term deferred revenue and backlog – ASC 605
29 © 2018 ANSYS, Inc. August 7, 2018Strong Balance Sheet
Q2 2018 (Non-GAAP) – as of June 30, 2018
$696M
Cash & short-term investments
$0M
Debt
Operating cash flows $111M
30 © 2018 ANSYS, Inc. August 7, 2018Industry-leading margins
➢ Our margins remain industry-leading
➢ We are committed to maintaining our industry-leading margins while investing for future
growth
2017 Non-GAAP Operating Margins
50% 46%
40%
30% 26% 24%
23%
20% 16%
10%
0%
-10% -5%
ANSYS Peer 1 Peer 2 Peer 3 Peer 4 Peer 5
ANSYS closest US peers include: Autodesk, Cadence, Dassault, PTC and Synopsys. Altair Engineering does not report non-gaap operating margins. Altair’s reported EBITDA margin was 10% in fiscal year
2017.
31 © 2018 ANSYS, Inc. August 7, 2018We have generated great momentum
ANSYS Constant Currency Revenue Growth
14% 13.0%
12.1%
12% 10.5%
10% 9.1%
8.3%
8% 6.8%
6%
4%
2%
0%
Q1 2017 Q2 2017 Q3 2017 Q4 2017 Q1 2018 Q2 2018
Non-GAAP constant currency – ASC 605
32 © 2018 ANSYS, Inc. August 7, 2018Our long-term targets
Target 2020 Growth & Operating
Scale
Margin Target (non-GAAP)
Infrastructure
Our 2020 target is sustained
double-digit organic revenue
growth…
10%+
…while maintaining financial
discipline and best-in-class
operating margins
43-45%
Partnerships and
Acquisitions
33 © 2018 ANSYS, Inc. August 7, 2018Further opportunity to drive growth will require incremental investment
• People (increased ratio of field engineers to sales reps, channel
expansion and remote sales capability)
Go-to-market • Tools/systems (quote-to-cash, low touch renewals)
• Processes (customer advisory councils, data-driven planning)
• Extending core technology leadership (physics, platform)
Product • Investing in next-generation innovation (digital exploration,
additive manufacturing, digital twin, IoT)
• Tools and systems (CRM, HRIS)
Scale Infrastructure • Expand competencies (FP&A, pricing, M&A)
• New talent acquisition
Partnerships and • Investing to build strategic partnerships
• Customers: GE, Flowserve
Acquisitions • Peers: PTC, Synopsys
34 © 2018 ANSYS, Inc. August 7, 2018Capital allocation priorities
➢ Investment in organic growth of the core business
➢ M&A to enhance growth
– Size not determining factor – proven technology is key
– Experienced talent
– Synergy with customer base and global channel
– Financially accretive within a reasonable timeframe
➢ Stock repurchase
– Commitment to return excess cash to stockholders
35 © 2018 ANSYS, Inc. August 7, 2018Return of excess capital to stockholders
Number of shares purchased % of FCF spent on share repurchase
3.8 3.7 94% 95%
82%
3.0 2.8 65%
millions
50%
1.5 38%
0.8
2013 2014 2015 2016 2017 Q2 YTD 2013 2014 2015 2016 2017 Q2 YTD
2018 2018
Note: Free Cash Flow (FCF) defined as Operating Cash Flow – Capital Expenditures
36 © 2018 ANSYS, Inc. August 7, 2018Q2 2018 (non-GAAP) – as of June 30, 2018 ($ in millions, except EPS)
ASC 606 - $308.9
Revenue ASC 605 - $298.9
ASC 606 - 47.3%
Operating Margin
ASC 605 - 45.5%
Tax rate ASC 606 - 21.3%
ASC 605 - 22.0%
EPS ASC 606 - $1.35
ASC 605 - $1.24
Annual Contract Value (ACV) $293.0
Projected ACV – FY 2018 $1,252.0 - $1,282.0
37 © 2018 ANSYS, Inc. August 7, 2018Q2 YTD 2018 (non-GAAP) – as of June 30, 2018 ($ in millions, except EPS)
ASC 606 - $592.1
Revenue
ASC 605 - $584.1
ASC 606 - 46.2%
Operating Margin
ASC 605 - 45.4%
Tax rate ASC 606 - 20.9%
ASC 605 - 21.2%
EPS ASC 606 - $2.54
ASC 605 - $2.46
Annual Contract Value $586.9
38 © 2018 ANSYS, Inc. August 7, 2018Appendix 39 © 2018 ANSYS, Inc. August 7, 2018
Appendix

                                                                               ANSYS, INC. AND SUBSIDIARIES
                                                                         ASC 606 Reconciliation of Non-GAAP Measures
                                                                                         (Unaudited)
                                                                                                                                  Three Months Ended
                                                                                                                                     June 30, 2018

                                                                                                                                                               Non-GAAP
                 (in thousands, except percentages and per share data)                                            GAAP Results        Adjustments               Results
                 Total revenue                                                                                $       305,913     $          2,948   (1) $       308,861
                 Operating income                                                                                     108,553               37,556   (2)         146,109
                 Operating profit margin                                                                                 35.5 %                                     47.3 %
                 Net income                                                                                   $        92,596     $         23,250   (3) $       115,846
                 Earnings per share – diluted:
                     Earnings per share                                                                       $          1.08                              $        1.35
                     Weighted average shares                                                                           85,986                                     85,986

 (1)   Amount represents the revenue not reported during the period as a result of the acquisition accounting adjustment associated with the accounting for deferred revenue in business
       combinations.

 (2)   Amount represents $20.6 million of stock-based compensation expense, $0.4 million of excess payroll taxes related to stock-based awards, $12.6 million of amortization expense
       associated with intangible assets acquired in business combinations, $1.0 million of transaction expenses related to business combinations and the $2.9 million adjustment to revenue
       as reflected in (1) above.

 (3)   Amount represents the impact of the adjustments to operating income referred to in (2) above, decreased for the related income tax impact of $14.2 million and rabbi trust income of
       $0.1 million.

40      © 2018 ANSYS, Inc.             August 7, 2018
Appendix
ANSYS, INC. AND SUBSIDIARIES
ASC 606 Reconciliation of Non-GAAP Measures
(Unaudited)
Six Months Ended
June 30, 2018
Non-GAAP
(in thousands, except percentages and per share data) GAAP Results Adjustments Results
Total revenue $ 588,786 $ 3,349 (1) $ 592,135
Operating income 203,614 69,907 (2) 273,521
Operating profit margin 34.6 % 46.2 %
Net income $ 176,876 $ 42,034 (3) $ 218,910
Earnings per share – diluted:
Earnings per share $ 2.06 $ 2.54
Weighted average shares 86,069 86,069
(1) Amount represents the revenue not reported during the period as a result of the acquisition accounting adjustment associated with the accounting for
deferred revenue in business combinations.
(2) Amount represents $35.9 million of stock-based compensation expense, $3.5 million of excess payroll taxes related to stock-based awards, $24.8 million of
amortization expense associated with intangible assets acquired in business combinations, $2.3 million of transaction expenses related to business
combinations and the $3.3 million adjustment to revenue as reflected in (1) above.
(3) Amount represents the impact of the adjustments to operating income referred to in (2) above, decreased for the related income tax impact of $29.3 million
and rabbi trust income of $0.1 million, and increased for a measurement-period adjustment related to the Tax Cuts and Jobs Act of $1.4 million.
41 © 2018 ANSYS, Inc. August 7, 2018Appendix
ANSYS, INC. AND SUBSIDIARIES
ASC 605 Reconciliation of Non-GAAP Measures
(Unaudited)
Three Months Ended
June 30, 2018 June 30, 2017
(in thousands, except percentages and per share Non-GAAP Non-GAAP
data) GAAP Results Adjustments Results GAAP Results Adjustments Results
Total revenue $ 294,026 $ 4,860 (1) $ 298,886 $ 263,924 $ 424 (4) $ 264,348
Operating income 96,666 39,468 (2) 136,134 98,394 29,163 (5) 127,557
Operating profit margin 32.9 % 45.5 % 37.3 % 48.3 %
Net income $ 82,412 $ 24,611 (3) $ 107,023 $ 69,730 $ 16,659 (6) $ 86,389
Earnings per share – diluted:
Earnings per share $ 0.96 $ 1.24 $ 0.80 $ 0.99
Weighted average shares 85,986 85,986 86,895 86,895
(1) Amount represents the revenue not reported during the period as a result of the acquisition accounting adjustment associated with the accounting for deferred revenue in business combinations.
(2) Amount represents $20.6 million of stock-based compensation expense, $0.4 million of excess payroll taxes related to stock-based awards, $12.6 million of amortization expense associated with
intangible assets acquired in business combinations, $1.0 million of transaction expenses related to business combinations and the $4.9 million adjustment to revenue as reflected in (1) above.
(3) Amount represents the impact of the adjustments to operating income referred to in (2) above, decreased for the related income tax impact of $14.8 million and rabbi trust income of $0.1 million.
(4) Amount represents the revenue not reported during the period as a result of the acquisition accounting adjustment associated with the accounting for deferred revenue in business combinations.
(5) Amount represents $14.1 million of stock-based compensation expense, $12.1 million of amortization expense associated with intangible assets acquired in business combinations, $2.0 million
of restructuring charges, $0.5 million of transaction expenses related to business combinations and the $0.4 million adjustment to revenue as reflected in (4) above.
(6) Amount represents the impact of the adjustments to operating income referred to in (5) above, adjusted for the related income tax impact of $12.5 million.
42 © 2018 ANSYS, Inc. August 7, 2018Appendix
ANSYS, INC. AND SUBSIDIARIES
ASC 605 Reconciliation of Non-GAAP Measures
(Unaudited)
Six Months Ended
June 30, 2018 June 30, 2017
(in thousands, except percentages and per share Non-GAAP Non-GAAP
data) GAAP Results Adjustments Results GAAP Results Adjustments Results
Total revenue $ 578,595 $ 5,464 (1) $ 584,059 $ 517,329 $ 567 (4) $ 517,896
Operating income 193,423 72,022 (2) 265,445 183,866 61,274 (5) 245,140
Operating profit margin 33.4 % 45.4 % 35.5 % 47.3 %
Net income $ 168,165 $ 43,547 (3) $ 211,712 $ 133,036 $ 30,842 (6) $ 163,878
Earnings per share – diluted:
Earnings per share $ 1.95 $ 2.46 $ 1.53 $ 1.88
Weighted average shares 86,069 86,069 87,060 87,060
(1) Amount represents the revenue not reported during the period as a result of the acquisition accounting adjustment associated with the accounting for deferred revenue in business combinations.
(2) Amount represents $35.9 million of stock-based compensation expense, $3.5 million of excess payroll taxes related to stock-based awards, $24.8 million of amortization expense associated with
intangible assets acquired in business combinations, $2.3 million of transaction expenses related to business combinations and the $5.5 million adjustment to revenue as reflected in (1) above.
(3) Amount represents the impact of the adjustments to operating income referred to in (2) above, decreased for the related income tax impact of $29.9 million and rabbi trust income of $0.1 million, and
increased for a measurement-period adjustment related to the Tax Cuts and Jobs Act of $1.4 million.
(4) Amount represents the revenue not reported during the period as a result of the acquisition accounting adjustment associated with the accounting for deferred revenue in business combinations.
(5) Amount represents $24.6 million of stock-based compensation expense, $24.1 million of amortization expense associated with intangible assets acquired in business combinations, $11.3 million of
restructuring charges, $0.7 million of transaction expenses related to business combinations and the $0.6 million adjustment to revenue as reflected in (4) above.
(6) Amount represents the impact of the adjustments to operating income referred to in (5) above, adjusted for the related income tax impact of $30.4 million.
43 © 2018 ANSYS, Inc. August 7, 2018ASC 606 requires three primary changes relative to current practice
Immediate license Revenue allocation Increased
revenue recognition based on estimated financial statement
(including the license selling price rather disclosures
portion embedded in than Vendor-Specific (including unbilled
a lease) Objective Evidence receivables, and the
(VSOE) expected rollout of
deferred
1 2 revenue and
backlog)
3
44 © 2018 ANSYS, Inc. August 7, 2018Overview of ASC 606 impact
YEAR 1 IMPACT GO-FORWARD IMPACT
• Revenue recognition change will accelerate • Minimal impact on future comparability for
revenue the vast majority of business volume
• Large, multi-year deals will create some • Large, multi-year deals will create some
volatility depending on timing (minority of volatility depending on timing (minority of
the business) the business)
• Modified retrospective implementation • Impact likely to decrease over time as
approach will provide disclosure of results predictability increases
under current rules for the first year
• ACV metric will provide clarity into business
• Cash-flow impact for tax consequences of health
accelerated revenue
• No material change in accounting for sales
• No material change in accounting for sales commissions unless plan structure changes
commissions
45 © 2018 ANSYS, Inc. August 7, 2018New ACV metric will provide increased clarity into business health
NEW ANNUALIZED CONTRACT VALUE (ACV) METRIC
Adjustment to
Bookings that Bookings in Bookings in annualize time-
previous current quarter based license
= + - +/-
occur during
the quarter quarters with with a future and maintenance
current period start date contracts greater
start date than 1 year
• We will continue to report and provide guidance on the same key financial metrics as we do
today (revenue, operating margin, EPS, tax rate, etc.)
• We will begin disclosing fiscal year guidance on operating cash flow, free cash flow and ACV
46 © 2018 ANSYS, Inc. August 7, 2018Annette N. Arribas
Senior Director, Global Investor Relations
2600 ANSYS Drive
Canonsburg, PA 15317 USA
Phone: +1 (724) 820-3700
Email: annette.arribas@ansys.com
Virginea Stuart Gibson
Investor Relations Manager
2600 ANSYS Drive
Canonsburg, PA 15317 USA
Phone: +1 (724) 820-4225
Email: virginea.gibson@ansys.com
NASDAQ: ANSS
47 © 2018 ANSYS, Inc. August 7, 2018You can also read