Albemarle Corporation Fourth Quarter 2020 Earnings - Conference Call/Webcast Thursday, February 18, 2021 9:00am ET - ALB's Investor Relations
←
→
Page content transcription
If your browser does not render page correctly, please read the page content below
Albemarle Corporation
Fourth Quarter 2020 Earnings

Conference Call/Webcast
Thursday, February 18, 2021
9:00am ET

                               1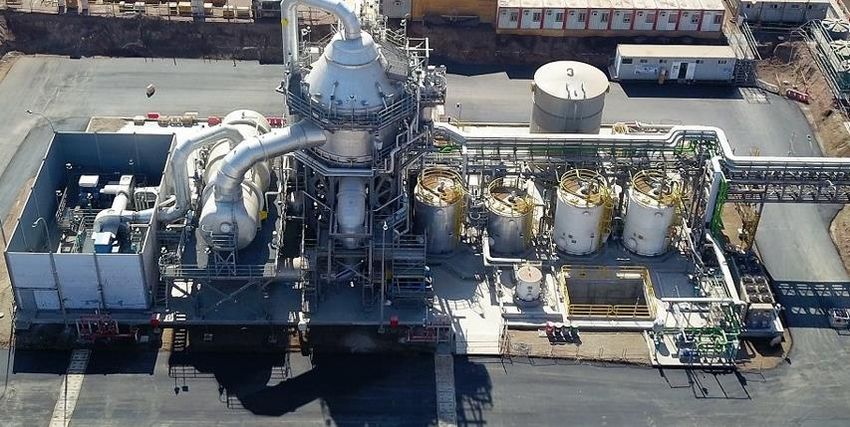
Forward-Looking Statements
Some of the information presented in this presentation, the conference call and discussions that follow, including, without limitation, statements with respect
to product development, market trends, price, expected growth and earnings, demand for our products, capital projects, tax rates, stock repurchases,
dividends, cash flow generation, economic trends, outlook and all other information relating to matters that are not historical facts may constitute forward-
looking statements within the meaning of the Private Securities Litigation Reform Act of 1995. Actual results could differ materially from the views
expressed.

Factors that could cause actual results to differ materially from the outlook expressed or implied in any forward-looking statement include, without limitation:
changes in economic and business conditions; changes in financial and operating performance of our major customers and industries and markets served
by us; the timing of orders received from customers; the gain or loss of significant customers; competition from other manufacturers; changes in the
demand for our products or the end-user markets in which our products are sold; limitations or prohibitions on the manufacture and sale of our products;
availability of raw materials; increases in the cost of raw materials and energy, and our ability to pass through such increases to our customers; changes in
our markets in general; fluctuations in foreign currencies; changes in laws and government regulation impacting our operations or our products; the
occurrence of regulatory proceedings, claims or litigation; the occurrence of cyber-security breaches, terrorist attacks, industrial accidents, natural disasters
or climate change; hazards associated with chemicals manufacturing; the inability to maintain current levels of product or premises liability insurance or the
denial of such coverage; political unrest affecting the global economy, including adverse effects from terrorism or hostilities; political instability affecting our
manufacturing operations or joint ventures; changes in accounting standards; the inability to achieve results from our global manufacturing cost reduction
initiatives as well as our ongoing continuous improvement and rationalization programs; changes in the jurisdictional mix of our earnings and changes in tax
laws and rates; changes in monetary policies, inflation or interest rates that may impact our ability to raise capital or increase our cost of funds, impact the
performance of our pension fund investments and increase our pension expense and funding obligations; volatility and uncertainties in the debt and equity
markets; technology or intellectual property infringement, including cyber-security breaches, and other innovation risks; decisions we may make in the
future; the ability to successfully execute, operate and integrate acquisitions and divestitures; uncertainties as to the duration and impact of the coronavirus
(COVID-19) pandemic; and the other factors detailed from time to time in the reports we file with the SEC, including those described under “Risk Factors” in
our Annual Report on Form 10-K and our Quarterly Reports on Form 10-Q. These forward-looking statements speak only as of the date of this
presentation. We assume no obligation to provide any revisions to any forward-looking statements should circumstances change, except as otherwise
required by securities and other applicable laws.

                                                                                                                                                              2
Non-GAAP Financial Measures
It should be noted that Adjusted net income attributable to Albemarle Corporation (“Adjusted earnings”), Adjusted diluted earnings per share attributable to
Albemarle Corporation, Adjusted effective income tax rates, segment operating profit, segment income, pro-forma net sales, net sales excluding the impact
of foreign exchange translation ("ex FX"), EBITDA, Adj. EBITDA, Adj. EBITDA by operating segment, EBITDA margin, Adj. EBITDA margin, pro-forma Adj.
EBITDA, pro-forma Adj. EBITDA margin, Adj. EBITDA excluding the impact of foreign exchange translation ("ex FX"), Adj. EBITDA margin excluding the
impact of foreign exchange translation ("ex FX"), net debt to Adj. EBITDA, gross debt to Adj. EBITDA, free cash flow, and Adjusted free cash flow are
financial measures that are not required by, or presented in accordance with, accounting principles generally accepted in the United States, or GAAP.
These measures are presented here to provide additional useful measurements to review our operations, provide transparency to investors and enable
period-to-period comparability of financial performance. The Company’s chief operating decision maker uses these measures to assess the ongoing
performance of the Company and its segments, as well as for business and enterprise planning purposes.

A description of these and other non-GAAP financial measures that we use to evaluate our operations and financial performance, and reconciliation of
these non-GAAP financial measures to the most directly comparable financial measures calculated and reported in accordance with GAAP, can be found in
the Appendix to this presentation. The Company does not provide a reconciliation of forward-looking non-GAAP financial measures to the most directly
comparable financial measures calculated and reported in accordance with GAAP, as the Company is unable to estimate significant non-recurring or
unusual items without unreasonable effort. The amounts and timing of these items are uncertain and could be material to the Company's results calculated
in accordance with GAAP.

                                                                                                                                                       3
Recent Accomplishments Support Long-term Growth
Generated Q4/20 Net Sales of $879M and Adj. EBITDA of $221M,
above previous outlook
FY 2021 Net Sales of $3.2 – $3.3B and Adj. EBITDA of $810 –
$860M, expected to improve YoY
Completed $1.5B equity raise to accelerate high-return
growth projects
4Clear Strategy Drives Sustainable Growth
Grow • Pursue profitable growth to align with customer demand
Profitably • Build capabilities to accelerate lower capital intensity, higher return projects
Maximize • Optimize earnings and cash flow generation across all of our businesses
Productivity • Drive productivity through operational discipline
• Focus investment capital on highest-return opportunities
Invest
• Generate shareholder value through continual portfolio assessment; buy vs build
with Discipline
• Maintain Investment Grade credit rating and support our dividend
Advance • Continue to implement and improve ESG performance across all of our businesses
Sustainability • Enable our customers sustainability ambitions
5Strong Lithium Demand Driven by EVs
Global EV Global EV Production / Lithium Demand Lithium Demand
Sales by Year1 Market Penetration2 Projections3 by Application4
(mm units) (kt LCE) (kt LCE)
Battery
2020 vs. 2019: 2020-2025 2020-2025 total:
3.0 2,000 CAGR: ~25%
+45% CAGR: ~35% 92%
2,000
16.1%
2.5
1,500
1,500
2.0
ALB Estimate
Battery
1,140kt
total:
1.5 15.3 1,000 85%
1,000
4.6%
1.0
Battery Battery
500 500 total: total:
0.7% 59% 68%
0.5
0.6 3.4
0.0 0 0
Jul
Oct
2016
2017
2018
2019
2020
2021
2022
2023
2024
2025
2026
2027
2028
2029
2030
Jan
Jun
Nov
Dec
Feb
Mar
May
Apr
Aug
Sep
2015
2020
2025
2019
2020
2025
2030
Roskill Automotive (xEV)
2013 EV production (M) CRU
2015 Electric Stationary Storage
EV penetration (%) Benchmark
2017 Motive products Battery
Albemarle
2019 Power devices
2020 Portable electronics
Industrial
EV Producers Require Accelerated Lithium Supply Growth
1 Marketline
data as of 1/28/2021. 2 IHS Markit report as of Jan-2021. 3 Roskill projections as of Oct-2020, CRU Group projections as of Nov-2020, Benchmark projections as 6
of Dec-2020. 4 Roskill report as of Aug-2020.Albemarle Lithium Demand Forecast Revised Upwards
Lithium Demand by Application EV Penetration Battery Size
1,400 (ktpa LCE) (% of New Car Sales) (kWh per EV)
22%
+31% >4x +28%
1,200 CAGR 1,140 20% 19%
60
18% 55
1,000
16% 50
14%
800 40
+47% 787 40
12%
CAGR
600 10%
30
8%
400 20
292 6%
4.6%
113 4%
200 10
2%
0 0% 0
2020 2025 2020 2025 2020 2025
Battery Grade - EV
Battery Grade - Other BEV - Battery EV PHEV - Plug-in Hybrid EV EV Average
Specialty/Technical Grade
1
Inventory Change
Albemarle FY 2025 Lithium Demand Forecast Revised Upward +14%
1Inventory change assumes an average three-months of available inventory. 7Investing to Align Capacity with Market Demand
Estimated Lithium Nameplate Conversion Capacity Wave 3 Potential Projects (3-5 years)
Figures on ktpa LCE, 100% basis ~$1.5B CapEx
• China (MARBL)
Wave 3 & Wave 4
could more than ~125-175 ~450-500 • Silver Peak, Nevada
Expected to increase double 2021E
>500% from 2016 to • China Greenfield
YE 2021
• Kemerton, Australia (III & IV)
~150
Wave 1 &
Wave 2 Wave 4 Potential Project Options
~175 Funded with Enhanced FCF
• Carbonate to Hydroxide
30 • Kemerton, Australia (V)
YE 2016 YE 2021 1,2 Wave 3
3
Wave 4 Future • Opportunities in Asia
Post-Rockwood Potential Potential Projects Potential Project Potential
Acquisition (Next 3-5 years) Options • Kings Mountain, NC
JV Nameplate Conversion Capacity Potential Nameplate Capacity Range
New Capital Allocation Plan Enables Us to Enhance Utilization of Our Resource Base
1 Conversion capacity does not include 10 ktpa of technical-grade lithium concentrate. Includes ALB/MRL JV Stage I. MARBL JV provides ALB 100% marketing responsibility for the MRL hydroxide share
(60%:40%, ALB:MRL). 2 Full nameplate capacity at La Negra III/IV requires completion of Salar Yield Improvement Project. 3 Includes ALB/MRL JV Stage II. MARBL JV provides ALB 100% marketing 8
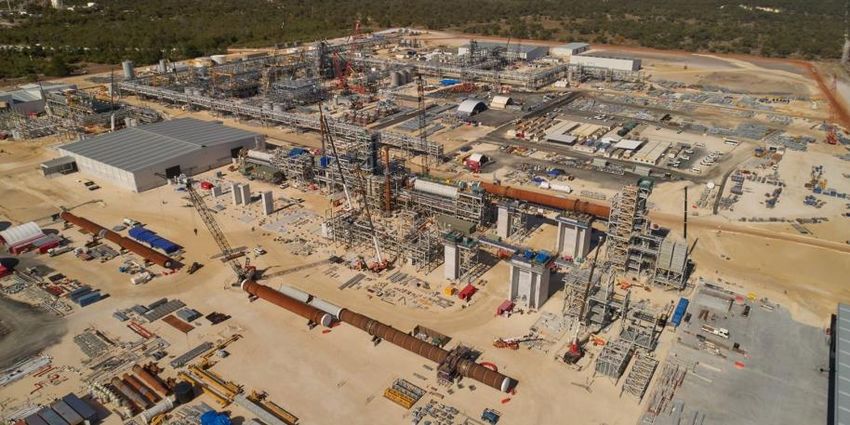
responsibility for the MRL hydroxide share (60%:40%, ALB:MRL).Conversion Facilities on Track for 2021 Completion
La Negra III / IV Kemerton I / II
New thermal evaporator significantly reduces fresh water intensity Kemerton site progress as of December 2020
• Conversion of low-cost, high-quality Chilean brine • Conversion of low-cost, high-quality Australian spodumene
• 40ktpa nameplate capacity – lithium carbonate • 50ktpa nameplate capacity – lithium hydroxide
• 100% owned and 100% marketed by ALB • 60% owned and 100% marketed by ALB
• Construction expected to be completed mid-2021, followed by • Construction expected to be completed late 2021, followed by
~6 month commissioning and qualification process ~6 month commissioning and qualification process
Wave 2 Projects Add Significant Lithium Sales Beginning 2022
9Reduced Capital Intensity to Achieve Higher Returns
Illustrative Lithium Capital Intensity Range (Cost/kg) Expected Key Drivers of Cost Reduction
✓ Leverage expertise in large-scale project construction
~40% lower ✓ Take advantage of brownfield economics
✓ Projects in lower-cost jurisdictions (e.g., China)
~20% lower
Investment Focus – Predominantly Lithium
▪ Major lithium expansions – focused on conversion assets
▪ US-based Bromine expansion
▪ Projects expected to generate >2x WACC at mid-cycle
pricing; minimum of >1x WACC at trough pricing
Wave 2 Wave 3 Wave 4
Disciplined Project Execution Driving Strong Investment Returns
10Executed Plans During Challenges of 2020
2020
WHAT WE SAID IN 20191 ACCOMPLISHMENTS
Continued operational excellence initiatives across our organization ✓ Ongoing
Grow
Capital projects on track for 2021 completion ✓ On track
Profitably
Lithium volumes projected to be up slightly ✓ FY down slightly; Q4 up YoY
Achieve $50M cost reduction in 2020 ✓ Achieved $80M
Maximize
Generate FCF in Bromine and Catalysts ✓ Complete
Productivity
Position for FCF positive target in 2021 ✓ Accelerating growth;
deferring FCF target
Continue to actively evaluate portfolio; complete FCS/PCS divestitures ✓ Ongoing
Invest
26th consecutive year of dividend growth; maintained Investment Grade credit rating ✓ Complete
with Discipline
~70% of capital spend in Lithium; evaluating buy vs build conversion options ✓ Ongoing
Advance Established baseline ✓ Complete
Sustainability Standardized reporting and metrics; long-term target setting ✓ Ongoing
1 As of Q4 2019 results presentation. 11Fourth Quarter and Full Year 2020 Financial Summary
(in millions, except per share amounts) Q4 2020 Q4 2019 Variance FY 2020 FY 2019 Variance
Net Sales $879 $993 -11% $3,129 $3,589 -13%
Net income attributable to Albemarle Corporation $85 $90 -6% $376 $533 -30%
Adjusted EBITDA $221 $295 -25% $819 $1,037 -21%
Adjusted EBITDA Margin 25% 30% 26% 29%
Diluted EPS $0.79 $0.85 -7% $3.52 $5.02 -30%
Non-operating pension and OPEB items 0.35 0.19 0.29 0.18
Non-recurring and other unusual items 0.03 0.69 0.31 0.85
Adjusted Diluted EPS $1.17 $1.73 -32% $4.12 $6.04 -32%
122020 Adjusted EBITDA1 Bridge ($ in millions)
Q4 2020 FY 2020
$325
$1,100
22
$300 295 $1,050 1,037
3 7
$1,000
$275
17
$950
$250
139
$900 6
$225 53 221
8 $850
43 819
$200
$800
138
$175
$750
$150 $700
Q4 2019 FX Impact Lithium Bromine Catalysts Corporate & Q4 2020 FY 2019 FX Impact Lithium Bromine Catalysts Corporate & FY 2020
Specialties Other 1 Specialties Other 1
Net of FX Net of FX
1
Corporate and Other includes Fine Chemistry Services (FCS).
13Prioritizing Capital Allocation to Support Growth Strategy
Invest to Grow Profitably Maintain Financial Flexibility
• Prioritize investment in growth • Committed to Investment Grade rating
• Strategically grow lithium capacity – near-term • Intention to retain long-term Net Debt to
focus on conversion Adj. EBITDA target of 2.0x - 2.5x
• Focus on capital discipline and operational Capital
excellence Allocation
Priorities
Limited Share Repurchases
Grow Dividend
• Limited cash flow available for repurchase in
near term as we invest in growth • 26 years of consecutive dividend increases
Growth via M&A and / or JVs
• Disciplined approach to investment opportunities
• Improved capital efficiency
• Low-cost resources and operations
Committed to Driving Shareholder Value Over the Long Term
14Capital Raised for Growth Projects
Capital Structure
Net Debt / Adj. EBITDA3
$1.5B gross proceeds from equity raise
3.5x Incremental debt capacity to fund capital
expenditure at final investment decision
1.5x
Current Pro forma
12/31/20201 12/31/2020 1,2
Use of Proceeds Commentary
▪ Utilize cash and debt capacity to fund projects at final investment ▪ Pro forma2 net debt of ~$1.3B, Net Debt / Adj. EBITDA3 1.5x;
decision estimated annual run rate interest savings of $22 million
▪ Short-term: debt pay-down to provide flexibility for future ▪ Intend to retain covenant flexibility with ample liquidity of ~$2.4B
investment; reduce interest expense and cash drag 1
▪ Intend to retain target long-term leverage range of 2.0x – 2.5x
Committed to Maintaining Investment Grade Credit Rating and Dividend
1Leverage calculated using 12/31/2020 TTM Adj. EBITDA. 2 Pro forma for follow-on equity issuance of $1.5B net of transactions costs. 3 Non-GAAP measure. See Appendix for 15
definition and non-GAAP reconciliations of historical measures.2021 Guidance vs 2020
As of February 17, 2021
2021 Guidance
FY 2021
FY 2020 vs
Guidance
FY 2020
Net Sales $3.1B $3.2B – $3.3B +3% to +6%
Adj. EBITDA $819M $810M – $860M -1% to +5%
Adj. EBITDA Margin 26.2% 25% – 26%
Adj. Diluted EPS $4.12 $3.25 – $3.65
Net Cash from Operations $799M $475M – $575M
Capital Expenditures $850M $850M – $950M
Additional Inputs for 2021: Depreciation and Amortization $265M - $285M; Adjusted effective tax rate 18.5%-19.5%;
Corporate costs $110M - $120M; interest and financing expenses $60M - $65M; Weighted-average common shares
outstanding – diluted 117.5M.
16Expected 2021 Business Environment vs. 2020
As of February 17, 2021
• Volumes up slightly due to North American restarts, efficiency improvements
• Prices down, primarily due to anticipated lower average pricing for carbonate and technical grade
• Higher costs related to project start-ups, partially offset by efficiency improvements
• Revenues to be back-half weighted
• Total Catalysts results to be flat year-over-year, with PCS improving over 2020 levels
• Lower refining catalyst volumes due to a recent change in customer order patterns in North America
• Q1 expected to be the strongest quarter of the year
• Expecting results to improve modestly assuming continued economic recovery
• On-going saving initiatives offset inflation
17Well-Positioned to Drive Sustainable Growth
2021 OBJECTIVES
Grow • Complete LAN III/IV (mid-2021) and Kemerton I/II (late-2021)
Profitably • Investment decisions on new expansion projects in Lithium and Bromine
• Achieve $75M productivity improvements versus 20201
Maximize
• Preserve margins with best-in-class cost discipline and continuous improvements
Productivity
• Build project execution expertise to accelerate highest return growth projects
• Align growth with commercial agreements to support economic returns
Invest
• Continue to actively evaluate portfolio; complete FCS/PCS divestitures
with Discipline
• Maintain Investment Grade credit rating and support our dividend
Advance • Set near-term sustainability targets; explore science-based target options
Sustainability • Partner with automotive OEMs to enable sustainable supply chains
1Includes $20-30M of previously announced sustainable cost savings, plus incremental productivity improvements. 18Lithium Overview
As of February 17, 2021
YoY Q4 Performance Drivers
Q4 2020 PERFORMANCE
• Net sales down 13% (price -20%, volume 7%); adjusted EBITDA down 13%
($M) Q4 2020 ΔQ4 2019 • Lower pricing due to contract price adjustments agreed in late 2019
Net Sales
• Stronger volumes as customers held to contract commitments
$359 -13%
Net Sales ex FX1 $356 -14% • Lower net sales partially offset by cost savings initiatives
Adj. EBITDA $122 -13%
Adj. EBITDA ex FX1 $123 -12% FY 2021 Outlook
Adj. EBITDA Margin 34% (1) bps
Adj. EBITDA Margin ex FX1 35% 45 bps • Higher volumes (North American restarts and efficiency improvements) offset slightly
lower pricing (anticipated lower average realized pricing for carbonate and technical
grade products)
HISTORICAL TREND (TTM)
• Higher lithium costs related to project start-ups partially offset by efficiency improvements
$550 50% • Revenues expected to be back-half weighted, Q1 2021 expected to be lowest quarter
$500 45% • LT growth story intact based on recent rebounds in EV production and sales
$450 40%
$400 35% Drivers/Sensitivities
$350 30%
• Energy storage (~60% of Li sales): Primary driver - EV sales in Europe and China
$300 25% ̶ Potentially 1 to 2 quarter lag behind EV production; high inventory of lithium
$250 20% levels are prolonging the lag
4Q19 1Q20 2Q20 3Q20 4Q20 • Specialties and TG (~40% of Li sales): Primary driver - consumer spending and industrial
Adjusted EBITDA Adjusted EBITDA Margin
production - less than 1 quarter lag
Note: Numbers may not reconcile due to rounding. 19
1 Net of FX impacts.Bromine Specialties Overview
As of February 17, 2021
YoY Q4 Performance Drivers
Q4 2020 PERFORMANCE
• Net sales up 8% (volume 4%, price 4%); adjusted EBITDA up 10%
($M) Q4 2020 ΔQ4 2019 • Continued sequential demand improvement from Q3; benefit of short-term supply-
demand imbalances
Net Sales $263 8%
Net Sales ex FX1 $262 8% • Lower raw material costs were favorable to margins
Adj. EBITDA $88 10%
Adj. EBITDA ex FX1 $86 8%
FY 2021 Outlook
Adj. EBITDA Margin 33% 61 bps
Adj. EBITDA Margin ex FX1 33% 18 bps • Expecting results to improve modestly assuming continued economic recovery
• On-going saving initiatives offset inflation
HISTORICAL TREND (TTM) • New technology trends like 5G, EVs, Internet of Things (IoT), and autonomous cars drive
growth opportunities
$350 40%
$300 35%
Drivers/Sensitivities
$250 30%
$200 25% • GDP driven business - electronics, automotive, construction, appliances
$150 20% • Flame retardants (~60% of sales): Primary driver - consumer spending / GDP
• Oilfield (Catalysts Overview
As of February 17, 2021
YoY Q4 Performance Drivers
Q4 2020 PERFORMANCE • Net sales down 31% (volume -31%, price 0%); adjusted EBITDA down 71%
Q4 2020 ΔQ4 2019 • Continue to see refinery capacity taken offline in order to balance supply and demand
($M)
• FCC volume down from lower transportation fuel consumption and travel restrictions
Net Sales $196 -31%
Net Sales ex FX1 $194 -31% • HPC volume down due to reduced fuel demand and normal lumpiness in shipments
compared to a strong Q4/19
Adj. EBITDA $22 -71%
Adj. EBITDA ex FX1 $24 -69%
Adj. EBITDA Margin 11% (1,589) bps FY 2021 Outlook
Adj. EBITDA Margin ex FX1 12% (1,491) bps
• Total Catalysts results to be flat year-over-year, with PCS improving over 2020 levels
HISTORICAL TREND (TTM) • Lower refining catalysts volumes resulting from a recent change in customer order
patterns in North America
$300 30% • Q1 is expected to be the strongest quarter of the year
$250 25% • Results are not expected to return to pre-COVID pandemic levels before late FY 2022 or
$200 20%
FY 2023
$150 15% Drivers/Sensitivities
$100 10%
• FCC (~ 60% of sales2): Primary drivers - miles driven/transportation fuel consumption
$50 5%
̶ Very little lag time with changes in fuel consumption
$0 0% • HPC (~ 40% of sales2): Primary driver - environmental sulfur regulations and miles
4Q19 1Q20 2Q20 3Q20 4Q20
driven/transportation fuel consumption
Adjusted EBITDA Adjusted EBITDA Margin
Note: Numbers may not reconcile due to rounding. 21
1 Net of FX impacts. 2 Sales based on a 5-year average excluding PCSUpcoming Investor Events
First Quarter 2021 Investor Relations Events
Date Event – All Virtual
Mar 23rd Goldman Sachs New Orleans Chemical Intensity Days
Mar 24th Spring Roadshow
Meredith Bandy David Burke Jeffrey Nakayama
VP, Investor Relations & Sustainability Director, Investor Relations Manager, Investor Relations
meredith.bandy@albemarle.com david.burke@albemarle.com jeffrey.nakayama@albemarle.com
+1 980.999.5168 +1 917.618.2651 +1 980.299.5614
22Appendix Non-GAAP Reconciliations
Definitions of Non-GAAP Measures

NON-GAAP MEASURE                     DESCRIPTION

Adjusted Net Income                  Net income attributable to Albemarle Corporation before non-recurring, other unusual and non-operating pension and OPEB.

Pro-forma Adjusted Net Income        Net income attributable to Albemarle Corporation before non-recurring, other unusual and non-operating pension and OPEB items, and the net impact of the divested business.

Adjusted Diluted EPS                 Diluted EPS before non-recurring, other unusual and non-operating pension and OPEB.

Pro-forma Adjusted Diluted EPS       Diluted EPS before non-recurring, other unusual and non-operating pension and OPEB items, and the net impact of the divested business.

EBITDA                               Net income attributable to Albemarle Corporation before interest and financing expenses, income taxes, and depreciation and amortization.

Adjusted EBITDA                      EBITDA before non-recurring, other unusual and non-operating pension and OPEB.

Pro-forma Adjusted EBITDA            Adjusted EBITDA before the net impact of EBITDA of the divested business.

Pro-forma Net Sales                  Net Sales before the impact of Net Sales from the divested business.

Adjusted Effective Income Tax Rate   Reported effective income tax rate before the tax impact of non-recurring, other unusual and non-operating pension and OPEB items.

                                                                                                                                                                                                        24
Adjusted Net Income
See above for a reconciliation of adjusted net income, the non-GAAP financial measures, to Net income attributable to Albemarle Corporation, the most directly comparable financial measure
calculated and reported in accordance with GAAP. 25EBITDA and Adjusted EBITDA
See above for a reconciliation of EBITDA, adjusted EBITDA and the non-GAAP financial measures, to Net income attributable to Albemarle Corporation, the most directly comparable financial
measure calculated and reported in accordance with GAAP. 26Adjusted EBITDA - by Segment (three months ended)
See above for a reconciliation of adjusted EBITDA on a segment basis, the non-GAAP financial measure, to Net income attributable to Albemarle Corporation (“earnings”), the most directly
comparable financial measure calculated and reporting in accordance with GAAP. 27Adjusted EBITDA – Margin by Segment (three months ended)
See above for adjusted EBITDA margin, a non-GAAP financial measure defined as adjusted EBITDA divided by net sales. See previous slide for the related reconciliation of adjusted EBITDA on a
segment basis, the non-GAAP financial measure, to Net income attributable to Albemarle Corporation (“earnings”), the most directly comparable financial measure calculated and reporting in 28
accordance with GAAP.Adjusted EBITDA – (twelve months ended)
See above for a reconciliation of adjusted EBITDA, the non-GAAP financial measures, to Net income attributable to Albemarle Corporation, the most directly comparable financial measure
calculated and reported in accordance with GAAP.
29Adjusted EBITDA – by Segment (twelve months ended)
See above for a reconciliation of adjusted EBITDA on a segment basis, the non-GAAP financial measures, to Net income attributable to Albemarle Corporation (“earnings”), the most directly
comparable financial measure calculated and reporting in accordance with GAAP. 30Adjusted EBITDA supplemental1
1 This supplemental is for net-debt-to-adjusted EBITDA ratio based on the bank covenant definition. 31Diluted EPS
1Totals may not add due to rounding
32Effective Tax Rate
See above for a reconciliation of the adjusted effective income tax rate, the non-GAAP financial measure, to the effective income tax rate, the most directly comparable financial measure calculated
and reporting in accordance with GAAP. 33Equity Income and Noncontrolling Interest
34www.albemarle.com
35You can also read