TD SECURITIES MINING CONFERENCE - Ivanhoe Mines Ltd.
←
→
Page content transcription
If your browser does not render page correctly, please read the page content below
TD SECURITIES
  MINING CONFERENCE
JANUARY 2021
FORWARD-LOOKING STATEMENTS
This presentation has been prepared solely for informational purposes. You should not definitively rely upon it or use it to form the definitive basis for any decision, contract, commitment or action whatsoever, with respect to any proposed
transaction or otherwise.

Certain statements in presentation constitute “forward-looking statements” or “forward-looking information” within the meaning of applicable securities laws, including, without limitation, the timing and results of: (i) statements regarding the
ongoing development and exploration work at the Kamoa-Kakula Project, including drilling, decline development, and feasibility, pre-feasibility and preliminary economic assessment (PEA) studies; (ii) statements regarding the ongoing
development work, including shaft sinking and feasibility, pre-feasibility and PEA studies, at the Platreef Project; and (iii) statements regarding ongoing upgrading and development work and feasibility, pre- feasibility and PEA studies at the
Kipushi Project. As well, the results of the pre-feasibility study and PEA of the Kamoa-Kakula Project, the feasibility study of the Platreef Project and the pre-feasibility study of the Kipushi Project constitute forward-looking information, and
include future estimates of internal rates of return, net present value, future production, estimates of cash cost, proposed mining plans and methods, mine life estimates, cash flow forecasts, metal recoveries, and estimates of capital and
operating costs.

Such statements involve known and unknown risks, uncertainties and other factors which may cause the actual results, performance or achievements of Ivanhoe, its mineral projects, or industry results, to be materially different from any future
results, performance or achievements expressed or implied by such forward-looking statements or information. Such statements can be identified by the use of words such as "may", "would", "could", "will", "intend", "expect", "believe", "plan",
"anticipate", "estimate", "scheduled", "forecast", "predict" and other similar terminology, or state that certain actions, events or results "may", "could", "would", "might" or "will" be taken, occur or be achieved. These statements reflect Ivanhoe’s
current expectations regarding future events, performance and results and speak only as of the date of this presentation.

In making such statements, Ivanhoe has made assumptions regarding, among other things: the accuracy of the estimation of mineral resources; that exploration activities and studies will provide results that support anticipated development and
extraction activities; that studies of estimated mine life and production rates at the Kamoa-Kakula, Kipushi and Platreef projects will provide results that support anticipated development and extraction activities; that Ivanhoe will be able to obtain
additional financing on satisfactory terms; that infrastructure anticipated to be developed or operated by third parties, including electrical generation and transmission capacity, will be developed and/or operated as currently anticipated; that laws,
rules and regulations are fairly and impartially observed and enforced; that the market prices for relevant commodities remain at levels that justify development and/or operation; that Ivanhoe will be able to successfully negotiate land access with
holders of surface rights; and that war, civil strife and/or insurrection do not impact Ivanhoe’s exploration activities or development plans.

Although the forward-looking statements or information contained in this presentation are based upon what management of Ivanhoe believes are reasonable assumptions, Ivanhoe cannot assure investors that actual results will be consistent
with these forward-looking statements. They should not be read as guarantees of future performance or results. A number of factors could cause actual results to differ materially from the results discussed in the forward- looking statements,
including, but not limited to, the factors discussed under "Risk Factors" in Ivanhoe’s most recent Annual Information Form.

These forward-looking statements are made as of the date of this presentation and are expressly qualified in their entirety by this cautionary statement. Subject to applicable securities laws, Ivanhoe does not assume any obligation to update or
revise the forward-looking statements contained herein to reflect events or circumstances occurring after the date of this presentation. Ivanhoe’s actual results could differ materially from those anticipated in these forward- looking statements.

This presentation also contains references to estimates of Mineral Resources. The estimation of Mineral Resources is inherently uncertain and involves subjective judgments about many relevant factors. Mineral Resources that are not Mineral
Reserves do not have demonstrated economic viability. The accuracy of any such estimates is a function of the quantity and quality of available data, and of the assumptions made and judgments used in engineering and geological
interpretation (including estimated future production from the company’s projects, the anticipated tonnages and grades that will be mined and the estimated level of recovery that will be realized), which may prove to be unreliable and depend, to
a certain extent, upon the analysis of drilling results and statistical inferences that ultimately may prove to be inaccurate. Mineral Resource estimates may have to be re-estimated based on: (i) fluctuations in copper, nickel, zinc, platinum-group
elements (PGE), gold or other mineral prices; (ii) results of drilling, (iii) metallurgical testing and other studies; (iv) proposed mining operations, including dilution; (v) the evaluation of mine plans subsequent to the date of any estimates; and (vi)
the possible failure to receive required permits, approvals and licences.

Disclosures of a scientific or technical nature regarding the revised capital expenditure and development scenarios at the Kamoa-Kakula Project in this presentation have been reviewed and approved by Steve Amos, who is considered, by
virtue of his education, experience and professional association, a Qualified Person under the terms of NI 43-101. Mr. Amos is not independent of Ivanhoe within the meaning of NI 43-101. Other disclosures of a scientific or technical nature in
this presentation have been reviewed and approved by Stephen Torr, who is considered, by virtue of his education, experience and professional association, a Qualified Person under the terms of NI 43-101. Mr. Torr is not independent of
Ivanhoe within the meaning of NI 43-101. Information in this presentation is based upon, and certain information is extracted directly from, NI 43-101 compliant technical reports prepared by Ivanhoe for each of the Kamoa-Kakula Project, the
Platreef Project and the Kipushi Project, which are available under the company’s SEDAR profile at www.sedar.com. These technical reports include relevant information regarding the effective date and the assumptions, parameters and
methods of the mineral resource estimates on the Kamoa-Kakula Project, Kipushi Project and Platreef Project cited in this presentation, as well as information regarding data verification, exploration procedures and other matters relevant to the
scientific and technical disclosure contained in this presentation in respect of the Kamoa-Kakula Project, Platreef Project and Kipushi Project.

                                                                                                                                                                                                                                                           2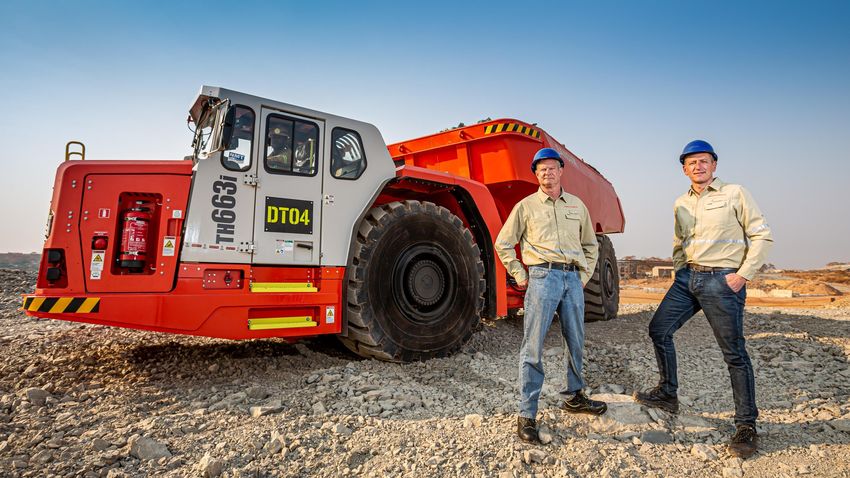
IVANHOE AT A GLANCE
 CORPORATE INFORMATION

                                           TSX: IVN
LISTINGS
                                           OTCQX: IVPAF

SHARE PRICE                                C$7.07 / share(1)

MARKET CAP                                 US$6.77 billion(1)

SHARES, OPTIONS                            Common Shares: 1,203.8 million(2)
& RSU                                      Options and other: 31 million(2)

CASH POSITION                              US$376 million(3)

                                           CITIC Metal             26.14%

                                           Zijin Mining            13.74%

                                           Robert Friedland        13.50%
MAJOR
SHAREHOLDERS                                                    Fidelity
                                                                Blackrock
                                                                Invesco
                                           Institutional
                                                                Skagen AS
                                           Investors
                                                                Rothschild
                                                                Oppenheimer
                                                                Vanguard
1. As of Jan. 20, 2021 using a US$:C$ exchange rate of 1.30.
2. As of Jan. 20, 2021.                                                        T imo t h e K a ye mbe “ o p e rat ing ” a p ie ce o f h e a vy e q u ip men t o n a
3. Cash & cash equivalents as of Sept. 30, 2020.                                s imulat or a t K a moa - Kakula’s new t r a ining c e nt re in t he D R C .          3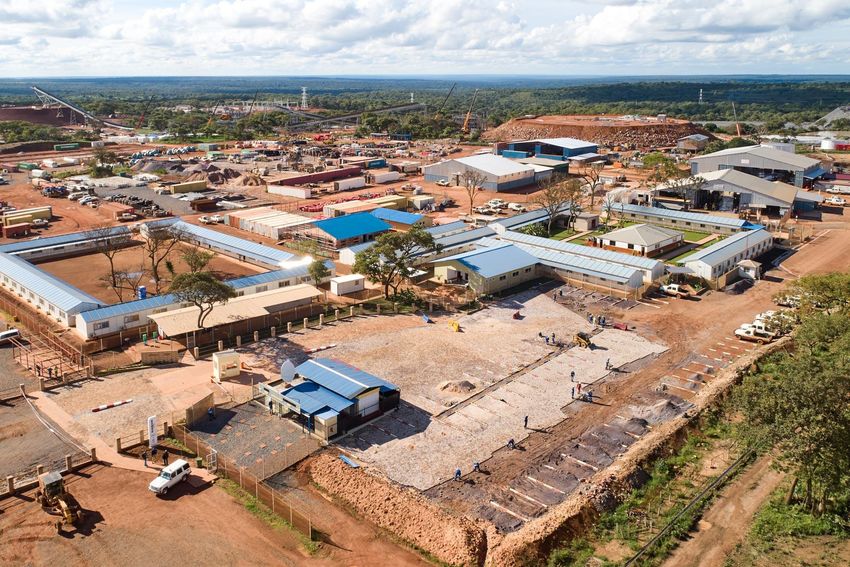
INVESTMENT HIGHLIGHTS
                                 Developing a responsible, long-life supply of critical metals
                                               for the clean-energy transition

• Three disruptive, world-         •   Well-funded with strong    • Strong partnerships with     • Diverse and experienced
  scale projects in critical           financial partners;          CITIC, Zijin and ITOCHU        management, with strong
  commodities: copper,                                              will allow for a modern,       track record of creating
  PGMs, nickel and zinc;           •   Advancing discussions        Canada-based diversified       value through discovery
                                       on additional funding        mining company;                and development.
• Significant growth
                                       solutions.
  in reserves and resources in
  some of the world’s largest,                                    • Industry-leading ESG
  highest-grade deposits.                                           potential.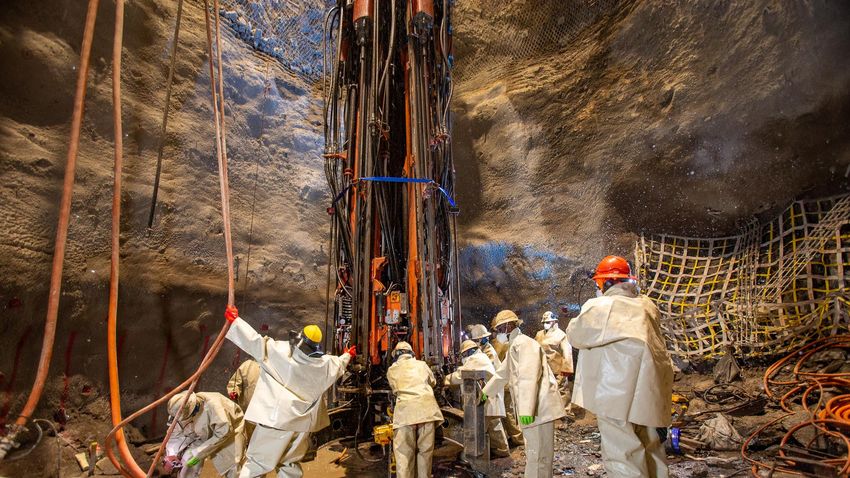
A LEADING EXPLORER & DEVELOPER IN AFRICA

                                                                     LOCATION:
                                                   KAMOA-KAKULA      Central African Copperbelt;
                                                                     approx. 270 km west of the
                                                                     provincial capital,
                                                                     Lubumbashi, DRC

                                                                     OWNERSHIP:
                                                                     Ivanhoe Mines (39.6%), Zijin
                                                                     Mining Group (39.6%),
                                                                     Crystal River Global (0.8%),
                                                                     Government of the DRC
                                                                     (20%)

                                                       Copper

                                                  WESTERN FORELAND   LOCATION:
                                                                     West of the Kamoa-Kakula
                                                                     Project, DRC

                                                                     OWNERSHIP:
                                                                     Ivanhoe Mines (100%)

                                                       Copper

                                                                     LOCATION:
LOCATION:                                             KIPUSHI        Approx. 30 km southwest of
Northern Limb of the           PLATREEF                              the provincial capital of
Bushveld Complex;                                                    Lubumbashi, DRC
adjacent to the
Mogalakwena Mine, South                                              OWNERSHIP:
Africa                                                               Ivanhoe Mines (68%),
                                                                     Gécamines (32%)
OWNERSHIP:
Ivanhoe Mines (64%), BEE
Partners (26%), Japanese
Consortium led by Itochu
(10%)
                           PGMs, Nickel, Copper         Zinc                                        5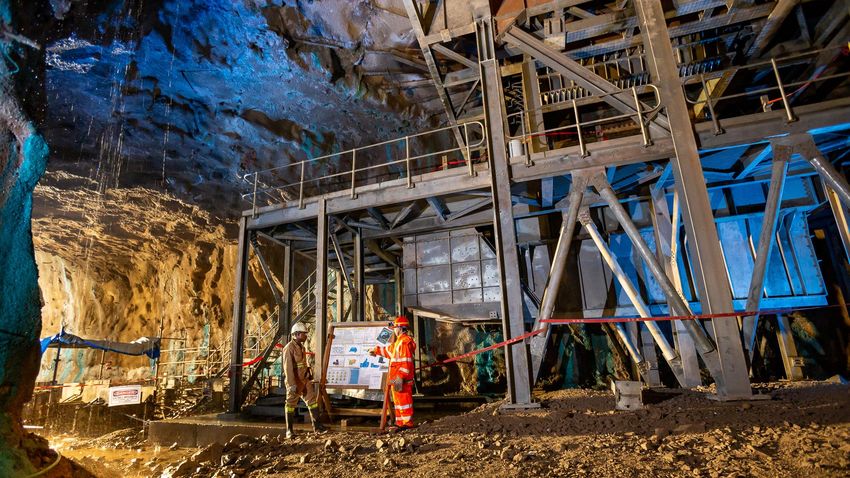
IVANHOE WILL PRODUCE
                                                             GREEN METALS

      HYDROPOWER                      SMALL FOOTPRINT            LOW IMPACT                 GREEN METAL
Water efficiency; powered by clean,       Underground           Majority of tailings       Ultra high grades;
green hydro-electricity; Low water      mines with limited    returned underground;
 consumption per ounce of 4PE                                                              renewable power;
                                        surface footprint    Platreef dry-stack tailings        less CO2
       using recycled water                                                                                     6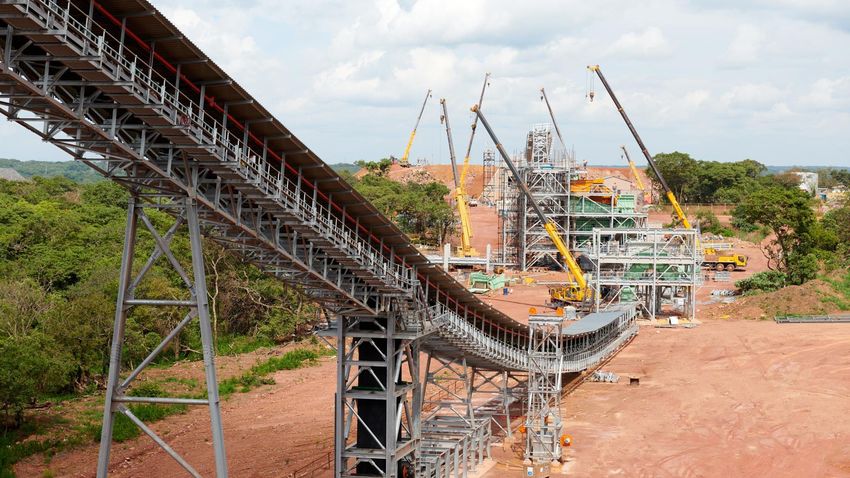
KAMOA-KAKULA: TIER-ONE CARBON FOOTPRINT

                                                            Kamoa-Kakula

                                         0.16t
                                         CO2e/t Cu

                                              Benchmarked Mines

                                           0.19t                                                                                                                                                                                  2.8t
                                           CO2e/t Cu                                                                                                                                                                              CO2e/t Cu
                                                                                       Emissions per tonne in copper concentrate

1. Based on the publicly-available information, not independently verified by Hatch.

Hatch has relied on Feasibility Study data provided by Ivanhoe and other third party providers; and has not independently verified either the data provided or the public data used for benchmarking. Hatch has calculated a metric to two decimal places for
comparative purposes only and it should not be considered to be representative of the level of accuracy for the projected metric. Kakula Mine (6 Mtpa) average projected GHG emission intensity over the production years 2023-2038.                            7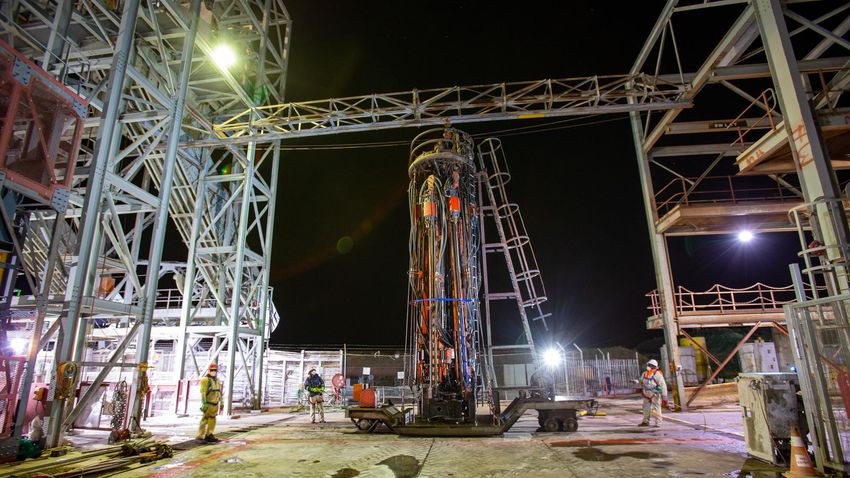
KAKULA ON TRACK FOR PRODUCTION JULY 2021

                                                                                                                  Pre-production ore
                                                                                                                 stockpiles hold 1.52
                     Overall development                                                                             million tonnes
                       of the flagship                               Kamoa-Kakula                                   grading 4.03%
                     Kakula Copper Mine                             secures US$420                                copper, containing
                       more than 58%                                million in project-                           more than 61,000
  Nov. 2, 2020            complete            Nov. 11, 2020       level credit facilities      Dec. 2, 2020        tonnes of copper

 Kamoa-Kakula           Nov. 9, 2020          Kakula Copper          Dec. 1, 2020              Kamoa-Kakula         Jan. 5, 2021
achieves another                           Mine’s northern and                                 mines a record
monthly record for                           southern access                                 250,000 tonnes of
  underground                              tunnels successfully                               development ore
development with                                connected                                      grading 4.85%
  2,172 metres                                                                              copper in November
  completed in
     October

                                                                                                                                        8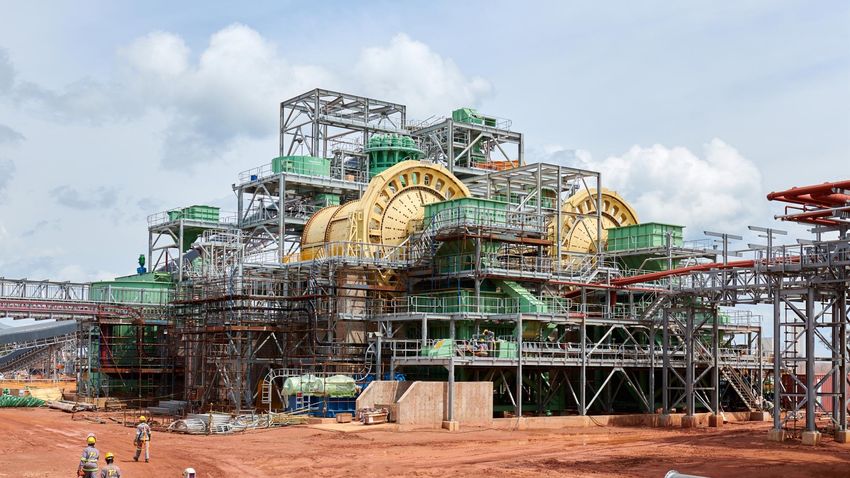
UNRIVALLED RESOURCE BASE
• World’s largest, high-grade undeveloped copper deposits with 36.6 Mt
KAMOA-KAKULA •
(Ind.) + 5.6 Mt (Inf.) of contained Cu(1)
Mineral reserves of 6.6 Mt of contained Cu at an average grade of 5.48%(2)
• Open down dip and along strike – excellent exploration potential
World’s largest PHASE 2 EXPANSION PLAN ACCELERATED
high-grade • Phase 2 mill expansion will double capacity from 3.8 Mtpa to 7.6 Mtpa
• Expansion plans accelerated to mid-2022, with orders placed for long-lead
copper discovery items for the concentrator and preliminary work underway
EXCEPTIONAL GRADES; LOW CASH COSTS
• Positioned to be among the world’s lowest-cost copper mines
• Expected to rank in the lowest quartile of the global cash cost curve
• Average grade of 6.2% copper over the initial 10 years of operations
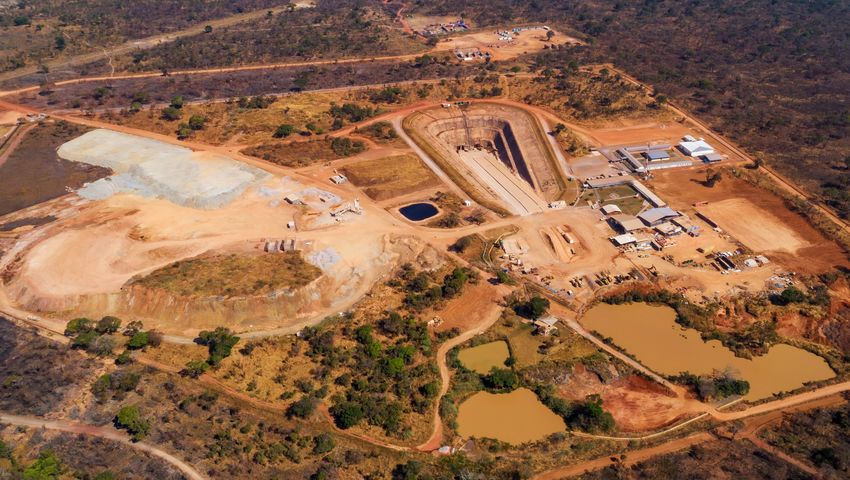
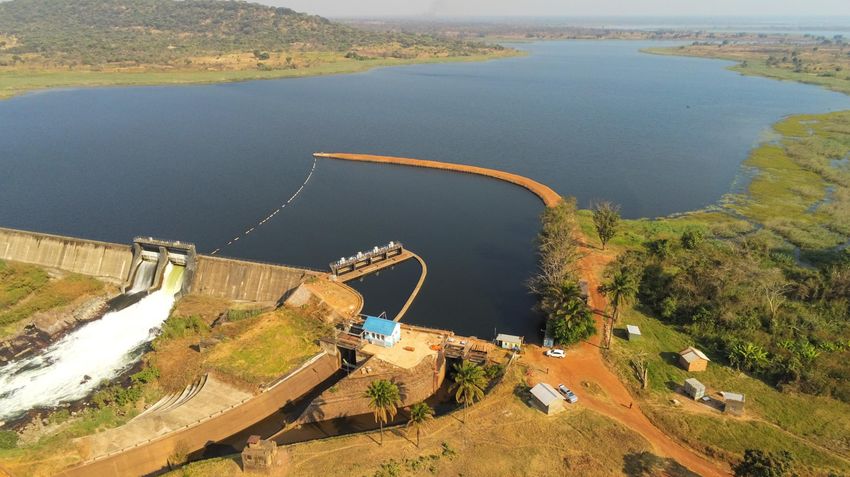
POWER AND INFRASTRUCTURE IN PLACE
• Rehabilitating hydroelectric facilities, with first nearing completion
• Phased logistics solution initially exporting to Durban (South Africa), and
and in future by rail to the port
FIRST CONCENTRATE PRODUCTION IN JULY 2021
• ~$570m capital remaining to first concentrate production
• 740 ktpa of Kakula + Kamoa + Kakula West peak copper production would
1. At 1.0% copper cut-off.
2. Kakula Mineral Reserves as of February 1, 2019. establish the project as the second-largest copper mine globally
3. All comparable “recently approved”, “probable” and “possible” projects with nominal
copper production capacity > 200ktpa (based on public disclosure and information
gathered in the process of routine research) as identified by Wood Mackenzie. 9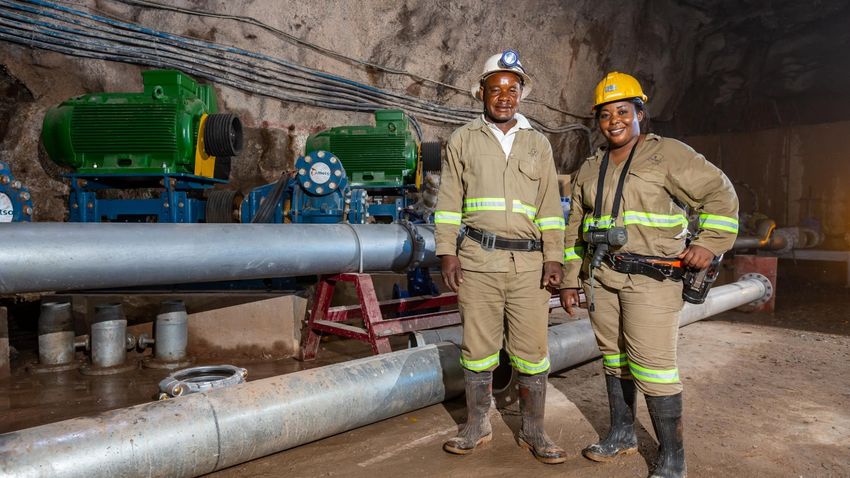
KAMOA-KAKULA IS
THE FIRST MAJOR
COPPER DISCOVERY
WITHIN THE
CENTRAL AFRICAN
COPPERBELT SINCE
THE EARLY 1990s

Geologically distinct,
yet geographically next
door to the well-known
Kolwezi deposits

                          10
KAMOA-KAKULA
INTEGRATED
DEVELOPMENT PLAN
Kamoa-Kakula IDP20
envisions an integrated, 19
Mtpa mining, processing and
smelting complex, built in
three stages
11KAMOA-KAKULA: INTEGRATED DEVELOPMENT PLAN
Kamoa-Kakula: On Track Become the World’s Second Largest Copper Mine
Phase 5 (Full Processing Capacity)
19.0
Phase 4
15.2
Kakula West Mine
Milled (Mtpa)
11.4 Phase 3
Kamoa North
Kansoko Mine Mines
7.6 Phase 2 (7.6 Mtpa) Q1 2023
Phase 1 (3.8 Mtpa) Q3 2021
3.8
Kakula Mine
Direct-to-Blister Smelter
Commences (PEA Only)
–
2020 2022 2024 2026 2028 2030 2032 2034 2036 2038 2040 2042 2044 2046 2048 2050 2052 2054 2056 2058
Year
Kakula Mine Kansoko Mine Kakula West Mine Kamoa North Mines 12KEYHIGHLIGHTS:
KEY HIGHLIGHTS: Shown on 100%-basis
Kakula DFS
Kakula-Kansoko Kamoa-Kakula
SEPTEMBER
SEPTEMBER 2020
2020 in US dollars PFS PEA
DFS,
DFS,PFS
PFSAND
ANDPEA Annual Production 6 Mt 7.6 Mt 19 Mt (5 x 3.8Mt)
PEA Mill Feed Grade (1) 6.2% 5.9% 5.1%
Copper Metal Produced (1) 284 ktpa 331 ktpa 501 ktpa
Remaining Initial Capital $0.65 Bn $0.7 Bn $0.7 Bn
Expansion Capital $0.6 Bn $0.75 Bn $4.5 Bn
After-tax NPV8%(2) $5.5 Bn $6.6 Bn $11.1 Bn
IRR (Real %)(2) 77% 69% 56%
Fully funded to first On track for first copper
copper production production in Q3 2021
1. First ten year average.
1. First ten year average.
2. Including smelter.
2. Consensus long-term copper price of $3.10/lb and $200/t acid. Includes
3. Consensus long-term
the impact of the 2018copper price ofCode.
DRC Mining $3.10/lb and $200/t acid. Includes the
impact of the 2018 DRC Mining Code. 13PHASE 2: US$420 Million in
project-level credit facilities
• US$211-million equipment • US$200-million line of
financing facility; credit from Zijin
• Provided by leading
Mining;
international lenders, the
Swedish Export Credit • Secured by pre-
Corporation (SEK) and production ore
Standard Bank. stockpiles.
14KAKULA CONSTRUCTION GALLERY
15KAMOA-KAKULA – AMONG THE WORLD’S LARGEST COPPER MINES (1)
1,400
1,200
Paid Copper Production (ktpa)
1,000
800
600
400
200
--
Source: Company filings, Wood Mackenzie.
1. Kamoa-Kakula 2020 PEA production based on projected peak copper production (which occurs in year 8) of the 19 Mtpa alternative development option. 16KAKULA – FIRST QUARTILE MINE SITE CASH COST (1)
$4.00
2020 Mine Site Cash Costs (US$/lb)
$3.50
$3.00
$2.50
$2.00
$1.50
$1.00
$0.50
Kakula (First Ten Years): $0.52/lb
--
-- 20% 40% 60% 80% 100%
Source: Company filings, Wood Mackenzie.
1. Represents Wood Mackenzie mine site cash costs. Kakula is based on the average mine site cash cost during the first 10 years as detailed in the Kakula 2020 DFS. 17KAKULA-KANSOKO – LOWEST CAPITAL INTENSITY (1)
30,000
US$ / tpa Copper Eq. Production
Brownfield Greenfield
25,000
20,000
15,000
10,000
5,000
--
Source: Company filings, Wood Mackenzie.
1. Recently approved, probable and possible projects with nominal copper production capacity in excess of 200 kt/a. Kakula-Kansoko is based on the capital costs incurred in 2019, the
capital costs incurred in the six months ended June 30, 2020 and the estimated initial and expansion capital costs from July 1, 2020 in the Kakula-Kansoko 2020 PFS. Kakula- 18
Kansoko’s first 10 years’ average annual production of copper in concentrate are considered to be its nominal copper production.EXPLORATION
AND WESTERN
FORELAND
Offers Significant Upside to
The Quality and Economics of
Our Copper Assets
• Significant exploration potential remains on
both our Kamoa-Kakula joint venture, and
100%(1) owned Western Foreland ground
• Significant potential for mineralization
continuing from JV ground to Western
Foreland ground
• New discoveries made on Western
Foreland ground
• Recent new discovery of Kamoa Pyrite
Siltstone (KPS) has delivered further ultra
high-grade results, and promises
continued future success
1. Will require a sell-down to 90%. 19FINDING MORE BONANZA-GRADE ORE AS
GEOLOGICAL KNOWLEDGE INCREASES
Kansoko Kakula Kamoa North
1% cutoff
2% cutoff
3% cutoff
2% cutoff
1% cutoff
3% cutoff
2% cutoff
3% cutoff
2% cutoff
1% cutoff
3% cutoff
2% cutoff
1%
R4.2 contact
R4.2 contact R4.2 contact R4.2 contact
35.3m @ 11.0% Cu
9.0m @ 4.83% Cu 19.8m @ 5.32% Cu 29.4m @ 5.32% Cu
18.9m @ 18.0% Cu
8.1m @ 5.98% Cu 10.8m @ 8.49% Cu 22.4m @ 13.05% Cu
11.8m @ 3.9% Cu
6.1m @ 5.98% Cu 9.8m @ 9.90% Cu 22.4m @ 13.05% Cu
16.5m @ 20.1% Cu
For reference, the worlds largest mine, Escondida, has an LOM grade of 0.5% copper 20KAMOA-KAKULA IN SUMMARY
Fully funded to first copper production in
less than one year
TIER Among the largest and lowest cost
ONE copper mines in the world
Unparalleled financial returns for all
stakeholders in a major mining project
Significant expansions planned to 19 Mtpa
production rate, funded from cash flows
21PLATREEF: THE WORLD’S NEXT GREAT
PRECIOUS METALS MINE
SET TO BECOME ONE OF WORLD’S LARGEST PRIMARY PGM MINES
• Potential annual production of more than 600,000 oz. of palladium, platinum,
rhodium and gold; plus over 40 million lbs. of nickel and copper
• Studies underway on initial 0.7 Mtpa mine and transition of Shaft 1 to production
• Significant resource and exploration upside
ULTRA-LOW CASH COSTS
• Near the very bottom of the global cash cost curve
• US$442 per ounce of palladium, platinum, rhodium and gold, net of by-products;
including sustaining capital
SUSTAINABLE ECONOMIC DRIVER FOR SOUTH AFRICA
• Leading producer of “green metals” critical for many clean technologies
• Mechanized, underground mining; dry-stack tailing decision to minimize project impact
• 26% held by B-BBEE partners, including 20 local host communities with a total of
approx. 150,000 people, project employees and local entrepreneurs
22
1. Please visit www.ivanhoemines.com for technical disclosures on production and cost figures.PLATREEF : UPDATED FEASIBILITY STUDY
Plant ramp-up to
4.4 Mtpa 4.4 Mtpa
Module 2
Platreef 2020 Feasibility Study
4.4 Mtpa
Production
2.2 Mtpa Plant ramp-up to
2.2 Mtpa
2x 2.2Mt Plant Construction Module 1
Shaft 1
Underground Development
Changeover
Shaft 2
Shaft 2 Collar Shaft 2 Sinking
Equipping
2021 2022 2023 2024 2025 2026 2027 2028 2054 2055
Shaft 2 Hoisting
235.2 Mtpa
PLATREEF: 2020 PEA Plant ramp-up to
5.2 Mtpa
PHASED DEVELOPMENT PLAN
Expansion 2
Production
3.0 Mtpa Plant ramp-up to
3.0 Mtpa
Expansion 1
Full concentrator
0.70 Mtpa initial capacity (0.77 Mtpa)
rate
700ktpa Detailed
0.7 Mtpa Engineering 700kt Plant Construction
Shaft 1 2x 2.2Mt Plant
Initial Concentrator
Underground Development
Changeover Construction
2021 2022 2023 2024 2025 2029 2030 2031 2032 2053 2054
Shaft 2 Sinking and
24
Shaft 1 Hoisting Equipping Shaft 2 HoistingPLATREEF : EVOLUTION OF BASKET PRICE
Platreef basket price
today is over
Platreef Revenue Per Tonne of Probable Reserves (US$/t ore) US$2,100/oz(1)
$320
$280
$240
$200
$160
$120 Total Cash Cost (Mine Site + Realization)
$80
Mine Site Cash Cost
$40
--
Platinum Palladium Rhodium Gold Copper Nickel
25
1 Spot metal prices (November 27, 2020): US$968/oz Pt, US$2,428/oz Pd, US$1,788/oz Au, US$16,100/oz Rh, US$7.36/lb Ni, US$3.35/lb Cu.KEY HIGHLIGHTS: PEA (Phased
Shown on 100%-basis in US$ Feasibility Study
NOVEMBER 2020 Development)
FS AND PEA
Annual Throughput 4.4 Mt 0.7 Mt to 5.2 Mt
3PE+Au Produced(1) 508 kozpa 109 to 613 kozpa
Ni + Cu Produced(1) 36 Mlbpa 7 to 43 Mlbpa
Initial Capital $1.4 Bn $0.4 Bn
Expansion Capital NA $1.3 Bn
LONG- After-tax NPV8%(2) $1.8 Bn $1.6 Bn
TERM
PRICES IRR (Real %)(2) 20% 20%
After-tax NPV8%(3) $3.7 Bn $3.3 Bn
SPOT
PRICES
1
2
LOM annual average.
Metal price assumptions used for the IDP20 economic
IRR (Real %)(3) 28% 29%
analysis: US$1,050/oz Pt, US$1,400/oz Pd, US$1,560/oz Au,
US$5,000/oz Rh, US$7.30/lb Ni, US$3.10/lb Cu. 16:1 ZAR to
1. USD exchange
First ten year rate.
average.
3 2. Spot metal prices
Including (November 27, 2020): US$968/oz Pt,
smelter.
US$2,428/oz Pd, US$1,788/oz Au, US$16,100/oz Rh,
3. US$7.36/lb
Consensus long-termCu.
Ni, US$3.35/lb copper price
16:1 ZAR of $3.10/lb
to USD exchangeand $200/t acid. Includes the
impact of the 2018 DRC Mining Code.
rate.
26PLATREEF : INDUSTRY LEADING CASH COST
Global primary PGM producer net total cash cost + SIB capital (2019), US$/3PE+Au oz
Quartile 1 Quartile 2 Quartile 3 Quartile 4
1,800
1,600 Platreef cash cost:
US$442/oz 3PE+Au,
1,400
net of by-products
1,200
1,000
800
600
400
200
0
4E production
Western Limb Eastern Limb Northern Limb Great Dyke North America
Source: SFA (Oxford). Data for Platreef Project is based on the Platreef 2020 FS parameters and are not representative of SFA's view. Net total cash costs have been calculated using base case assumptions of 16:1 27
ZAR:USD, US$1,050/oz platinum, US$1,400/oz palladium, US$1,560/oz gold, US$5,000/oz rhodium, US$7.30/lb nickel and US$3.10/lb copper.PLATREEF : POTENTIAL TO BECOME LARGEST
PRIMARY PGM PRODUCER
Platreef 2014
1,600 3PE+Au Production 2019 (Pd Eq. oz) 12 Mtpa PEA
Palladium Equivalent Production (koz)
3PE+Au Production
1,400
Ni+Cu Production 2019 (Pd Eq. oz)
Ni+Cu Production
1,200
1,000 Platreef 2020
4.4 Mtpa FS
800
600
400
200
-
Eastern Limb Northern Limb Great Dyke North America Western Limb
Source: Production estimates for projects other than Ivanhoe’s Platreef Project have been prepared by SFA (Oxford). Production data for the Platreef Project (platinum, palladium, rhodium, gold, nickel and copper) is based
on reported FS and PEA data and is not representative of SFA's view. All metals have been converted to palladium equivalent ounces at using base case assumptions of US$1,050/oz platinum, US$1,400/oz palladium, 28
US$1,560/oz gold, US$5,000/oz rhodium, US$7.30/lb nickel and US$3.10/lb copper. Note: As the figures are palladium-equivalent ounces of production they will not be equal to 3PE+Au production.PLATREEF 2021: NEXT STEPS
Shaft 1 preparation for permanent hoisting in early 2022
Shaft 2 headframe to collar construction ($10M) for expansion optionality
Detailed engineering underway on mine design, 770-ktpa
concentrator and infrastructure design
2021 budget of $59M, with advanced discussions underway for up
to $400M
292,900
Zinc Futures – 9 month KIPUSHI: THE WORLD’S
2,700
HIGHEST-GRADE ZINC MINE
THE HIGHEST-GRADE MAJOR ZINC MINE
2,500 • Big Zinc Zone with M&I Mineral Resources of 11.8Mt at
35.3% Zn
• Top 10 largest zinc project by contained zinc; with grade
more than twice as high as the world’s next highest-
USD
2,300 grade zinc project
CONSTRUCTION READY
2,100
• Lowest capital intensity of all zinc projects globally
• Significant underground rehabilitation completed
1,900
1,700
1,500
Apr-20 May-20 Jun-20 Jul-20 Aug-20 Sep-20 Oct-20 Nov-20
Notes: The Kipushi mine is not currently in production, but once in production it is expected to be the world’s highest-grade major zinc mine.
1. All comparable “probable” and “base case” projects as identified by Wood Mackenzie. 30• Three long-life, • Robust, experienced • Strong shareholder • Strong balance sheet
world-class mines management team with register of global with no debt
with low costs, low an unrivalled track institutional investors
capital intensity and record of success • Fully funded to first
low environmental • Committed financial copper production in Q3
footprints • Poised to grow Ivanhoe and strategic support 2021
into the next world-class from key partners
• All three mines will mining company
be best in class;
poised to be leaders
in ESG 31THANK YOU
You can also read