Company presentation - 9M 2017 Update - Christoph Hobo (CFO) - JOST World
←
→
Page content transcription
If your browser does not render page correctly, please read the page content below
Company presentation - 9M 2017 Update
Christoph Hobo (CFO)

Disclaimer

THIS FINANCIAL REPORT IS BEING PROVIDED TO YOU SOLELY FOR YOUR INFORMATION. THIS FINANCIAL REPORT, WHICH HAS BEEN PREPARED BY JOST WERKE AG
(THE “COMPANY”), SHOULD NOT BE TREATED AS GIVING INVESTMENT ADVICE AND MAY NOT BE REPRODUCED IN ANY FORM, PASSED ON OR OTHERWISE MADE
AVAILABLE, DIRECTLY OR INDIRECTLY, TO ANY OTHER PERSON, OR PUBLISHED, IN WHOLE OR IN PART, FOR ANY PURPOSE. IN PARTICULAR, THIS FINANCIAL
REPORT MUST NOT BE RELEASED, PUBLISHED OR DISTRIBUTED IN THE UNITED STATES OF AMERICA (THE “UNITED STATES”), AUSTRALIA, CANADA, JAPAN OR ANY
OTHER JURISDICTION WHERE SUCH DISTRIBUTION IS UNLAWFUL. ANY FAILURE TO COMPLY WITH THESE RESTRICTIONS MAY CONSTITUTE A VIOLATION OF
APPLICABLE SECURITIES LAWS.

For the purposes of this notice, “report” means this document, its contents or any part of it. This report does not, and is not intended to, constitute or form part of, and should not be
construed as, an offer to sell, or a solicitation of an offer to purchase, subscribe for or otherwise acquire, any securities of the Company, nor shall it or any part of it form the basis of or
be relied upon in connection with or act as any inducement to enter into any contract or commitment or investment decision whatsoever.

This report is neither an advertisement nor a prospectus and should not be relied upon in making any investment decision to purchase, subscribe for or otherwise acquire any securities.
The information and opinions contained in this report are provided as at the date of this report and may be subject to updating, revision, amendment or change without notice. This
report is selective in nature and does not purport to contain all information that may be required to evaluate the Company and/or its shares. Neither the Company nor any other person is
under any obligation to update or keep current the information contained in this report or to correct any inaccuracies in any such information which may become apparent or to provide
you with any additional information. No reliance may or should be placed for any purpose whatsoever on the information contained in this report, or any other information discussed
verbally, or on its completeness, accuracy or fairness.

Certain information in this report is based on management estimates. Such estimates have been made in good faith and represent the current beliefs of applicable members of
management. Those management members believe that such estimates are founded on reasonable grounds. However, by their nature, estimates may not be correct or complete.
Accordingly, no representation or warranty (express or implied) is given that such estimates are correct or complete. Where this report quotes any information or statistics from any
external source, it should not be interpreted that the Company has adopted or endorsed such information or statistics as being accurate. This report contains forward-looking
statements. These statements reflect the Company’s current knowledge and its expectations and projections about future events and may be identified by the context of such
statements or words such as “anticipate,” “believe”, “estimate”, “expect”, “intend”, “plan”, “project”, “target”, “may”, “will”, “would”, “could” or “should” or similar terminology. Forward-
looking statements include all matters that are not historical facts. They appear in a number of places throughout this report and include statements regarding the Company’s intentions,
beliefs or current expectations concerning, among other things, the Company’s prospects, growth, strategies, the industry in which it operates and potential or ongoing acquisitions. By
their nature, forward-looking statements are subject to a number of risks and uncertainties, many of which are beyond the Company’s control that could cause the Company’s actual
results and performance to differ materially from any expected future results or performance expressed or implied by any forward-looking statements. Forward-looking statements should
not be read as guarantees of future performance or results and will not necessarily be accurate indications of whether or not such results will be achieved. Similarly, past performance
should not be taken as an indication of future results, and no representation or warranty, express or implied, is made regarding future performance. The development of the Company’s
prospects, growth, strategies, the industry in which it operates, and the effect of acquisitions on the Company may differ materially from those made in or suggested by the forward-
looking statements contained in this report or past performance. In addition, even if the development of the Company’s prospects, growth, strategies and the industry in which it operates
are consistent with the forward-looking statements contained in this report or past performance, those developments may not be indicative of the Company’s results, liquidity or financial
position or of results or developments in subsequent periods not covered by this report. Any forward-looking statements only speak as at the date of this report is provided to the
recipient and it is up to the recipient to make its own assessment of the validity of any forward-looking statements and assumptions. The Company undertakes no obligation publicly to
release the results of any revisions to any forward-looking statements in this report that may occur due to any change in its expectations or to reflect events or circumstances after the
date of this report.

To the extent available, the industry and market data contained in this report has come from third party sources. Third party industry publications, studies and surveys generally state
that the data contained therein have been obtained from sources believed to be reliable, but that there is no guarantee of the accuracy or completeness of such data. In addition, certain
information in this report are selective and may not necessarily be representative for the Company. Further, certain of the industry and market data contained in this report come from
the Company's own internal research and estimates based on the knowledge and experience of the Company's management in the market in which the Company operates. While the
Company believes that such research and estimates are reasonable and reliable, they, and their underlying methodology and assumptions, have not been verified by any independent
source for accuracy or completeness and are subject to change without notice. Accordingly, undue reliance should not be placed on any of the industry or market data contained in this
report.
                                                                                                 1
Company overview and key highlights

                            2
JOST – leading global supplier of safety critical truck and trailer solutions
FY 2016 9M 2017 update
Sales / CAGR (14-16A) Adj. EBIT2 / margin CF / Cash conversion3 Sales / y-o-y growth Adj. EBIT2 / margin
€634m / 3.6%1 €62m / 9.8% €60m / 76.4% €533m / 9.5% €64m / 12.0%
Sales by region4,5 Sales by application6 Sales by type
Brazil JV
5% AM and Trading
Asia, Pacific ~25%
and Africa
22% Truck Trailer
~45% ~55% OE
Europe ~75%
56%
North America
17%
Product portfolio
Brands
Systems Vehicle interface (74% sales) Handling solution (10% sales)7 Manoeuvring (16% sales)
Product
examples
JOST has ~55% market share globally in products representing 64% of sales8
1 CAGR assuming MBTAS reflected in 2014 sales, 2 Excluding PPA D&A and exceptional items, including pro rata net income from Brazil JV, 3 Cash flow (CF) defined as adjusted EBITDA –
capex; cash conversion defined as (adjusted EBITDA – capex)/adjusted EBITDA, 4 Sales by region including consolidation effects, 5 Sales by region represent global sales of JOST’s branded
products including 100% of Brazil JV, which had sales of €29m in 2016, 6 Includes aftermarket and trading, 7 Including other, 8 Fifth wheel: JOST 54%, Other 46%; Landing gear: JOST 56%,
Other 44%
Source: Roland Berger 2017
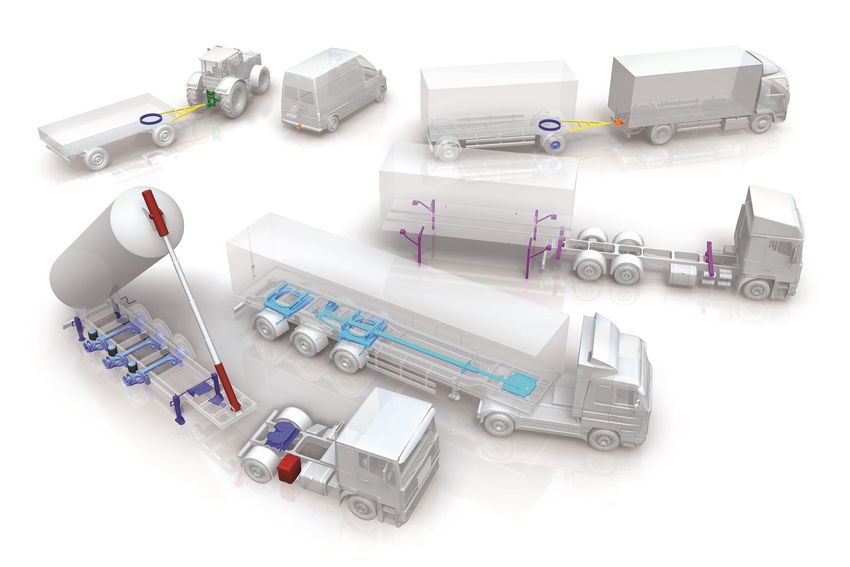
3Overview of our main products
Drawbar
Varioblock Turntable
Rockinger Agriculture
Towing Hitch
Coupling
Drawbar
Turntable
Cross Member
Cylinder
Axles Container Technology,
Supporting Leg
Landing Gear
Forced Steering
King Pin Fifth Wheel
Vehicle interface (74% sales) Handling solution (10% sales)7 Manoeuvring (16% sales)
4Key takeaways
Key investment highlights
1 Leadership – Global leadership in branded products
2 Attractive company growth – Market outperformance: upselling, market expansion and bolt-on M&A
3 Market growth – Sustained growth on the back of strong fundamentals
4 Diversification – High aftermarket content and high diversification by customer and geography
5 Business model – Flexible and asset-light business model
6 Track record – Industry-leading margins and cash generation profile
Additional investment back up highlights in appendix
51 Global leadership in branded products
One of the leading global suppliers of truck and trailer systems with high market share in
core segments
JOST has a leading market position in Vehicle Interface systems
>50% global market share in articulated truck trailer combinations market
Fifth wheel Landing gear
Global market share1
Top 3 Supplier JOST Top 3 Supplier JOST
84% 54% 82% 56%
Americas (excl. Brazil JV) Europe Americas (excl. Brazil JV) Europe
#2 #1 #1
Market position by
#1
geography1
Brazil2 #1 Brazil2 #1
#1 Asia-Pacific-Africa #1 Asia-Pacific-Africa
#1 player in key products3 that account for 64% of total sales
1 By sales
2 Includes Brazil JV
3 Fifth wheel and landing gear
Source: Roland Berger 2017
62 Market outperformance: upselling, market expansion and bolt-on M&A
JOST’s strategy is focused on further enhancing its cash generative baseline business while
developing advanced solution systems to provide long-term growth
Business area development Example products Operational focus
Integrated system
Future growth engine
Longer term perspective Leveraging stable business
cashflows to invest in the
1 Autonomous docking technologies of the future
systems
New adjacent market
Near-, medium- Comfort Coupling
expansion
System E-landing
term growth gear Stand-alone derivatives from
1 new product development
1
Forced Steering Wheel
Systems Suspensions
Upselling based on modular
Upselling concept
potential Product optimization and
enhancement features –
Cash generative baseline
LubeTronic Fifth Wheel value engineering
2
Branded
volume Entry level Branded quality entry level
Fifth Wheel systems
market
Cost and operational efficiency
(e.g. plant consolidation)
2 Entry level
Landing Gear Entry level
2
Towning Hitch
72 Market outperformance: upselling, market expansion and bolt-on M&A
JOST’s successful strategy to outgrow the market
JOST’s approach to outperform the market
Manual landing gear E-Drive landing gear
Increased content
compared to base version
(e.g >4x for landing gear)
Higher content
1 Upselling through innovations
per product Manual fifth wheel LubeTronic fifth wheel Comfort Coupling System
By region By product
Region
Growth in US: gain market share with OEMs
Localisation of Rockinger and Tridec in China
Growth
2 initiatives
Product
Growth in axles: expand in aftermarket
Growth in hydraulics: expand capacity
Strong M&A track record
3 Accretive M&A
Potential add-on M&A opportunities
Trailer Axle Systems
83 Sustained growth on the back of strong fundamentals
Truck and trailer in all other regions are expected to outperform GDP growth on the back
of favorable long-term economic factors
Macro factors supporting robust long-term sector growth
Positive GDP and Growing share of road Regulation driving renewal
1 2 3
freight growth transportation of truck and trailer fleets
Truck production development Trailer production development Recent trailer development
Global truck1 production by region, Global trailer2 production by region, Press reports
2012 – 21 (m units) 2012 – 21 (m units)
4.0 CAGR: 1% CAGR: 3% CAGR CAGR 1.5 CAGR: 4% CAGR: 3% CAGR CAGR
12 – 17 17 – 21 12 – 17 17 – 21 “Policy changes impact
1.3 Chinese heavy vehicle
3.3 market”
1.2 1.1
2.9 Global Trailer Magazine,
3.0 2.8 June 2017
0.9 0.6 7% 3%
0.9 0.5 “US trailer sales going
1.9 1% 3%
2.0 1.8 0.3 up”
1.7
0.6 Global Trailer Magazine,
0.4 0% 4% June 2017
0.4
0.3
1.0 0.6 (2%) 5%
0.6 0.5 0.3 “EU commercial vehicle
market on the rise”
0.7 0.3 0.3 5% 1%
0.6 0.6 2% 3% 0.2
0.0 // // 0.0 // // Global Trailer Magazine,
2012 2017 2021 2012 2017 2021 June 2017
3 4 5
Europe Americas Asia-Pacific-Africa Europe 3 Americas4 Asia-Pacific-Africa5
1 Includes medium duty trucks (6-15 to GVW) and heavy duty trucks 4 NorthAmerica, Brazil, Rest of Latin America
(>15 to GVW) 5 China,
India, Asia Pacific, RoW
2 Includes medium and heavy duty commercial vehicle trailers Source: Roland Berger 2017
3 Western Europe, Eastern Europe, Russia
93 Sustained growth on the back of strong fundamentals
China’s newly implemented truck overload restrictions positively impact truck and trailer
demand in China
Truck overload restrictions Traditional car carrier in China
Implementation of new regulation on truck overload
restrictions (GB1589)
No transition phase permitted
New restrictions on truck and trailer dimensions:
Length of maximum 22.0 meters of truck and trailer
combination
For example, car carriage capacity significantly drops
From c.22 cars per vehicle to 6 – 10 cars per vehicle
Car carriage capacity
depending1
Number of vehicles
The key positive implications for JOST:
Higher number of swivel points in a truck (eg
replacement of rigid with articulated trucks)
22
Replacement demand for existing fleet 6 – 10
Higher focus on quality and safety of couplings Historical Current1
New China policies are expected to provide short- and long-term support to the market
1Semitrailer with a capacity of 6 cars; drawbar trailer with a capacity of 10 cars
Source: Roland Berger 2017
104 High aftermarket content and high diversification by customer and geography
High resilience due to high customers fragmentation and leading AM business
High customer fragmentation Attractive AM opportunity
51%
Product
Other
Fifth Landing
Top 25 Wheel Gear
customers
represent
49% of sales¹
AM value vs OE3
50% 200 – 300%
Average customer relationship of more than 30 years1, 2
51
51
51
46
46
46
46
46
AM % of JOST sales
42
41
31 ~25% AM and
31
30
Trading
28
23
21
13
9
Ø 33 years 7
6
~75% OE sales
Pre-1980 1980s 1990s 2000s
1 Including Brazil JV
² Top 20 customers with average relationship of 33 years represent 45% of sales
3 Value based
115 Flexible and asset light business model
Ability to quickly adapt to changing market environment due to asset light and efficient
supply and production platform
Key parts of the value chain
Number of variants1
20 100 100 1,500 On demand
High capex
Purchased Mech.
Stage Design/ Forging and Quality Logistics
materials/ processing/ Coating Assembly Painting Vehicle assembly
engineering casting control integration
pre-products machining
Outsourced/Not focus Focus area
Robotics applied
Employees located in low cost countries Purchasing from low cost countries4
Share of employees by plant location Share of purchasing by region
Low cost Low cost
countries2 regions4
High cost High cost
46% 47%
countries3 regions4
54% 53%
1 On the example of fifth wheel
2 Low-cost countries include Russia, Poland, Hungary, Portugal, South Africa, China, India
3 High-cost countries include Germany, France, Spain, Italy, UK, The Netherlands, Australia, USA, Singapore and Japan
4 High-cost regions include Western Europe and North America; Low-cost regions include Eastern Europe, Asia and Brazil
126 Industry-leading margins and cash generation profile
JOST has continuously outperformed the truck market since 2003 showing high profitability
and strong cash generation
JOST's performance over time Strong margin resilience High cash flow generation
Indexed to 2003 Adjusted EBITDA margin (%)
400 Trailer acquisition Cash
conver- 72.6% 60.9% 76.4%
JOST affected by inverse FX development
13.5% 15.0% sion2
350 60
11.9% 12.3%
300 51
47
250
200
150
Cash
100 flow2
Market uplift mainly due to increase in
50 Chinese production
0
2006
2008
2009
2004
2005
2003
2007
2016
2010
2014
2015
2013
2012
2011
2008
2009
2010201120122013201420152016 2009 2010 2011 2012 2013 2014 2015 2016 Q1-17 2014 2015 2016
JOST sales
Truck Trailer volume (JOST-weighted)¹
JOST has continuously outperformed the truck market since 2003
1 Weighted by approximate weight of truck and trailer revenues
2 Cash flow defined as Adjusted EBITDA-Capex and cash conversion defined as (Adjusted EBITDA-Capex) / Adjusted EBITDA
13Key financials
149M 2017 best first nine months in JOST’s history with strong improvement in
margins across all regions
Sales split by geography1 (€m) 9M 2017 commentary
CAGR: 10.8%/3.6%2 9.5%
650 % growth 634 % growth % growth
533 Record 9M sales performance,
516 15.2% 4.4% 487
47.1% Growth driven by high activity
37.7% (15.5%)
6.0% level in APA and recovering truck
market in North America
25.3% (0.0%) 2.0%
FY2014A FY2015A FY2016A 9M 2016 9M 2017
Adjusted EBIT split by geography3 (€m) 9M 2017 commentary
Adj. EBIT
11.4% 9.6% 9.8% 10.6% 12.0%
margin (%)
Adj. EBIT grew by 24% resulting in
59 % margin 62 % margin 62 % margin % margin 64 % margin
margin expanding to 12% in 9M
51 15.8%
15.4% 15.0% 15.4% 15.4% 2017
2.2% 6.1% 9.6% 10.7%
8.8%
12.2% 9.0% 8.3% 9.4% 10.6%
Main reasons: completed
integration of axle business,
efficiency improvements,
FY2014A FY2015A FY2016A 9M 2016 9M 2017 favorable mix effects and
Europe North America Asia-Pacific-Africa Brazil JV4 operating leverage benefits
¹ Sales split by origin
2 CAGR assuming MBTAS reflected in 2014 sales
3 Adjusted EBIT split by origin, including pro-rata net income from Brazil JV
4 Pro-rata net income from Brazil JV not allocated to segments and therefore shown separately
15Strong cash generation profile supported by low capex spend and disciplined
working capital planning
Key financials overview
Cash
conversion1 72.6% 60.9% 76.4% 78.4% 88.3%
Cash flow1 (€m)
Highly capital efficient business
model with strong cash conversion
60 68 and attractive ROCE
51 47 50
FY2014A FY2015A FY2016A 9M 2016 9M 2017
Capex
(% of sales) 3.7% 4.7% 2.9% 2.8% 1.7%
Capex2 (€m)
Total Edbro/SAP Lower capex level in 9M 2017 due to
30
capex Axles phasing. Significant portion of
of investments will take place in Q4
19 €30m 18 14 9 2017
FY2014A FY2015A FY2016A 9M 2016 9M 2017
NWC
20.3% 16.8% 19.4% 21.6% 20.2%
Net working capital
(% of sales)
105 109 123 137 137
Net working capital stable despite
(€m)
78 88 90 97 114
87 93 90 85 91 higher sales, resulting in improved
(45 ) NWC ratio
(59) (72) (58) (68)
FY2014A FY2015A FY2016A Sep 30, 2016 Sep 30, 2017
Inventories Trade receivables Trade payables
1 Cash flow defined as adjusted EBITDA – capex; cash conversion defined as (adjusted EBITDA – capex)/adjusted EBITDA
2 Capex calculated as payments to acquire property, plant and equipment as well as intangible assets
Source: Company information
16Balance sheet strengthened
Balance sheet as at September 30, 2017 Shareholder structure
610 610
Noncurrent Equity Equity ratio
assets 195
32.0%
NIBC Bank
337 13%
Noncurrent Interest-bearing
liabilities loans
Black
178 Maturity: 2022 Diamond
Interest rateHighlights 9M 2017
Listing on Frankfurt Sales +10% to €533m
stock exchange
Adj. EBIT +24% to €64m
4.875m new shares issued
Placement price €27.00 Adj. net income +76% to €41m
€132m raised from capital increase
+41% share price increase by end of Q3 2017 Equity ratio 32%
Attractive new Outlook 2017
financing raised
€180m term loan raised, maturing in 2022 High single-digit sales growth rate
Significantly reduced leverage and interest Moderate double-digit adj. EBIT growth rate
expenses
18Outlook 2017 – raised
FY 2016 2016 Outlook 2017 Outlook 2017
(€m) (% of sales) (old) (new)
Mid single digit High single digit
Sales 634
growth growth
High single digit Moderate double
Adjusted EBIT (% margin) 62 9.8%
growth digit growth
Capex1 (% of sales) 18 2.9% 2.0 – 2.5% of sales 2.0 – 2.5% of sales
Net working capital (% of sales) 123 19.4%Appendix
20Reconciliation of adjusted earnings 9M 2017
Key financials Key highlights
Adjustments to EBIT mainly
18.9 63.8 from D&A of PPA
Reconciliation of
adj. EBIT (€m)
1.0 2.7
Further adjustments from
41.2
costs associated with the
stock listing
Reported EBIT Exceptionals Stock listing D&A from PPA Adj. EBIT
63.8 (10.5) For comparability the
adj. net income (€m)
Reconciliation of
(12.8) adjusted net income excludes
shareholder loan (SHL) effects
40.5
on net finance result and
income taxes
23.0
Shareholder loan fully
Adj. EBIT Finance result Taxes excl. SHL Adj. net income Adj. net income
converted prior to stock
excl. SHL effects effects 9M 2017 9M 2016 listing on July 20th
21Group’s sales and adjusted EBIT by quarter
Sales (€m) Adj. EBIT (€m)
25,0 25,0
180,5 181,4 22,5
176,6 21,8
172,1 171,5
167,4 165,5 20,6
157,3 19,4 19,5
149,4 20,0 20,0
148,5 147,0
17,8
16,8
14,6
15,0 14,1 15,0
10,4 10,4 12,4%
12,0% 12,0%
10,0 11,0% 11,4% 10,0
10,6%
10,1%
9,3% 9,4%
7,0% 7,1%
5,0 5,0%
0,0 0,0%
Q1 Q2 Q3 Q4 Q1 Q2 Q3 Q4 Q1 Q2 Q3 Q1 Q2 Q3 Q4 Q1 Q2 Q3 Q4 Q1 Q2 Q3
2015 2016 2017 2015 2016 2017
Typical seasonality has not been as pronounced in Q3 2017 as in previous years
22Organic sales development
Sales 9M (€m) Sales Q3 (€m)
Sales growth (%) 9.3% 0.2%
16.5% -1.7%
1
45
533
25 (3) 171
487
149
Sales Organic sales FX translation Sales Sales Organic sales FX translation Sales
9M 2016 growth effects 9M 2017 Q3 2016 growth effects Q3 2017
23Adjusted consolidated statement of income
Profit & loss statement adjusted for exceptionals, PPA and shareholder loan effects
(€m) FY2014A FY2015A FY2016A 9M 2016 9M 2017 %
Sales 516.3 649.8 633.9 487.0 533.3 10%
Cost of sales (376.2) (485.2) (456.1) (355.6) (384.9) 8%
Gross profit 140.1 164.6 177.9 131.4 148.4 13%
Selling expenses adj. for PPA (45.7) (52.5) (56.9) (42.1) (44.3) 5%
R&D expenses (7.6) (9.4) (10.7) (7.8) (7.7) -1%
Administrative expenses (35.6) (55.5) (54.4) (33.8) (37.7) 12%
Other income / expenses (1.1) 4.4 1.1 0.4 (0.2)
Share of JV profit 2.7 1.4 1.4 1.0 1.6 69%
Exceptionals 6.0 9.1 3.6 2.4 3.7 53%
Adj. EBIT 58.8 62.2 61.9 51.5 63.8 24%
% of sales 11.4% 9.6% 9.8% 10.6% 12.0%
Adj. Net finance result (8.3) (17.8) (19.6) (18.2) (10.5) -43%
Adj. Profit before tax 50.5 44.4 42.3 33.3 53.3 60%
Adj. Income taxes (10.2) (15.2) (10.6) (10.3) (12.8) 25%
Adj. Consolidated net income 40.4 29.2 31.7 23.0 40.5 76%
24Consolidated statement of income
Profit & loss statement
(€m) FY2014A FY2015A FY2016A 9M 2016 9M 2017
Sales revenues 516.3 649.8 633.9 487.0 533.3
Cost of sales (376.2) (485.2) (456.1) (355.6) (384.9)
Gross profit 140.1 164.6 177.9 131.4 148.4
Selling expenses (1.2) (81.0) (82.1) (61.0) (63.2)
Research and development expenses (7.6) (9.4) (10.7) (7.8) (7.7)
Administrative expenses (35.6) (55.5) (54.4) (33.8) (37.7)
Other income / expenses (1.1) 4.4 1.1 0.4 (0.2)
Share of profit of loss of equity method investments 2.7 1.4 1.4 1.0 1.6
Operating profit (EBIT) 97.4 24.6 33.1 30.2 41.2
Net financial result (47.1) (75.5) (35.2) (28.5) (144.4)
Profit before tax 50.2 (50.9) (2.1) 1.7 (103.2)
Income taxes (21.9) (1.2) (13.1) (9.6) 27.6
Consolidated net income for the year 28.3 (52.1) (15.2) (7.9) (75.6)
Non-controlling interests (0.0) 0.0 0.0 0.0 0.0
Profit attributable to owners of the parent 28.3 (52.1) (15.2) (7.9) (75.6)
25Global leadership
JOST’s leading market positions – focus on fifth wheel and landing gear
JOST has a leading market position in Vehicle Interface systems
Market shares by sales in OE business by geography
Fifth wheel JOST position Landing gear JOST position
Global 54% 46% 1 Global 56% 44% 1
Europe 1 78% 22% 1 Europe 84% 16% 1
Americas Americas
excl Brazil
2 27% 73% 2 excl Brazil
62% 38% 1
3
Asia-Pacific 47% 53% 1 Asia-Pacific 31% 69% 1
Global 53% 47%
4 Europe 82% 18%
Brazil 58% Americas…
42%
Asia-Pacific
26% 147% 74%
Brazil 53% 43% 57% 1
Brazil 58% 42%
JOST Others
JOST is the global leader in fifth wheel and landing gear
1 Includes the following countries: AUT, BEL, DEN, FIN, FRA, GER, ITA, NED, NOR, POR, ESP, SWE, CH, UK, CRO, SRB, BLR, BGR, CZE, EST, HUN, LAT, LTU, POL, ROM, SVK, SVN, TUR, UKR
2 Includes the following countries: CAN, MEX, USA, COL, ECU, VEN, ARG
3 Includes the following countries: IDN, MYS, THA, PHL, KOR, JAP, AUS, PAK, TWN, IND, CHN, DZA, EGY, MOR, TUN, SAU, UAE, other MEA
4 Including Brazil JV
26
Source: Roland Berger 2017You can also read