Q3 2018 Operations Report - Contents

 
CONTINUE READING
Q3 2018 Operations Report - Contents
Q3 2018 Operations Report

NYSE: DVN devonenergy.com

Contents                    Key Messages     2    STACK                        15
                            Outlook          3    Rockies                      18
                            Modeling Stats   7    Eagle Ford & Barnett Shale   19
                            Q3 Results       8    Heavy Oil                    20
                            Delaware Basin   11
Q3 2018 Operations Report - Contents
Disciplined Growth Strategy

       KEY STRATEGIC OBJECTIVES                    KEY ACCOMPLISHMENTS IN 2018

 1        Fund high-return projects        U.S. oil growth ahead of plan (+200 basis point vs. budget)

 2        Generate free cash flow
                                           No change to capital spending outlook

                                           Corporate cost savings: ~$475 million/year
 3        Maintain financial strength
                                           Operating cash flow accelerates in Q3 (+61% YoY)

 4        Return cash to shareholders      Reduced consolidated debt by >40%

                                           Repurchasing ~20% of outstanding stock

                                           Raised quarterly dividend 33%

     | Q3 2018 Operations Report                                                                     2
Q3 2018 Operations Report - Contents
2018 Outlook: U.S. Growth Initiatives Ahead of Plan
                                                         U.S. growth exceeding expectations YTD
                            KEY MESSAGES                 2018e oil production growth rates (retained assets)
                                                                                                                                      +17%
                                                                                                                                      (vs. 2017)
   U.S. oil growth to accelerate into 2019

   No change to activity with higher pricing                           +15%

                                                                                              +200
                                                                      (vs. 2017)

   Generating free cash flow ($249 million in Q3)
                                                                                             Basis Points
                                                                  Original Budget                                               Current Outlook
No change to capital spending plans
2018e E&P capital                                          U.S. Oil Production (MBOD)                      2018e              2017                  %

                                           U.S. ASSETS        Delaware Basin                                  42                30

                                             90%
                                                              STACK                                           32                25
  CANADA                                                      Rockies                                         15                10

   10%                    $2.4B                               Eagle Ford
                                                              Other
                                                                                                              28
                                                                                                              6
                                                                                                                                34
                                                                                                                                6
                            2018e E&P                      Total retained assets                             123               105                 +17%
                             CAPITAL                       Divested assets (sold or to be sold)               9                 11
                                                           Total reported oil production                     132               116                 +13%

                                                                         FOR ADDITIONAL DETAILS ON ASSET DIVESTITURES – SEE PAGE 10

         | Q3 2018 Operations Report                                                                                                                      3
Q3 2018 Operations Report - Contents
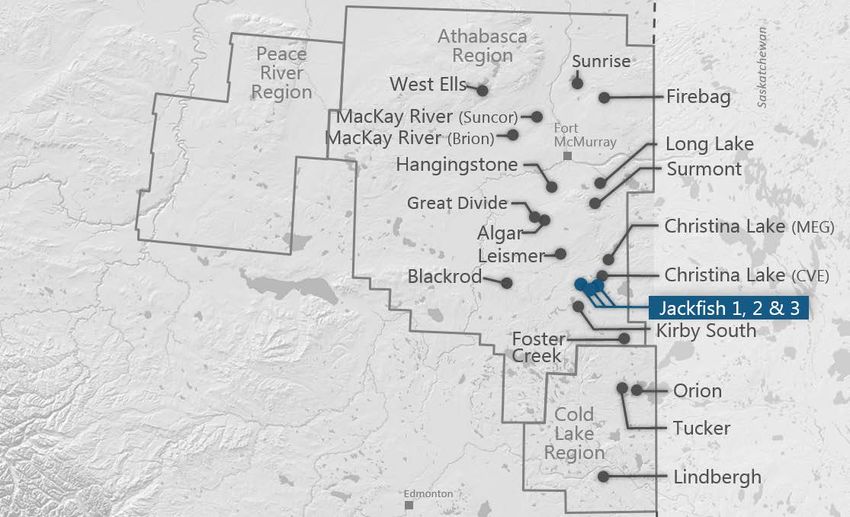
2019 Preview: Keeping Our Discipline

  $         OPTIMIZED
            FOR RETURNS
                                                   OIL
                                                   GROWTH
                                                                                                 SHARE
                                                                                                 REDUCTION

E & P C A P I TA L P R O G R A M   U . S . R E TA I N E D A S S E T S           O U T S TA N D I N G S H A R E S

$2.4-$2.7 Billion                  15%-19% Growth                               ~20% Reduction
POSITIONED FOR                     D R I V E N BY LO W - R I S K                 ENHANCING PER-SHARE
F R E E C A S H F LO W             D E V E LO P M E N T P R O G R A M            C A S H F LO W G R O W T H

                                                                        KEY MESSAGES
                                                                 U.S. resource plays account for ~90% of capital

                                                                 Delaware Basin top-funded asset in portfolio

                                                                 STACK & Rockies key contributors to oil growth

    | Q3 2018 Operations Report                                                                                     4
Q3 2018 Operations Report - Contents
Executing the Multi-Year Business Plan
                                                                                                 2018e             Multi-Year Targets
                                                                                                                           (2017-2020)

                               U.S. oil production                                                                 +15% – 17% CAGR
                                                               (retained assets)           17% YoY growth

                        Total BOE production                                                                       +5% – 7% CAGR
                                                               (retained assets)        9% YoY growth in U.S.

                         Per-unit cost savings                                                                     >20% by 2020
                                                        (G&A, interest & LOE)          G&A/interest: ↓$475 MM

                                   Cash flow growth                                                                >20% CAGR
                                                                                      Trending above 3-year plan    (on a per-share basis)

               Net debt to EBITDA ratio                                                                            ~1.0x – 1.5x
                                                                                        >40% decrease in debt

                                Excess cash inflow                                                                 $6 – $8 billion
                                 (Free cash flow + divestiture proceeds)               ~$5 billion by year end

                  Note: Assumes $65 WTI, $3 Henry Hub and current WCS strip pricing      Exceeding 2018 plan

                                                                                         On track with 2018 plan

  | Q3 2018 Operations Report                                                                                                                5
Q3 2018 Operations Report - Contents
Strategic Deployment of Excess Cash
                                                         Industry leading share-repurchase program
 $4 billion share-repurchase program underway           Average outstanding shares (MM)
    — Represents ~20% of outstanding shares                   527

    — $2.7 billion repurchased to date

                                                                                    ~20%
 Expect program to be completed by Q1 2019                                                                           ~420

 Raised quarterly dividend by 33% in 2018                                          REDUCTION
    — Target cash flow payout ratio: 5% - 10%               Q1 2018        Q2 2018         Q3 2018   Q4 2018e       March 2019e

    — Expect to deliver sustainable dividend growth
                                                         Aggressively deleveraging the balance sheet
 Retired $828 million of upstream debt year to date     Consolidated debt ($B)

    — Reduces interest expense by $66 million annually        $13.0
                                                                             $11.7
    — EnLink sale further deleverages balance sheet                                          $10.4       $10.1

    — Plan to retire maturing debt of $257 million by
      early 2019                                               >40%                                                          $6.0
                                                                                                                        (net debt: $2.9)
                                                               REDUCTION YEAR TO DATE

                                                           Peak 2015         2016            2017    1H 2018 Avg.      Current

      | Q3 2018 Operations Report                                                                                                   6
Q3 2018 Operations Report - Contents
Q3 2018 – Key Modeling Stats & Outlook
KEY METRICS                               Q3 ACTUALS          Q3 2018 - ASSET DETAIL                             DELAWARE              STACK           ROCKIES          EAGLE FORD BARNETT HEAVY OIL
U.S. oil – retained (MBbls/d)                  125            RETAINED PRODUCTION
Canada oil (MBbls/d)                           102            Oil (MBbl/d)                                               44               29                15              31         -        102
NGLs – retained (MBbls/d)                      107            NGL (MBbl/d)                                               19               40                 2              15        30          -
Gas - retained (MMcf/d)                       1,001           Gas (MMcf/d)                                              103               337               18              84       447         11
  Total retained assets (MBoe/d)               500                 Total (MBoe/d)                                        79               126               19              60       105        104
U.S. divested assets (MBoe/d)                   22
Total (MBoe/d)                                 522            ASSET MARGIN (per Boe)
                                                              Realized price                                         $46.80(2)          $31.48            $55.83          $49.44    $17.78    $39.99(3)
LOE & GP&T ($/BOE)                            $9.45           Lease operating expenses                                ($4.90)           ($2.16)           ($6.90)         ($2.34)   ($2.14)   ($9.61)
General & administrative expenses ($MM)       $147            Gathering, processing & transportation                  ($2.01)           ($5.05)           ($1.68)         ($4.92)   ($7.53)   ($3.93)
Financing costs, net ($MM)                     $75            Production & property taxes                             ($3.37)           ($1.71)           ($6.81)         ($2.72)   ($1.24)   ($0.83)
Upstream capital ($MM)                        $523                Cash margin                                         $36.52            $22.56            $40.44          $39.46     $6.87    $25.62

GUIDANCE                                   Q4 2018e           CAPITAL ACTIVTY (Q3 avg.)
U.S. oil – retained (MBbls/d)               127 – 131         Upstream capital ($MM)                                   $198              $167              $29             $35       $15        $60

Canada oil   (MBbls/d)(2)                  110 –   115(1)     Operated development rigs                                  8                 8                 2                        1

NGLs – retained (MBbls/d)                   106 – 110         Operated frac crews                                        2                 2                0.5                       1

Gas – retained (MMcf/d)                    955 – 1,010        Operated spuds                                             25               26                 6                        9

  Total retained assets (MBoe/d)            502 – 524         Operated wells tied-in                                     27               26                 7                        10
                                                              Average lateral length                                   7,000’           9,800’            8,700’                    5,200’
U.S. divested assets (MBoe/d)                13 – 19
Total (MBoe/d)                              515 – 543       (1)    Guidance assumes Jackfish complex curtailments continue throughout December.
                                                            (2)    Includes benefits of regional basis swaps and firm transport in the Delaware totaling $42 million.
Lease operating expense & GP&T ($/BOE)     $9.50 – $9.75
                                                            (3)    Includes benefits of regional basis swaps in Canada totaling $84 million.
Production & property taxes ($MM)           $85 – $95
General & administrative expenses ($MM)    $140 – $160
Financing costs, net ($MM)                  $75 – $85
Upstream capital ($MM)                     $550 – $650
Avg. basic share count outstanding (MM)     450 – 460

          | Q3 2018 Operations Report                                                                                                                                                           7
Q3 Results Headlined by Free Cash Flow Generation
 Total U.S. production exceeds guidance                                                                              Corporate cost structure continues to improve
      — Driven by Delaware Basin & Eagle Ford                                                                                    — G&A declines 42% vs. peak rates
                                                                                                                                 — Borrowing costs reduced 17% vs. Q3 2017
 Firm transport and basis swaps protect pricing
      — Light-oil has access to Gulf Coast markets                                                                    Capital discipline accelerates free cash flow growth
      — Secured NGLs access to Mt. Belvieu (pg. 9)                                                                               — Q3 capital 9% below midpoint guidance
      — WCS swaps protect Canadian cash flow                                                                                     — Generated $249 million of free cash flow in Q3

  Light-oil growth advances                                                 Strong oil realizations across U.S.                                       Achieving improved capital efficiency
  U.S. oil production – retained assets (MBOD)                              U.S. oil realizations as % of WTI                                         Upstream capital

                                                                   125(1)
                                                                            BASIS SWAPS &                                              FIELD-LEVEL
                                                                            FIRM TRANSPORT                                             REALIZATIONS
                                                                                                                                                      Q3 CAPITAL INVESTMENT

                                                                                                        97%                                           $523 million
       101(1)

                               24%                                                                        of     WTI(2)
                            INCREASE                                                                                                                   9% BELOW GUIDANCE
     Q3 2017                                                      Q3 2018
     (1) Excludes divesture assets (see pg. 3 for asset detail)                (2) Includes benefits of basis swaps & firm transport

            | Q3 2018 Operations Report                                                                                                                                              8
Capturing the Benefit of Higher NGLs Pricing
                                                                  Flow Assurance to Premium NGLs Markets
 One of the largest NGLs producers in the U.S.
                                                                                                             STACK
        — Q3 retained NGLs production: 107 MBbls per day
        — Represents ~20% of production mix
                                                                        Delaware
                                                                         Basin                   North
 98% of NGLs have access to Mont Belvieu           markets(1)                                   Texas                    98% of Devon’s volumes
        — >30% premium to Conway pricing (see chart)                                                                       access Mont Belvieu(1)

        — Margins to benefit from contractual rights to recover
          operated ethane production                                                                                      Mont Belvieu

 Legacy contracts lock in below-market fees with no              Advantaged Pricing at Mont Belvieu
  exposure to rising spot rates                                   $/Barrel (Mont Belvieu vs. Conway Pricing)

        — Firm sales contractually guarantee flow assurance       $40                          Mont Belvieu >30% premium
                                                                  $35                          to Conway markets
 Devon possesses excess capacity at Mont Belvieu                 $30

        — ~10 MBbls/day of excess fractionating capacity          $25

                                                                  $20
        — Supports NGL growth plans through end of decade         $15
                                                                                Mont Belvieu        Conway
                                                                  $10
 (1) Represents percentage of operated production                   Jul-2017       Oct-2017       Jan-2018     Apr-2018     Jul-2018     Oct-2018

           | Q3 2018 Operations Report                                                                                                       9
Divestiture Program Accelerates Value Creation
 Resource quality & depth allows for high-grading                         T R A N S A C T I O N D E TA I L S
  of portfolio

 Announced $4.7 billion of divestitures to date
    — Closed EnLink transaction in July ($3.125 billion)            SALES PRICE:              ACCRETIVE MULTIPLE:
    — Upstream asset sales: $1.6 billion                     $3.125 Billion                  12x Cash Flow
    — No incremental cash taxes from transactions
                                                           Next Steps in High-Grading Portfolio
 Expect to exceed $5 billion divestiture target
  around year end
    — Rockies CO2 projects (bids by year end)
                                                                   Rockies CO2
    — Central Basin Platform assets (bids by year end)
                                                            Production: 4 MBOED (~80% oil)
                                                            Data room: Open                     Central Basin Platform
 Continuously evaluating options to further high-                                             Production: 4 MBOED (~45% oil)

  grade upstream portfolio                                                                     Data room: Open

     | Q3 2018 Operations Report                                                                                                10
Delaware Basin – Q3 2018 Results
                                                                                                                     Q3 Production Outperforms Guidance(1)
 Production increased 45% year over year(1)                                                                         Retained production (MBOED)                                                              79
                                                                                                                                                                                                      (Q3 Guide: 70-75)(1)
       — 4,000 BOE per day above top end of guidance                                                                                                                                     76

       — Oil and liquids reach 78% of product mix                                                                              45% GROWTH
                                                                                                                               YEAR OVER YEAR
                                                                                                                                                                      61
 “Step-change” improvement in 2018 well results                                                                                                   57
                                                                                                                               55
       — >70% improvement in productivity vs. 3-year avg.
       — Driven by focused program in state-line area
                                                                                                                           Q3 2017               Q4 2017         Q1 2018               Q2 2018            Q3 2018

 Q3 performance driven by strong well productivity                                                                  Delaware Well Productivity Reaching Record Highs
                                                                                                                     Average Cumulative Oil Production Per Well (MBOD)
       — Top 10 wells achieved IP30: ~3,400 BOED (60% oil)
                                                                                                                     150                2018
       — Driven by prolific Wolfcamp results (see pg. 12)                                                                               2015-2017 avg.
                                                                                                                     100
 Effectively mitigating inflation pressures
       — Per-unit LOE declined 8% vs. Q2 2018
                                                                                                                      50
                                                                                                                                                                           >70% IMPROVEMENT
                                                                                                                                                                           2018 VERSUS 3-YEAR AVERAGE
       — Capital in line with budget expectations YTD                                                                  0
                                                                                                                           1        2        3      4      5      6         7      8       9     10         11        12
 (1) Production and guidance range adjusted for “Mi Vida” and other non-core asset divestitures (~3 MBOED impact).                                             Months Online

              | Q3 2018 Operations Report                                                                                                                                                                        11
Delaware – Wolfcamp Program Delivers Prolific Results
 Well productivity at Seawolf trending above plan                                                                 WOLFCAMP DEVELOPMENT PROGRAM BUILDING MOMENTUM

             — Wolfcamp sweet spot in southern Lea County
                                                                                                          Current Projects                                                                 Q3 WOLFCAMP WELLS(1)
             — Avg. IP30: 3,700         BOED(1)     (represents 5 of 12 wells)
             — Peak rates for remaining 7 wells expected in Q4
                                                                                                          Development Areas
                                                                                                                                                                                          ~4,000                        AVG. 30-DAY IPs
                                                                                                                                                                                                                        BOED

                                                                                                                                                 COTTON DRAW

 Lusitano derisks Cotton Draw Wolfcamp potential                                                                                                                                                   Flagler
                                                                                                                                                                                                     Drilling
                                                                                                Lusitano                                                                                             Peak rates: mid-2019
             — 6-well project testing Leonard and Wolfcamp                                       2 Wolfcamp wells online
                                                                                                 Avg. IP 30: 4,600 BOED/well
             — Wolfcamp wells avg. IP30: 4,600 BOED (50% oil)                                                                                                                                             Seawolf
                                                                                                                                                                                                          5 of 12 Wolfcamp wells online
                                                                                                                                                                                                          Avg. IP 30: 3,700 BOED/well(1)
                             Seawolf Development - Rattlesnake Area
 SPRING
  BONE

               3rd

               XY
                                                                                                              New Mexico
                  UPPER
  WOLFCAMP

                                                                                                                                              Fighting Okra
                                                                                                                  Texas                        Completing                                                                 RATTLESNAKE
                  MIDDLE

              A                                                                                                                                Peak rates: 1H 2019
                                                                        Peak Rates: Q4 2018
                  LOWER

                                                  Avg. IP30: 3,700 BOED(1)                    (1) Includes two appraisal wells (avg. lateral 5,700’) that were normalized for 10,000’ at a 1.75 multiplier.

                  | Q3 2018 Operations Report                                                                                                                                                                                  12
Delaware – Infrastructure Supports Profitable Growth
 Premium oil pricing and flow assurance                           Positioned for flow assurance & premium pricing

    — Q3 oil realizations: 97% of WTI(1)                                     FLOW ASSURANCE PLAN                                               STRONG PRICE REALIZATIONS

    — Swaps & firm transport protect ~75% of 2019 oil               Firm transport: ~20 MBOD on Longhorn                                   BASIS
                                                                                                                                            SWAPS                                FIELD-LEVEL
                                                                                                                                                                                 PRICING
    — Firm oil sales contracts guarantee in basin flow assurance    Firm sales(2): 100 MBOD in basin
                                                                                                                                                      Q3 RESULTS
       (100 MBOD of contractual capacity in basin)                  Established local refinery relationships                                            97%
                                                                                                                                                         OF WTI(1)
 NGLs have firm transport to Mont Belvieu (see pg. 9)              ~85% of oil gathered on pipe

                                                                    >90% of produced water on pipe
    — Revenue improves ~30% vs. Q2 2018                                                                                                                      LONGHORN
                                                                                                                                                             (FIRM TRANSPORT)
                                                                   (1)     Includes benefits of basis swaps and firm transport to Gulf Coast
                                                                   (2)     Long-term guaranteed contractual capacity with firm transport partners

 Swaps protect gas production through 2019
                                                                     Improved infrastructure driving lower costs
 Infrastructure drives sustainable cost savings                     LOE & Transportation Expense ($/BOE)
                                                                           $17.20
    — Operating costs improved ~60% vs. peak rates
                                                                                                      $14.21
    — Oil and produced water gathered on pipe (avoids trucking)
    — Operate ~50 disposal wells and 8 water reuse facilities                ~60%                                               $9.54               $9.03
                                                                                                                                                                              $6.91
                                                                             IMPROVEMENT
    — 80% of water used in operations is recycled
                                                                          Q1 2015                     2015                      2016                 2017                     Q3 2018

                                                                         Note: 2015-2017 costs are pro forma for revenue recognition accounting rules recently implemented.

       | Q3 2018 Operations Report                                                                                                                                                 13
Delaware Basin – Raising Growth Outlook
                                                               High-return oil growth positioned to accelerate
 Raising 2018 production growth estimates                     Retained production (MBOED)
                                                                                                                                                          ~40% oil growth
    — Increasing 2018 exit rate growth: ~90 MBOED(1)                  RAISING GUIDANCE
                                                                                                                                                                  (vs. 2018)

    — Non-core divestitures: 3 MBOED impact to Q4                  >5 MBOED vs. plan(1)                                 ~90(1)
    — Activity to reach 10 operated rigs around year end
                                                                                72(1)

 Ramping-up capital investment in 2019
    — Delaware is top-funded asset by a wide margin                          2018 YTD                                 2018e Exit                                  2019e

    — Capital investment: up to $1.0 billion
                                                               (1) Production and guidance range adjusted for “Mi Vida” and other minor non-core asset divestitures (~3 MBOED impact).

    — Oil production growth: ~40% vs. 2018                                2019 PREVIEW: ACCELERATING TODD 2ND BONE SPRING PROGRAM

    — Per-unit LOE to decline 10% to 15%                               2018 Activity                         Todd                                          Bone Spring Focus Area
                                                                       Focus Area                                                                          (Drill >20 wells next year)

 Accelerating Todd 2nd Bone Spring program                            Upcoming wells

    — Two Boundary Raider wells delivered highest rates
      in Delaware history (IP24: 24 MBOED)
                                                                                Two Boundary Raider Wells
    — Drill >20 wells in focus area over next year (see map)                    IP24: 24,000 BOED

                                                                               Eddy                                                                         Lea

      | Q3 2018 Operations Report                                                                                                                                                 14
STACK – Initial Infill Spacing Results
 Q3 net production up 16% year over year                                                            Initial Infill Spacing Results

    — Dewey County assets sold in Q3 (~7 MBOED)                          Current Projects                 Showboat
                                                                         Devon Acreage                    12 wells/unit (avg. lateral: 7,000’)

    — NGLs up ~30% with benefits of Mont Belvieu pricing                                                  Avg. 90-Day IP: 800 BOED

    — Total volume growth limited by infill pilot performance                       Coyote
                                                                                    7-well development project
    — Capital efficiency improves (spending 31%↓ vs. 1H 2018 avg.)                  Avg. 90-Day IP: 3,100 BOED                                   Bernhardt
                                                                                                                                                  8 wells per drilling unit
                                                                                                                                                 Avg. 30-Day IP: 1,300 BOED

 Infill activity accelerates D&C capital efficiencies                                                       Horsefly
                                                                                                             10 wells per drilling unit
                                                                                                             Avg. 30-Day IP: 1,475 BOED
    — Horsefly costs reduced to ~$7.5 million per well
    — Bernhardt achieves >30% savings vs. parent (~$7MM/well)
                                                                     Drilling Days Reduced                                  Significant Capital Savings
                                                                     Extended reach laterals                                Bernhardt D&C costs vs. parent well
 Pilots testing higher-density spacing not optimized
                                                                                                                                                                    DRILLING
                                                                                                                                                                    (32% of well cost)
    — Showboat upside test underperforms vs. plan (12 wells/unit)    ~35 Days

    — Horsefly delivered improved results (10 wells/unit)                              19
                                                                                                                                         >30%
    — Bernhardt rates limited by flowback strategy (8 wells/unit)                                       16                                  SAVINGS
                                                                                                                                            PER WELL
    — Lighter-spaced Coyote project delivers best results
                                                                                                                                                                    COMPLETIONS
                                                                      Parent        Horsefly        Bernhardt                                                       (68% of well cost)

         | Q3 2018 Operations Report                                                                                                                                   15
STACK – Next Steps to Optimize Development Returns
 Learnings from high-density infill tests                                                     UPCOMING STACK DEVELOPMENT ACTIVITY
    — Initial results indicate spacing was too tight                                                                                               Kingfisher
                                                                     Developments Online                              Showboat
    — Flowback approach key for oil recoveries                       Upcoming Developments                            12 wells per unit

    — Upper Meramec delivered best well results                                                 Coyote
                                                                                                                                          7

                                                                                                7-well project                                     5   6
                                                                                                                                          9
    — Vertical communication observed                                                                                               8
                                                                                                                                         12
                                                                                                                                                           1   2

                                                                                                                                                       11
    — Substantial D&C savings achieved (pg. 15)                                                                                                                            4            3
                                                                                                                                                   Bernhardt
                                                                                                           Horsefly                           10   8 wells per unit

 Reverting to “base case” spacing to optimize returns                                                     10 wells per unit

    — Upcoming activity targeting 4-8 wells per unit               Custer                                                                                  UPCOMING ACTIVITY

    — Well placement focused in Upper Meramec                                         Blaine
                                                                                                                                Canadian                   4-8 wells UNIT
                                                                                                                                                                     PER

    — Flowback adjusted to improve performance                 1   Geis                        2   Safari                      3        Whiskey Jack                  4    Shangri-La
                                                                   7 wells per unit                4 wells per unit                     5 wells per unit                   5 wells per unit
                                                                   Flowing Back                    Online Q4 2018                       Online Q4 2018                     Online Q4 2018

 Project IRRs to benefit from less capital intensity          5   Pony Express                6   Northwoods                  7        Scott                         8        Doppelganger/Kraken
                                                                   4 wells per unit                4 wells per unit                     6 wells per unit                       8 & 7 wells per unit
    — Utilizing tailored, more capital efficient completions       Online Q4 2018                  2019 project                         2019 project                           2019 project

                                                                   Morning Thunder 10 ML Block                                          Brachiosaurus                      Minnie Ha Ha
    — Projects to benefit from less infrastructure capital     9
                                                                   4 wells per unit                8 wells per unit
                                                                                                                               11
                                                                                                                                        4 wells per unit
                                                                                                                                                                      12
                                                                                                                                                                           6 wells per unit
                                                                   2019 project                    2019 project                         2019 project                       2019 project
      on centralized facilities

       | Q3 2018 Operations Report                                                                                                                                                           16
STACK – Outlook
 Upcoming activity highly accretive to corporate                       PRODUCTION GROWTH TO RESUME IN 2019
  return targets                                       Retained production (MBOED)

    — Q4 activity: 20 to 25 new wells online                                             KEY ITEMS IMPACTING Q4
                                                                                         Asset sales: ~7 MBOED                  135 - 140
    — Re-establishes growth trajectory by year end                                       Spacing pilots: ~5 MBOED

 Positioned for production growth in 2019                                                               125(1)
                                                                                                                     120 - 125
    — 2nd highest funded asset in portfolio
    — Capital investment: $500-$700 million                          104(1)

    — Expect to bring online 70-90 wells
    — Targeting 4-8 wells per drilling unit                          2017                             2018 YTD        Q4 2018e     2019e
                                                       (1) Production adjusted for recent Dewey County asset sale.

 Significant growth inventory remaining
    — 130,000 net acres in over-pressured oil window                                                        KEY MESSAGES
    — Acreage position >90% undeveloped                 Growth trajectory re-established by year end
    — Meramec inventory risked at 6 wells per unit      Upcoming infill projects recalibrated to optimize IRRs
    — High-quality Woodford optionality                 D&C costs expected to further decline in 2019

       | Q3 2018 Operations Report                                                                                                     17
Rockies – An Emerging Growth Opportunity
 Net production increased 17% vs. Q2 2018                                               RECENT POWDER RIVER BASIN ACTIVITY

    — Oil production ~75% of product mix                         Turner
                                                                 Niobrara                                                 RU JFW Fed 13 3X & 4X
    — Powder River barrels receive WTI pricing                                                         Super Mario Area   Avg. 30-Day IP: 1,500 BOED per well

 Accelerating capital activity in 2019                      RU State Fed 2X & 4X
                                                             Avg. 30-Day IP: 1,450 BOED per well
                                                                                                                               Conley Draw 1X
                                                                                                                               Avg. 30-Day IP: 1,300 BOED
                                                                                                                               (~90% oil)
    — Expect to operate 4 rigs by early next year
                                                             RU DILTS Fed 1X & 3X                                               SDU Tillard 1X
    — Represents 2x increase in activity from 2018           Avg. 30-Day IP: 1,050 BOED per well
                                                                                                                               Avg. 30-Day IP: 1,200 BOED
                                                                                                                               (~90% oil)

    — No permitting or infrastructure constraints              PDU WJ Ranch 22
                                                                                                                               SDU Tillard 2X
                                                               Avg. 30-Day IP: 1,100 BOED
                                                               (~90% oil)                                                     Avg. 30-Day IP: 1,650 BOED

 Shifting Super Mario area into development
                                                                                                   Converse                   (~90% oil)

    — ~35 Turner wells planned to spud in 2019             2019 Outlook: Accelerating Activity
                                                           Drilling activity by zone
    — Multi-year Turner inventory (~200 wells)                                                                                                   45-50
                                                                                                                                                 (wells)

 Niobrara provides significant upside potential                                                    Turner
                                                                       2019                        Niobrara                25
    — Initial 3 wells successful (product mix: ~90% oil)             DRILLING                      Other
                                                                                                                          (wells)

    — >10 additional tests scheduled in 2019                         ACTIVITY

    — Net acres: ~200,000 in oil fairway
                                                                                                                          2018e                  2019e

      | Q3 2018 Operations Report                                                                                                                           18
Eagle Ford and Barnett Shale
                         EAGLE FORD OVERVIEW                                                             BARNETT SHALE OVERVIEW

                                                                 10%
 FREE CASH FLOW

      500
                                                                                                                                  2018 Dow JV Activity

 ~$
                                                                OIL GROWTH
 MILLION IN 2018e                                               (VS Q2 2018)

                                                  Dewitt
                                                                                      Divest Details
                                                                                  Sale price: ~$50 million
                                    Q3 Results                                                                Wise                      Denton
                                    20 Eagle Ford Wells                           Production: ~4 MBOED
                                    Avg. 30-Day IP: ~3,000 BOED/Well

 Q3 production averaged 60 MBOED (51% oil)                                     Q3 production averaged 105 MBOED (~30% NGLs)
 Strong well results drive 10% growth vs. Q2                                   Dow JV and refrac activity stabilizing production
     — 20 new wells : IP30 ~3,000 BOED (50% oil)
                                                                                NGL pricing drives margin expansion
     — Completion design contributes to performance

 Free cash flow accelerates (~$500 million in 2018e)                           GP&T expense to decline by ~$90 million in 2019

 Q4 outlook: ~60 MBOED (15 new wells online)                                   Wise County package sold for ~$50 million (Q4 close)

      | Q3 2018 Operations Report                                                                                                                  19
Heavy Oil – Overview & Outlook
 Q3 net production: 104,000 Boe per day
                                                                 SAGD Sweet Spot
    — Jackfish 1 maintenance impact: ~15 MBOD
    — Jackfish 2&3 produced at nameplate capacity
    — LOE per Boe declined 16% vs. Q2 2018

 Full-scale operations restored at Jackfish complex
    — Rates reach ~110% of nameplate capacity in October
                                                             FOR EVERY           INCREMENTAL

 Adjusted November production rates at Jackfish due
  to market conditions (~8 MBOD impact to Q4)
                                                             $
                                                               1
                                                              INCREASE PER BBL
                                                                                 $
                                                                                     40 MM
                                                                                 ANNUALIZED CASH FLOW

    — Previously incorporated in Q4 oil production outlook
       (press release issued 10/16/18)
                                                             Q3 PRODUCTION                              GROSS    NET
 Potential to continue curtailing barrels in December       Jackfish 1 (MBOD)                           20.4    19.4

                                                             Jackfish 2 (MBOD)                           34.9    33.1
    — Decision based on real-time pricing
                                                             Jackfish 3 (MBOD)                           34.8    33.0

 WCS basis swaps protect Q4 cash flow (~$150 MM benefit)    Lloydminster (MBOED)                        20.7    18.3

                                                             Total Heavy Oil (MBOED)                     110.8   103.8

       | Q3 2018 Operations Report                                                                                       20
Heavy Oil – Mitigating Pricing Pressures in 2019
 Actively adding WCS financial swaps in 2019                                   Canadian Heavy Oil Marketing Opportunities
   (21 MBOD at ~$23 off WTI in 1H 2019)
                                                                                                              Jackfish
 Secured firm transport to Gulf Coast                                              WCS Pricing              Edmonton
  (Agreements cover ~10% of production)                                         ~$30 off WTI in 2019
                                                                                                                  Enbridge
 Seeking accretive rail contracts                                                                                Mainline
   (Targeting up to 20% of production)

 Directly connected to Northwest upgrader
   (Limits impact of future apportionments)
                                                                                                                                  PADD 2
 Line 3 expansion in Q4 2019 (+370 MBOD capacity)                                  Rail Opportunities
                                                                                     All in cost: ~$20/BBL
                                                                                                                            Flanagan South
Differentials Narrowing into 2019
                                                                                                                     Cushing
$/Barrel Differential (WCS vs. WTI)
$(50)                                                                                                                    Seaway              Pipelines
                 WCS differential to WTI
$(40)
                                                                                                                                             Rail
                                                                                    Gulf Coast WCS Pricing          Houston
$(30)                                                                                 ~$2 off WTI in 2019
                                           Further improvements
$(20)
                                           expected as industry adds
                                           incremental rail activity
$(10)
        Jun-18              Sep-18             Dec-18         Mar-19   Jun-19

        | Q3 2018 Operations Report                                                                                                                 21
Investor Contacts & Notices
                                                                             additional reserves; the uncertainties, costs and risks involved in oil and gas operations; regulatory restrictions, compliance costs and
 Investor Relations Contacts                                                 other risks relating to governmental regulation, including with respect to environmental matters; risks related to our hedging activities;
                                                                             counterparty credit risks; risks relating to our indebtedness; cyberattack risks; our limited control over third parties who operate our oil
                                                                             and gas properties; midstream capacity constraints and potential interruptions in production; the extent to which insurance covers any
 Scott Coody                            Chris Carr                           losses we may experience; competition for leases, materials, people and capital; our ability to successfully complete mergers, acquisitions
 VP, Investor Relations                 Supervisor, Investor Relations       and divestitures; and any of the other risks and uncertainties identified in our Form 10-K and our other filings with the SEC. Investors are
 405-552-4735                           405-228-2496                         cautioned that any such statements are not guarantees of future performance and that actual results or developments may differ
                                                                             materially from those projected in the forward-looking statements. The forward-looking statements in this presentation are made as of
 Email: investor.relations@dvn.com                                           the date of this presentation, even if subsequently made available by Devon on its website or otherwise. Devon does not undertake any
                                                                             obligation to update the forward-looking statements as a result of new information, future events or otherwise.

                                                                             Use of Non-GAAP Information
                                                                             This presentation may include non-GAAP financial measures. Such non-GAAP measures are not alternatives to GAAP measures, and you
Investor Notices                                                             should not consider these non-GAAP measures in isolation or as a substitute for analysis of our results as reported under GAAP. For
Forward-Looking Statements                                                   additional disclosure regarding such non-GAAP measures, including reconciliations to their most directly comparable GAAP measure,
This presentation includes "forward-looking statements" as defined           please refer to Devon’s third-quarter 2018 earnings release at www.devonenergy.com.
by the Securities and Exchange Commission (the “SEC”). Such
statements include those concerning strategic plans, expectations            Cautionary Note to Investors
and objectives for future operations, and are often identified by use        The SEC permits oil and gas companies, in their filings with the SEC, to disclose only proved, probable and possible reserves that meet
of the words “expects,” “believes,” “will,” “would,” “could,” “forecasts,”   the SEC's definitions for such terms, and price and cost sensitivities for such reserves, and prohibits disclosure of resources that do not
“projections,” “estimates,” “plans,” “expectations,” “targets,”              constitute such reserves. This presentation may contain certain terms, such as resource potential, potential locations, risked and unrisked
“opportunities,” “potential,” “anticipates,” “outlook” and other similar     locations, estimated ultimate recovery (EUR), exploration target size and other similar terms. These estimates are by their nature more
terminology. All statements, other than statements of historical facts,      speculative than estimates of proved, probable and possible reserves and accordingly are subject to substantially greater risk of being
included in this presentation that address activities, events or             actually realized. The SEC guidelines strictly prohibit us from including these estimates in filings with the SEC. Investors are urged to
developments that the Company expects, believes or anticipates will          consider closely the disclosure in our Form 10-K, available at www.devonenergy.com. You can also obtain this form from the SEC by
or may occur in the future are forward-looking statements. Such              calling 1-800-SEC-0330 or from the SEC’s website at www.sec.gov.
statements are subject to a number of assumptions, risks and
uncertainties, many of which are beyond the control of the Company.
Statements regarding our business and operations are subject to all
of the risks and uncertainties normally incident to the exploration for
and development and production of oil and gas. These risks include,
but are not limited to: the volatility of oil, gas and NGL prices;
uncertainties inherent in estimating oil, gas and NGL reserves; the
extent to which we are successful in acquiring and discovering

            | Q3 2018 Operations Report                                                                                                                                                                               22
You can also read