Interim Results 2018 Adrian Littlewood Philip Neutze - Corporate
←
→
Page content transcription
If your browser does not render page correctly, please read the page content below
Interim Results 2018   Adrian Littlewood
                                Chief Executive

                           Philip Neutze
                          Chief Financial Officer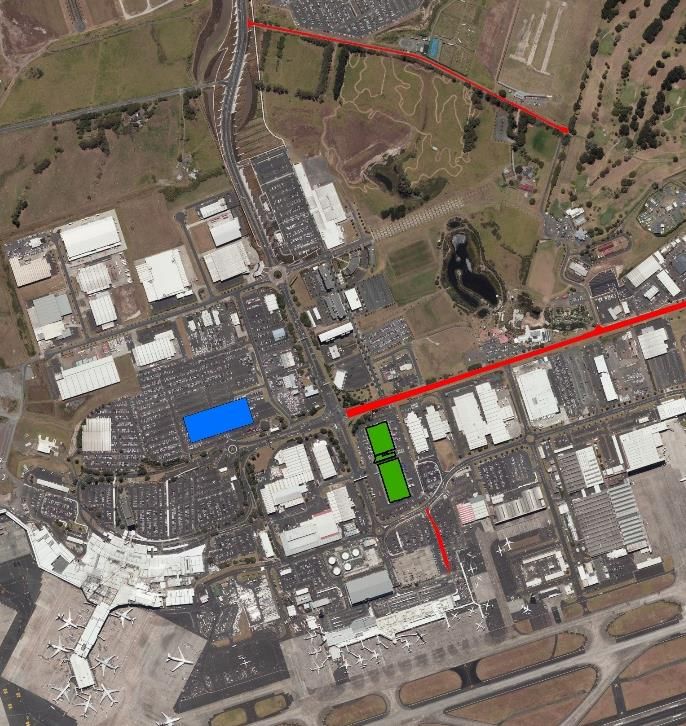
Highlights

               FY18 interim results
             Adrian Littlewood, chief executive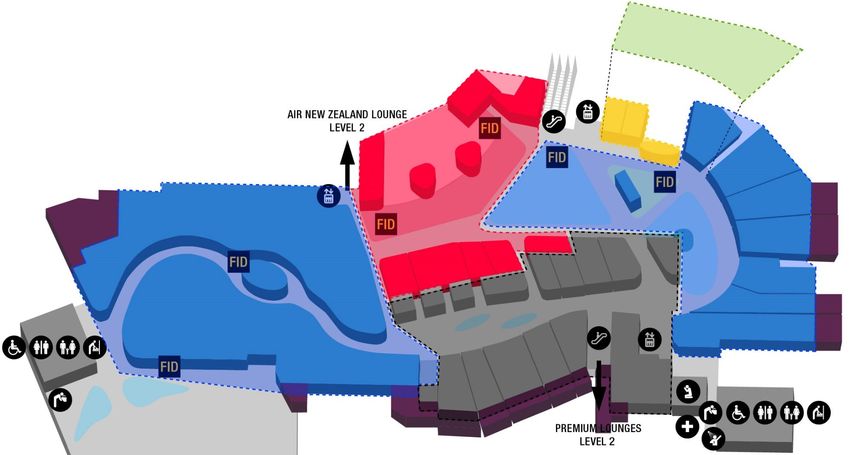
Results at a glance
 2018                Interim Results
   Highlights

                     Revenue                       Passenger movements

                           6.9%          $332.4m      6.4%                10.0m
performance
 Financial

                     Operating EBITDAFI            Aircraft movements
Our continuing
   journey

                           6.0%          $250.1m      4.2%                88,113
                     Underlying profit             Interim dividend per share

                           7.8%          $133.1m      7.5% 10.75           cents

                 3
Highlights
2018 Interim Results
Milestones Key results
Highlights
1 new airline and 4 new routes
International passengers up 5.8%1,
1m 10%
performance
domestic passengers up 7.7%
Financial
Doubled international departures International passengers Growth in retail
border processing and security (excl. transits) in Dec17, revenue
screening space a new monthly record
Our continuing
journey
Opened expanded Duty Free stores
and new Destination stores before the
Christmas peak 39%
Opened Gate 17 on Pier B, increasing Increase in investment Car park revenue
the pier’s capacity by 50% property rent roll2 grew 8.7%
Increasing mobile self-service check-in
kiosk capacity by 33% and international
A$370m
check-in counter capacity up 15%
Completed a number of transport
infrastructure projects including
improved domestic terminal transport Over 2m Queenstown offer received for our
access and new arterial high airport passengers in 2017 investment in NQA
occupancy lanes
4
1) Excluding transits
2) Includes recently announced 65,000m2 Foodstuffs development
performance
Financial

                  FY18 interim results
              Philip Neutze, chief financial officer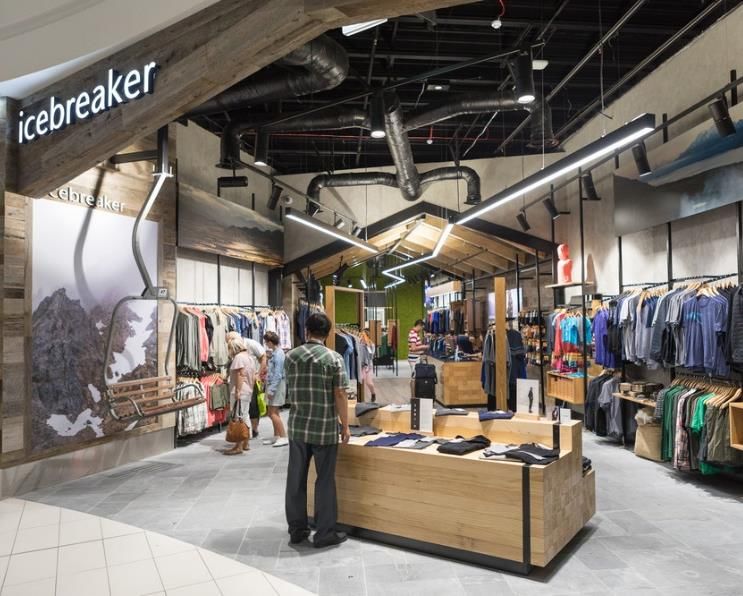
Solid growth in underlying profit
 2018                Interim Results
   Highlights

                      For the 6 months to 31 December (NZ$m)                                                              2017        2016    Change

                      Revenue                                                                                            332.4        310.9     6.9%
performance

                      Expenses                                                                                             82.3        75.0     9.7%
 Financial

                      Earnings before interest, taxation, depreciation,
                      fair value adjustments and investments in associates                                               250.1        235.9     6.0%
                      (EBITDAFI)
Our continuing

                      Share of profit from associates                                                                        4.4        2.6
   journey

                                                                                                                                               11.0%
                      Share of profit of associate held for sale                                                             6.7        7.4

                      Derivative fair value (decrease)/increase                                                            (3.0)        1.5        -

                      Investment property revaluation                                                                      41.5        17.4   138.5%

                      Depreciation expense                                                                                 40.7        37.4     8.8%

                      Interest expense                                                                                     38.6        36.8     4.9%

                      Taxation expense                                                                                     54.5        48.8    11.7%

                      Reported profit after tax                                                                          165.9        141.8    17.0%

                      Underlying profit after tax                                                                        133.1        123.5     7.8%

                 6

                     A reconciliation between reported profit after tax and underlying profit after tax is included in the Appendix
Revenue growth across the business
 2018                Interim Results
   Highlights

                      For the 6 months to 31 December (NZ$m)                2017             2016            Change

                      Airfield income                                       59.9             59.2             1.2%
                      Passenger services charge                             89.1             85.9             3.7%
performance
 Financial

                      Retail income                                         88.9             80.7            10.2%

                      Car park income                                       31.4             28.9             8.7%
Our continuing

                      Investment property rental income                     37.8             32.5            16.3%
   journey

                      Other rental income                                    9.1              8.2            11.0%
                      Other income                                          16.2             15.5             4.5%
                      Total revenue                                        332.4            310.9             6.9%

                     • Aeronautical revenue growth driven by passenger growth and growing runway movements, partly
                       offset by international and regional aeronautical price decreases
                     • Retail income benefitted from continued passenger growth combined with strong Duty Free, Food
                       & Beverage and Strata Lounge performance
                     • Parking revenue increased as ~1,000 new spaces were built in the first half of FY18
                     • Investment property rental income growth was driven by the development of new properties,
                       strong rental growth in the existing portfolio and ibis budget hotel performance

                 7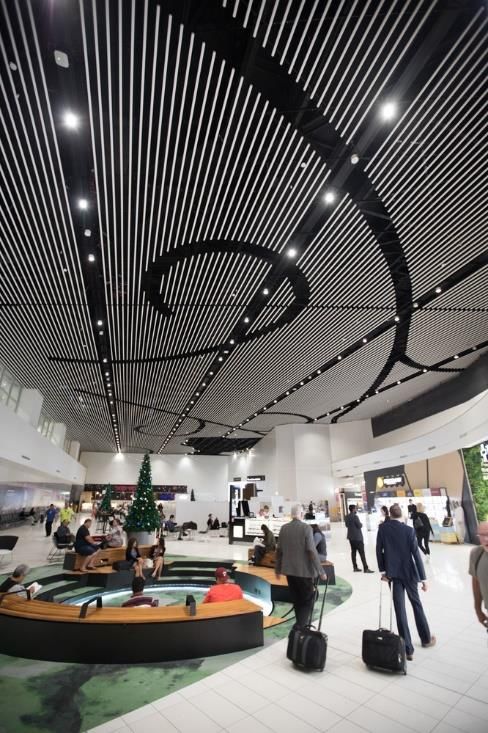
Continued passenger growth
 2018                    Interim Results
   Highlights

                          For the 6 months to 31 December*                                                               2017                      2016                   Change

                          International arrivals                                                                   2,592,506                 2,462,690                        5.3%
performance

                          International departures                                                                 2,477,695                 2,328,885                        6.4%
 Financial

                          International passengers excluding transits                                              5,070,201                 4,791,575                        5.8%

                          Transit passengers                                                                         347,844                    353,978                     (1.7%)
Our continuing

                          Total international passengers                                                           5,418,045                 5,145,553                        5.3%
   journey

                          Domestic passengers                                                                      4,630,922                 4,299,244                        7.7%

                          Total passengers                                                                       10,048,967                  9,444,797                        6.4%

                         • Total passenger growth of 6.4% ahead of aircraft movements up 4.2% as upgauging continued
                           load factors improved
                         • Domestic growth of 7.7% driven by increases in capacity on both main trunk routes and regional,
                           combined with strengthening load factors
                         • International growth of 5.8% (excluding transits) due to increased airline capacity, largely related
                           to Asia and Middle East routes
                         • Transit passengers down 1.7% following the introduction of Santiago direct services to Australia,
                           but this was entirely offset by international passenger growth on direct flights from Santiago to
                           Auckland
                 8

                     •   *Auckland Airport refined its passenger and movements data from August 2016, resulting in a very minor restatement of prior year comparatives. The numbers
                         above are consistent with published monthly traffic data.
Steady growth in movements and MCTOW
 2018                    Interim Results
   Highlights

                          For the 6 months to 31 December*                                                             2017                         2016                   Change

                          Aircraft movements

                          International aircraft movements                                                           27,984                      27,476                       1.8%
performance
 Financial

                          Domestic aircraft movements                                                                60,129                      57,117                       5.3%

                          Total aircraft movements                                                                   88,113                      84,593                       4.2%
Our continuing
   journey

                          MCTOW (tonnes)

                          International MCTOW                                                                    2,907,794                    2,756,353                       5.5%

                          Domestic MCTOW                                                                         1,184,429                    1,121,401                       5.6%

                          Total MCTOW                                                                            4,092,223                    3,877,755                       5.5%

                         • International MCTOW increased 5.5% in the first half of FY18, ahead of aircraft movements as
                           upgauging continued
                         • Domestic growth continued with Air New Zealand and Jetstar increasing frequency and Air New
                           Zealand continuing to add new aircraft

                 9

                     •   *Auckland Airport refined its passenger and movements data from August 2016, resulting in a very minor restatement of prior year comparatives. The numbers
                         above are consistent with published monthly traffic data.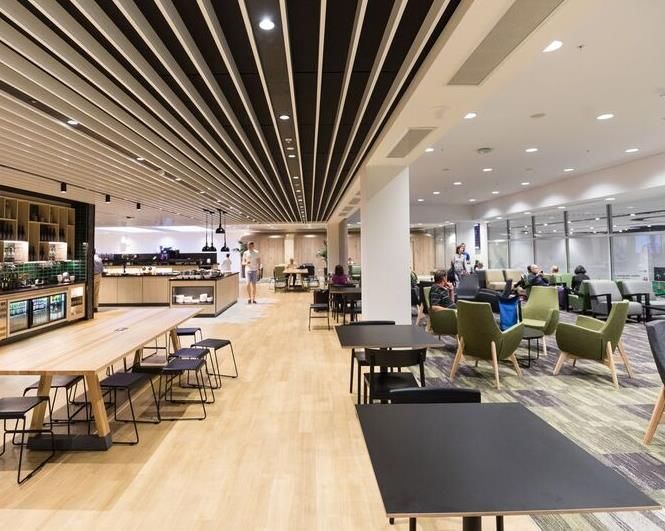
Expenses driven by business growth
 2018                 Interim Results
   Highlights

                       For the 6 months to 31 December (NZ$m)                  2017             2016          Change

                       Staff                                                   27.3              24.9           9.6%

                       Asset management, maintenance and airport operations    31.7              26.1          21.5%
performance
 Financial

                       Rates and insurance                                      6.7               6.1           9.8%

                       Marketing and promotions                                 5.2               7.9         (34.2%)

                       Professional services and levies                         5.7               4.9          16.3%
Our continuing

                       Other                                                    5.7               5.1          11.8%
   journey

                       Total operating expenses                                82.3              75.0           9.7%
                       Depreciation                                            40.7              37.4           8.8%

                       Interest expense                                        38.6              36.8           4.9%

                      • EBITDAFI margin of 75% achieved in the first six months of FY18 whilst investing in staff and
                        airport operations to cater for growth in the business
                      • Staff costs increase driven by 7.4% higher headcount, particularly aeronautical customer
                        services, fire and engineering services as required to maintain category standards
                      • Increased asset management, maintenance and operations in line with our FY18 PSE3
                        forecasts reflecting investment in technology, variable costs to drive revenue growth (Strata
                        Lounge, Park & Ride), increased airside bussing and baggage services
                      • Marketing and promotions reduction due to phasing with spend weighted towards the second
                        half of FY18 to support shoulder/low season services and fewer new airlines starting operations
                 10
                        in the first half of FY18 compared to the prior year
Associates’ performance
2018 Interim Results
For the 6 months to 31 December (NZ$m) 2017 2016 Change
Highlights
Queenstown Airport (24.99% ownership)
Total Revenue 23.2 19.6 18.4%
performance
Financial
EBITDAFI 17.0 13.1 29.8%
Domestic Passengers 751,056 660,231 13.8%
International Passengers 333,439 299,088 11.5%
Our continuing
Underlying Earnings (Auckland Airport share) 2.2 1.5 46.7%
journey
North Queensland Airports (24.55% ownership) AU$m AU$m
Total Revenue (AU$) 79.2 72.8 8.8%
EBITDAFI (AU$) 52.7 47.1 11.9%
Domestic Passengers (Cairns + Mackay) 2,809,637 2,742,480 2.4%
International Passengers (Including transits) (Cairns) 436,787 431,581 1.2%
Underlying Earnings (Auckland Airport share) (NZ$) NZ$6.8 NZ$5.1 33.3%
Novotel Tainui Holdings (40.00% ownership)1
Total Revenue 15.1 13.9 8.6%
EBITDAFI 5.9 5.2 13.5%
Average occupancy 92.3% 91.7%
Average room rate increase 10.1% 10.9%
Underlying Earnings (Auckland Airport share) 2.2 1.0 120.0%
11
1) Novotel ownership increased from 20% to 40% in February 2017, second phase increase to 50% forecast in 2019Our continuing
journey
FY18 interim results
Adrian Littlewood, chief executiveConnecting New Zealand to the world
2018 Interim Results
Routes added since 2015 have connected Auckland with new cities of nearly
Highlights
140 million people
international
30 airlines
performance
international
Financial
46 destinations
domestic
19 destinations
London
Our continuing
Vancouver
journey
Beijing Haneda
Xi’an Tianjin Seoul
Narita San Francisco
Chengdu Osaka Los Angeles
Chongqing Shanghai
Doha Guangzhou Shenzhen Houston
Dubai Hong Kong
ManilaManila Honolulu
Bangkok
Ho Chi Minh City
Kuala Lumpur
Singapore
Bali
9 Pacific Islands
destinations including:
8 Australian
destinations Apia
Buenos Aires
Santiago
Key
= New in 1H18
Plain text = Existing
services
13
Note: Routes launched or announced based on single ticketed fares as at 31 December 2017, excluding the Norfolk Island service which ceased in mid-January 2018.
One stop single ticket destinations include London, Taipei and TianjinStrategic priority:
Growing Travel Markets
2018 Interim Results
Increased capacity and strengthening load factors
Highlights
• Domestic airline capacity grew 5% in the six months to 31 December with increased frequency
to Queenstown, Christchurch and regional destinations. Load factors also improved, largely due
to main trunk services
performance
Financial
• International airline capacity up 5% in the six months to 31 December benefitting from:
– Full period impact of FY17 frequency increases and 4 new airlines (Qatar, HK, Hainan, Tianjin)
Our continuing
– New services to Haneda, Xi’an, Manila (from Dec17) and Apia (Samoa replacing Virgin)
journey
– Increased frequency e.g. Thai Airways to Bangkok
• Outlook for continued growth including increased capacity to Pacific Islands, Honolulu and South
Asia routes during the second half, partly offset by Tasman reductions
International arrivals growth by country (ranked by number of passengers)
60,000 6%
number) for the six months to 31
Note: chart labels
Arrivals growth (passenger
50,000
represent
New Zealand growth travel
international %
Dec17 vs prior year
has been stimulated by strong
40,000 economic and capacity growth
30,000
20,000
8%
10,000 2%
6% 19% 14% 20%
4% 22% 7% 4% 7%
-
14 New China Australia UK India Korea Hong Kong Japan Brazil France Singapore Taiwan
Zealand
Source: Statistics New Zealand arrivals by country of residence, company analysisStrategic priority:
Strengthen our consumer business
2018 Interim Results
Delivered stage two of international departures upgrade
Highlights
• Opened full new Duty Free offering and first tranche
of Destination stores on schedule in December. Duty
Free departure sales were up ~30% in the month
performance
Financial
compared to last year
• International PSR was down 3.6% on prior year as
disruption continued to affect Specialty and
Our continuing
Destination with PSRs down 16% and 10%
journey
respectively
• Duty Free PSR was flat. Food & Beverage continued
to grow with PSR up 3.4% following customer
experience improvements and strong trading
• New Strata lounge sales up 30% as airline usage
continues to grow, now serving 14 airlines.
Recognised by Priority Pass at its Lounge of the Year
Awards
• Off airport sales returned to growth driven by new
retailers and return of Chinese passenger growth
• Retail income grew 10.2% driven by passenger
growth, minimum annual guarantees and strong
performances in Food & Beverage and Strata Lounge
15International departures upgrade phasing
2018 Interim Results
NEW MEZZANINE
Highlights
LEVEL
performance
Financial
Our continuing
journey
Proposed phasing:
Duty Free and Western
Delivered precinct
Q4 FY18 – Specialty & Luxury High
Q1 FY19 Street
Additional retail storage
Q1 FY19 Remaining Destination offer to facilitate new click and
collect model
Q1 FY19 Mezzanine Food & Beverage
16 H1 FY19 Food & Beverage areaStrategic priority:
Strengthen our consumer business
2018 Interim Results
Parking revenue increase following capacity additions
Highlights
• Parking revenue up 8.7% with ARPS flat as parking income
growth matched capacity increases
• ~1,000 new spaces built at Park & Ride and ~600 were
performance
Financial
filled with staff relocated from the international terminal,
freeing premium capacity
• Continued growth in Valet with revenue up 34% on prior
Our continuing
journey
period
• Commencing construction of a new 1,000 bay multi-storey
car park, providing net 500 new spaces in FY19
Ground transport improvements Nixon Road
• Reconfigured domestic forecourt to improve traffic flows
and public transport access
• Implemented new transit lane system for buses and high Planned multi-
storey car park
occupancy vehicles
• Upgraded Nixon Road to provide a new route to Park & New bus
routes
Ride, reducing traffic on the main intersection
Cargo
• Re-purposing 30,000m2 Cargo Central asset (occupied by Central
freight and logistics tenants) to improve domestic terminal
17
access and convert to parkingStrategic priority:
Be fast, efficient and effective
2018 Interim Results
Investing in our customer experience
60 Mobile international self-
Highlights
service check-in kiosks
• New international departures processing and security
screening area, including space for passengers to repack
and relax 15% Increase in international
check-in service counters
performance
Financial
• 12 new international check-in service counters, up 15% on
the first half of FY17
• 15 additional mobile international self-service check-in
70 Passenger Experience
Assistants for summer peak
Our continuing
journey
kiosks purchased, increasing total number to 60
• 2 new mobile jet airbridges providing a safer and better
experience for passengers on remote stands
• Took delivery of 10 new specialist airside buses
• Continued investing in new technology:
– Parking paywave system implemented, reducing
transaction times and enhancing ease of use
– Launched new artificial intelligence virtual assistant to
help answer common customer queries
– Completed major CCTV upgrade of over 1,000 cameras
and systems
18 • Successful Strata Club launch with positive customer
feedback and additional 40,000 sign-ups in 1H18Strategic priority:
Invest for future growth
2018 Interim Results
Completed 1H FY18 2H FY18 FY19 and beyond
Highlights
Phase 3 • New emigration hall • Phased opening of • Remaining Speciality
Extended outbound • Recompose space first new Speciality & & Luxury High Street
Phase 3
processing & dwell Luxury High Street • New Food &
performance
• Expanded Duty Free and
Financial
stores
Beverage offering
new Destination stores
Departures expansion (Dec17) • Completion forecast
1H FY19
Our continuing
• Opened Gate 17 on Pier B • Gate 18 on Pier B • Project complete
journey
opening in Feb18, one
• Pier B capacity up 50%
Phase 4
month early
• Pier B capacity up
Pier B expansion 100% vs FY17
• Progressed new domestic • Continue progressing • Construction forecast
jet terminal design design and planning to begin in FY19
Phase 5
• Shortlisted contractors for • Commence enabling • Completion forecast
the main build works FY22
Domestic jet terminal
• Continued design work and • Continue progressing • Construction forecast
planning approvals design and planning to begin in FY21
• Appointed international • Completion forecast
design consultants FY28
19 Second RunwayStrategic priority:
Invest for future growth
2018 Interim Results
Core infrastructure project delivery statistics in the six months to 31 December 2017
Highlights
102% 112 % 100%
performance
Financial
Our continuing
journey
Investment spend against Number of projects Number of projects
plan completed against plan commenced against plan
53 < 1/2 15,540
Projects over $1m underway Construction accident sqm of new and refurbished
frequency rate terminal space opened
to maintain, enhance and expand our of the New Zealand average,
airfield and terminals, and to increase based on LTI rate for employees
the resilience of our utilities and and contractors
transport networks
20Strategic priority:
Invest for future growth
2018 Interim Results
16.3% growth in property revenue
Highlights
Investment property
• Completed developments: $90 million rent roll
– 6,000m2 Ministry for Primary Industries building
250 hectares Landdevelopment
performance
available for
Financial
– 7,000m2 Rohlig Logistics warehouse and office
– Civil and roading works on phase 3 of The
Landing delivering an additional 12 hectares of
96% Occupancy in the
Our continuing
development ready land portfolio
journey
• Continuing development in response to market
demand with $165m of projects completed or under
construction in the first half of FY18
• Projects underway:
– 20,000m2 Bunnings distribution centre
– 7,000m2 DSV Logistics warehouse and office
• Rent roll up 39% on the prior year including the
recently announced Foodstuffs office and 65,000m2
distribution centre, scheduled completion in FY211
• Investment property fair value increase of $41.5m,
up $24.1m on 1H17 with strong development
21 margins on recently completed projects
1) See further details in Media Release issued on 8 February 2018Strategic priority:
Invest for future growth
2018 Interim Results
Investing in safety
Highlights
• Pro-active safety observations increased 84% reflecting
our continuing investment in safety
• Passenger injury rate down 26% following the
performance
Financial
introduction of new safety measures including an
escalator safety programme
• First New Zealand airport to have its safety management
Our continuing
journey
system certified by the Civil Aviation Authority under its
new rules
Sustainability focus
• One of the top 10 New Zealand businesses recognised
for corporate social commitment in the BACS Social
Index 2017
• First company in Oceania to adopt an internationally-
approved ‘science-based target’ for reducing carbon
emissions
• Set ambitious goal of reducing our airport emissions by
45% per square metre by 2025
• Ara, the Auckland Airport jobs and skills hub, placed 148
22 into employment in the last six months (61 in 1H17)Regulatory update
2018 Interim Results
• Auckland Airport’s FY18-22 aeronautical pricing decision
Highlights
was announced in June 2017, following a comprehensive
consultation process with our airline partners over 12
months
performance
• The Commerce Commission is reviewing the information
Financial
disclosed by Auckland Airport about the pricing decision,
as part of the regulatory review process
Our continuing
• The Commission is focusing on three areas for Auckland
journey
Airport – profitability, pricing efficiency (including the
Runway Land Charge) and investment
• Interested parties have provided input on the process and
key issues for the Commission’s review – submissions
and cross-submissions in November/December 2017
• The Commerce Commission now expects to publish its
draft decision on FY18-22 pricing in April 2018 and the
final decision in September 2018
• Auckland Airport will continue to engage in the review
process to ensure that our pricing approach and rationale
is well understood
23Outlook
2018 Interim Results
NQA investment
Highlights
• We have agreed to sell our 24.6% investment in
NQA to existing investors for A$370m
• The sale is subject only to securing the necessary
performance
Financial
regulatory and counter-party approvals and will be
completed in accordance with the requirements of
the NQA security holders’ agreement
Our continuing
Guidance
journey
• We are now slightly tightening FY18 underlying profit
after tax (excluding any fair value changes and other
one-off items) guidance from $248m-$257m to
$250m-$257m
• Our capital expenditure guidance for FY18 of
between $410m and $460m is unchanged
• This guidance is subject to any material adverse
events, significant one-off expenses, non-cash fair
value changes to property and deterioration due to
global market conditions or other unforeseeable
circumstances
24Questions
Appendix
Underlying profit reconciliation
 2018                 Interim Results

                                                                                                   2017                                                 2016
   Highlights

                                                                                 Reported Adjustments             Underlying         Reported      Adjustments        Underlying
                          For the 6 months to 31 December
                                                                                    profit        $m                  profit            profit             $m             profit
                                                                                      $m                                 $m               $m                                 $m
                          EBITDAFI                                                   250.1                  -            250.1            235.9                  -            235.9
performance
 Financial

                          Share of profits of associates                                4.4                 -              4.4               2.6             (0.1)              2.5

                          Share of profit of associate held for sale                    6.7               0.1              6.8               7.4             (2.3)              5.1

                          Derivative fair value movement                              (3.0)               3.0                 -              1.5             (1.5)                   -
Our continuing
   journey

                          Investment property revaluation                              41.5            (41.5)                 -             17.4            (17.4)                   -

                          Depreciation                                               (40.7)                 -           (40.7)            (37.4)                 -           (37.4)

                          Interest expense and other finance costs                   (38.6)                 -           (38.6)            (36.8)                 -           (36.8)

                          Taxation expense                                           (54.5)               5.6           (48.9)            (48.8)               3.0           (45.8)

                          Profit after tax                                           165.9             (32.8)            133.1            141.8             (18.3)            123.5

                      •    We have made the following adjustments to show underlying profit after tax for the six months ended 31 December 2017 and 31 December 2016:
                           – reversed out the impact of revaluations of investment property. An investor should monitor changes in investment property over time as a
                             measure of growing value. However, a change in one particular year is too short to measure long term performance. Changes between years can
                             be volatile and, consequently, will impact comparisons. Finally, the revaluation is unrealised and, therefore, is not considered when determining
                             dividends in accordance with the dividend policy.
                           – the group recognises gains or losses in the income statement arising from valuation movements in interest rate derivatives which are not hedge
                             accounted and where the counterparty credit risk on derivatives impacts accounting hedging relationships. These gains or losses, like investment
                             property, are unrealised and interest rate derivative valuation movements are expected to reverse out over their lives.
                           – in addition, to be consistent, we have adjusted the revaluations of investment property and financial derivatives that are contained within the share
                             of profit of associates in 2017 and 2016.
                           – we have also reversed the taxation impacts of the above valuation movements in both 2017 and 2016.

                 27
Important notice and glossary
2018 Interim Results
Disclaimer
This presentation is given on behalf of Auckland International Airport Limited. Information in this presentation:
• is provided for general information purposes only, and is not an offer or invitation for subscription, purchase, or recommendation of
securities in Auckland International Airport Limited (Auckland Airport);
• should be read in conjunction with, and is subject to, Auckland Airport's audited consolidated financial report for the six months ended
31 December 2017, prior annual and interim reports and Auckland Airport's market releases on the NZX and ASX;
• includes forward-looking statements about Auckland Airport and the environment in which Auckland Airport operates, which are
subject to uncertainties and contingencies outside of Auckland Airport's control. Auckland Airport's actual results or performance may
differ materially from these statements;
• includes statements relating to past performance, which should not be regarded as a reliable indicator of future performance; and
• may contain information from third parties believed to be reliable; however, no representations or warranties are made as to the
accuracy or completeness of such information.
All information in this presentation is current at the date of this presentation, unless otherwise stated. Auckland Airport is not under any
obligation to update this presentation at any time after its release, whether as a result of new information, future events or otherwise.
All currency amounts are in New Zealand dollars unless otherwise stated.
Glossary
ARPS Average revenue per parking space
EBITDAFI Earnings before interest, taxation, depreciation, fair value adjustments and investments in associates
MCTOW Maximum certified take off weight
NQA North Queensland Airports
PAX Passenger
PSR Passenger Spend Rate
28You can also read