Interim Results 2017 Adrian Littlewood Philip Neutze - Corporate
←
→
Page content transcription
If your browser does not render page correctly, please read the page content below
Adrian Littlewood
                                Chief Executive

                           Philip Neutze
Interim Results 2017      Chief Financial Officer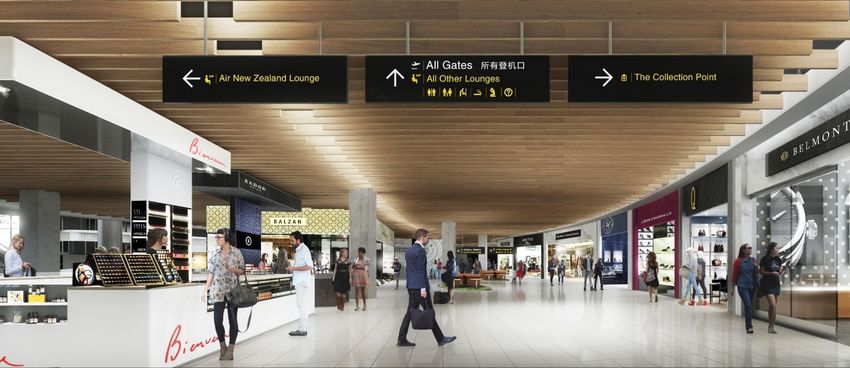
Highlights

               FY17 interim results
             Adrian Littlewood, chief executive
Results at a glance
 2017                Interim Results
   Highlights

                     Revenue                       Passenger movements

                           10.8%         $310.9m      12.4%                     9.4m
performance
 Financial

                     Operating EBITDAFI            Aircraft movements
Our continuing
   journey

                           10.5 %        $235.9m      8.9%                84,593
                     Underlying profit             Interim dividend per share

                           18.6%         $123.5m      17.6%          10 cents

                 3
Highlights
 2017                Interim Results

                     ✓ Growing  and supporting tourism
   Highlights

                       • Rapidly changing market structure – the number of international airlines
                                       servicing Auckland has increased 50% in only 18 months
                             •         International passengers up 11.9%1, domestic passengers up 11.7%
performance
 Financial

                             •         Sustainably growing travel markets to increase connectivity
                             •         Supporting the New Zealand tourism industry and recognising
                                       infrastructure requirements
Our continuing
   journey

                     ✓ Upgrading  our airport infrastructure
                       • Currently spending more than $1m per working day on airport improvements
                              •        International terminal upgrade well underway
                              •        Upgraded two remote stands to accommodate two A380 or four smaller
                                       aircraft
                              •        Planning and design for second runway

                     ✓ Providing a high-quality customer experience
                       • 45 new mobile self-service check-in kiosks and 13 more check-in counters
                               •       16% increase in current security processing area
                               •       1,400 new Park&Ride car parking spaces
                 4             •       Developing a 5 star hotel with 250 rooms by the international terminal
                     1) Excluding transits, growth in H1 FY17 compared to H1 FY16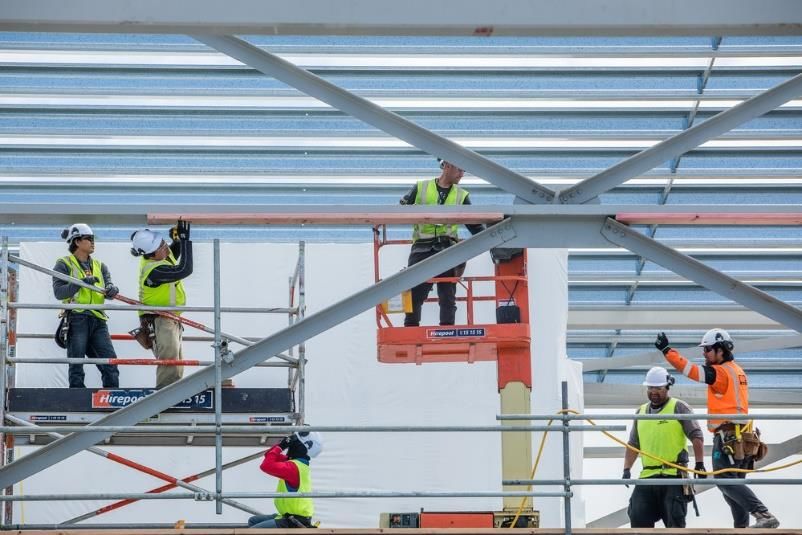
performance
Financial

                  FY17 interim results
              Philip Neutze, chief financial officer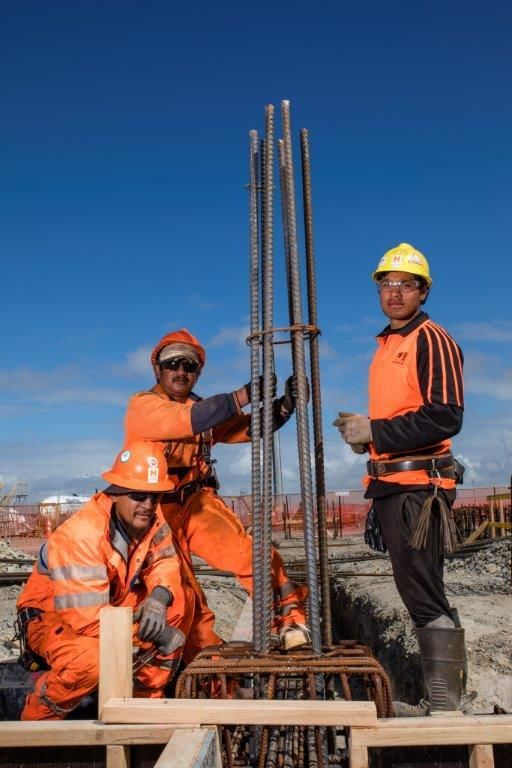
Strong half year result
 2017                Interim Results
   Highlights

                                                                                                               2016                       2015    Change
                      For the 6 months to 31 December
                                                                                                                $m                         $m

                      Revenue                                                                                 310.9                       280.6    10.8%

                      Expenses                                                                                  75.0                       67.1    11.8%
performance
 Financial

                      Earnings before interest, taxation, depreciation,
                      fair value adjustments and investments in associates                                    235.9                       213.5    10.5%
                      (EBITDAFI)
Our continuing

                      Share of profit from associates                                                           10.0                        4.1   143.9%
   journey

                      Derivative fair value (decrease)/increase                                                  1.5                      (0.7)       n/a

                      Investment property revaluation                                                           17.4                       16.0     8.8%

                      Depreciation expense                                                                      37.4                       36.6     2.2%

                      Interest expense                                                                          36.8                       40.9   (10.0)%

                      Taxation expense                                                                          48.8                       39.6    23.2%

                      Reported net profit after tax                                                           141.8                       115.8    22.5%

                      Underlying profit after tax                                                             123.5                       104.1    18.6%

                     A reconciliation between reported net profit after tax and underlying profit after tax is included in the Appendix

                 6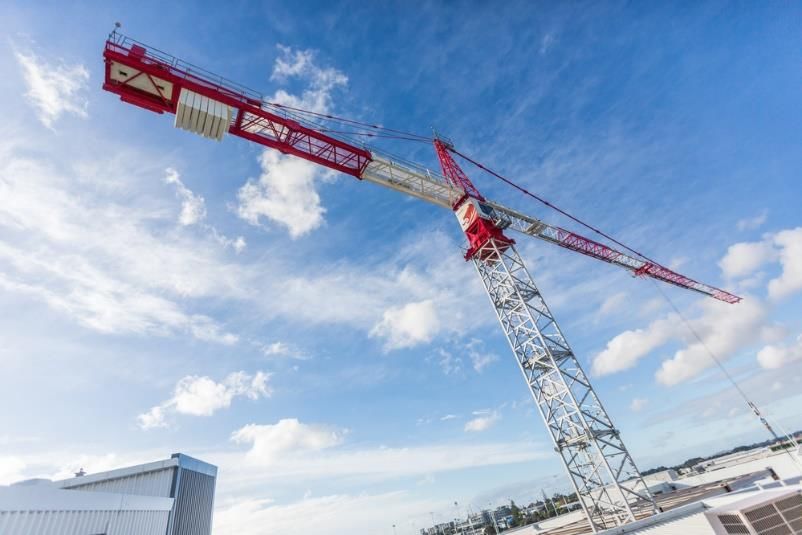
Strong revenue growth across the business
 2017                Interim Results

                                                                                                2016    2015    Change
   Highlights

                       For the 6 months to 31 December
                                                                                                 $m      $m

                       Airfield income                                                           59.2    50.2    17.9%

                       Passenger services charge                                                 85.9    75.5    13.8%
performance
 Financial

                       Retail income                                                             80.7    78.6    2.7%1

                       Car park income                                                           28.9    26.0    11.2%
Our continuing

                       Investment property rental income                                         32.5    27.9    16.5%
   journey

                       Other rental income                                                        8.2     7.7     6.5%

                       Other income                                                              15.5    14.7     5.4%

                       Total revenue                                                            310.9   280.6    10.8%

                     • Aeronautical revenue growth driven by double digit passenger growth, growing runway
                       movements and aeronautical price increase
                     • Strong passenger growth, food & beverage and passenger products performance contributed to
                       retail income growth of 6.4%1 despite ongoing expansion work in the international terminal
                     • Parking revenue tracking in line with passenger growth
                     • Investment property rental income increase was driven by the development of new properties
                       and strong growth in the existing asset base

                 7
                     1) Growth was 6.4% excluding a one-off accrual release in the prior year
Exceptional passenger growth
 2017                Interim Results
   Highlights

                         For the 6 months to 31 December                                                             2016                      2015                  Change

                         International arrivals                                                                2,462,690                 2,209,510                      11.5%

                         International departures                                                              2,328,575                 2,070,923                      12.4%
performance
 Financial

                         International passengers excluding transits                                           4,791,265                 4,280,433                      11.9%

                         Transit passengers                                                                      353,978                   275,344                      28.6%
Our continuing

                         Total international passengers                                                        5,145,243                 4,555,777                      12.9%
   journey

                         Domestic passengers                                                                   4,299,244                 3,849,883                      11.7%

                         Total passengers                                                                      9,444,487                 8,405,660                      12.4%

                     • The growth in passengers occurred across a range of markets1: North America up 37%, Korea
                       23%, Japan 12%, Europe 13% and Australia 6%
                     • Double digit international growth driven by a 17.1% increase in airline capacity
                     • Domestic continued to benefit from new capacity on main trunk and regional services
                     • Total passenger growth of 12.4% ahead of aircraft movements up 8.9%
                     • Some minor capacity rebalancing occurring as carriers bed in new routes, but double digit
                       growth in capacity expected in H2 FY17 despite some announced reductions

                 8
                     •  Auckland Airport refined its passenger and movements data from August 2016, resulting in a very minor restatement of prior year comparatives. The numbers
                        above are consistent with published monthly traffic data.
                     1) Visitor arrivals growth in H1 FY17 compared to H1 FY16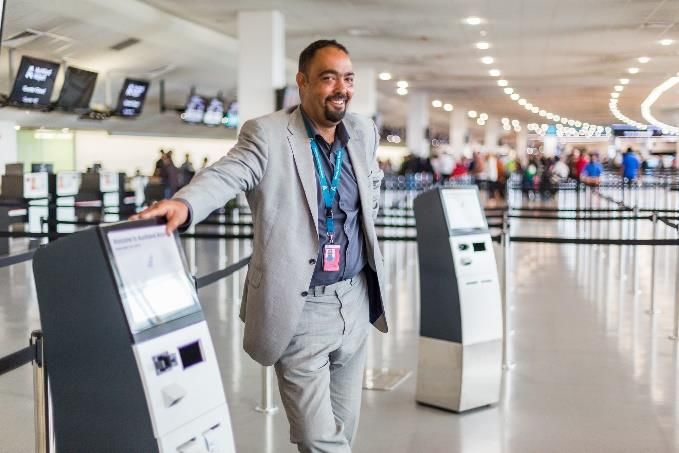
Continuing growth in runway movements
 2017                Interim Results
   Highlights

                      For the 6 months to 31 December                                                              2016                         2015                  Change

                      Aircraft movements

                      International aircraft movements                                                           27,476                      24,343                      12.9%
performance
 Financial

                      Domestic aircraft movements                                                                57,117                      53,357                       7.0%

                      Total aircraft movements                                                                   84,593                      77,700                       8.9%
Our continuing
   journey

                      MCTOW (tonnes)

                      International MCTOW                                                                    2,756,353                    2,363,811                      16.6%

                      Domestic MCTOW                                                                         1,121,401                    1,016,146                      10.4%

                      Total MCTOW                                                                            3,877,755                    3,379,956                      14.7%

                     • Increased connectivity to new and existing destinations continued the FY16 increase in
                       total aircraft movements into the first half of FY17
                     • Air New Zealand continues to increase their A320 domestic jet and ATR72 turboprop fleet
                       size. Jetstar introduced five Q300 turboprop aircraft on the new regional routes

                 9
                     Auckland Airport refined its passenger and movements data from August 2016, resulting in a very minor restatement of prior year comparatives. The numbers
                     above are consistent with published monthly traffic data.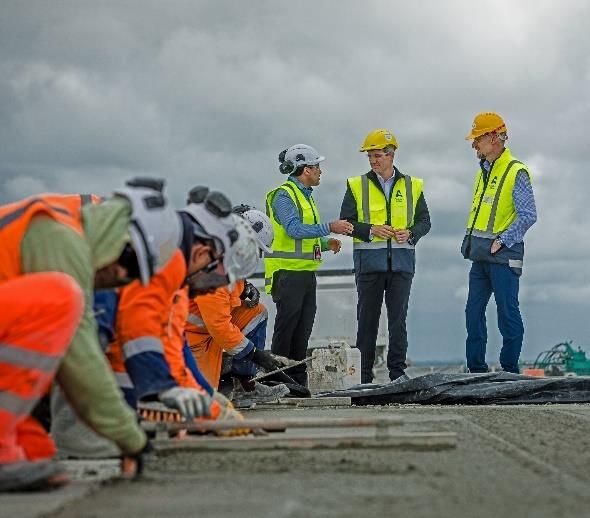
Expenses driven by business growth
 2017                 Interim Results

                                                                               2016             2015          Change
   Highlights

                       For the 6 months to 31 December
                                                                                $m               $m

                       Staff                                                   24.9             22.4           11.2%

                       Asset management, maintenance and airport operations    26.1             23.5           11.1%
performance
 Financial

                       Rates and insurance                                      6.1               5.7           7.0%

                       Marketing and promotions                                 7.9               6.3          25.4%

                                                                                4.9               4.4          11.4%
Our continuing

                       Professional services and levies
   journey

                       Other                                                    5.1               4.8           6.3%

                       Total operating expenses                                75.0             67.1           11.8%

                       Depreciation                                            37.4             36.6            2.2%

                       Interest expense                                        36.8             40.9          (10.0)%

                      • Staff costs increase largely driven by increased headcount to cater for the growth in the
                        business, particularly passenger facing terminal staff, and lapping a negative LTI accrual in FY16
                      • Increased asset management, maintenance and airport operations reflecting variable costs to
                        drive revenue growth, increased airside bus operations, and investment in technology
                      • Marketing and promotions spend driven by support for new airlines and routes

                 10
Associates’ performance
2017 Interim Results
2016 2015 Change
For the 6 months to 31 December
Highlights
$m $m
Queenstown Airport (24.99% ownership)
Total Revenue 19.6 15.7 24.8%
performance
Financial
EBITDAFI 13.1 11.7 12.0%
Domestic Passengers 660,231 565,595 16.7%
International Passengers 299,088 264,965 12.9%
Our continuing
Underlying Earnings (Auckland Airport share) 1.5 1.5 0.0%
journey
North Queensland Airports (24.55% ownership) AU$m AU$m
Total Revenue (AU$) 72.8 69.2 5.2%
EBITDAFI (AU$) 46.3 44.0 5.2%
Domestic Passengers (Cairns + Mackay) 2,742,384 2,698,748 1.6%
International Passengers (Including transits) (Cairns) 431,615 372,374 15.9%
Underlying Earnings (Auckland Airport share) (NZ$) NZ$5.1 NZ$4.5 13.3%
Novotel Tainui Holdings (20.00% ownership)
Total Revenue 13.9 12.6 10.3%
EBITDAFI 4.6 4.0 15.0%
Average occupancy 91.7% 89.0%
Average room rate increase 10.9% 11.4%
Underlying Earnings (Auckland Airport share) 1.0 0.8 25.0%
11Our continuing
journey
FY17 interim results
Adrian Littlewood, chief executiveStrategic priority:
Growing Travel Markets
2017 Interim Results
New routes and capacity underpin passenger growth international
27
Highlights
airlines1
• International airline capacity up 17% in the six months to 31
December with increases in service frequency, aircraft upgauging, 4
new airlines and 5 new services
44 international
destinations1
performance
• Domestic continued to benefit from new capacity up 11% on main
Financial
trunk and regional services e.g. Queenstown
• 15 new international services1 over the last 18 months 19 domestic
destinations
Our continuing
• Continue to focus on sustainably growing travel markets to increase
journey
Auckland and New Zealand’s air connectivity
Tianjin
Beijing San Francisco2
Chongqing Osaka
Key
Los Angeles
Dubai Shanghai Houston = New in 1H17
Hong Kong
Hong Kong Shenzhen
Plain text = New in last
Ho Chi Minh City 18 months
Manila
Kuala Lumpur
Rarotonga
Buenos Aires
13
1) Excluding Qatar’s Doha service from February 2017
2) Placed on hold in April 2017 before recommencing in October 2017 as a seasonal serviceStrategic priority:
Growing Travel Markets
2017 Interim Results
Sustainably growing travel markets
Highlights
Europe / Middle East China USA
• European visitors up 13%1 • Chinese visitors up 5%1 • USA visitors up 37%1
• • • Entry of USA carriers and access
performance
Significantly enhanced connectivity New direct flights to tier two cities
Financial
with new Emirates (Mar-16) and commenced at the end of H1 FY17 and to their extensive distribution
Qatar services (Feb-17) will capture growth in new markets network and marketing reach
• Slowing growth in tier one cities offset
by increasingly high value passengers
Our continuing
journey
Korea
• Korean visitors up 23%1
• Strong visitor arrivals growth
supported increase in Korean Air
direct capacity
Australia
• Visitor spend in New Zealand up
• Australian visitors up 6%1 almost 3 times the rate of pax
• Marketing campaigns to support growth (Sep-16 IVS)
off peak travel by Australians to
Auckland and the North Island for
short breaks winter holidays
• Continued support for tourism through marketing activities in new and emerging markets
• Recognising the increasing number of travellers and New Zealand’s infrastructure requirements:
– working with partners to support off peak travel to NZ and spread demand throughout the year
14 – provided the Government with research on how best to fund tourism infrastructure
1) Visitor arrivals growth in H1 FY17 compared to H1 FY16. Recently added Hong Kong Airlines, Tianjin Airlines and Hainan Airlines will contribute to H2 FY17 growth.Strategic priority:
Strengthen our consumer business
2017 Interim Results
Strong performance despite significant disruption
Highlights
• International terminal PSR up 0.9% on prior year despite
ongoing construction work to upgrade the international
departure area
performance
Financial
• Duty Free performing well reflecting retailers’ global expertise
• Focus on core Duty Free products resulted in PSR growth of
22% in Cosmetics and Skincare, 60% in Electronics. This was
Our continuing
partially offset by modest PSR declines in Liquor and Tobacco
journey
• Specialty and Destination impacted by planned store closures
as part of the international terminal upgrade, continuing until
late 2017
• Food and Beverage sales up 18% as customer experience
continues to be improved through greater choice such as
Urban Market Café and 1985 bar on Pier A
• Retail income up 6.4% excluding prior year one-off accrual
release. Duty free income growth stronger, but partly offset by
disruption impact on Speciality and Destination categories and
CBD construction impacting Off Airport
15Strategic priority:
Strengthen our consumer business
2017 Interim Results
Major upgrade of our international departure retail hub
Highlights
• ~45 units up for tender in the new international terminal expansion
• Excellent interest from retailers in securing space
performance
Financial
• Confident in selecting retailers with compelling store concepts that sell products representing the
best of New Zealand and the world
• Transformation of our duty free and tax free shopping experience will start to be visible from mid
Our continuing
2017
journey
16Strategic priority:
Strengthen our consumer business
2017 Interim Results
Parking revenue growth in line with passenger growth
Highlights
• Parking revenue up 11.2% driven by double digit passenger
growth
• ARPS up 2.6% due to increased car parking space utilisation
performance
Financial
• Continuing growth in Valet with revenue up 29% on prior
period. 500 new Valet spaces added in the first half of FY17
Our continuing
• 1,400 new Park&Ride car parking spaces added in the first
journey
half of FY17 with 800 available for public parking and 600 to
be taken by relocated staff
• New value focused Valet parking service launched at
Park&Ride
• Introduced free parking Wait Zone in the domestic terminal
following the very successful launch of the international
terminal Wait Zone
• Planning underway for a multi-storey car park, including
providing additional capacity to offset any reduction during
construction
• New Drop and Ride zone created within Park&Ride where
travellers can be dropped off to catch the bus to the terminal
17Strategic priority:
Be fast, efficient and effective
2017 Interim Results
Investing in our customer experience
45 New mobile international self-
Highlights
service check-in kiosks
• 13 new check-in counters and 45 new mobile check-in
kiosks in the international terminal
• Upgraded back-of-house baggage handling system
13 Additional check-in
service counters
performance
Financial
• Opened new female toilet facilities in international arrivals
area. Over 80% all of Auckland Airport’s customer toilets
have now been upgraded to current design standard
60+ Passenger Experience
Assistants recruited
Our continuing
journey
• Recruited more than 60 Passenger Experience Assistants
to help passengers at the airport during the peak season 15 Languages spoken by new
Customer Service Agents
• 12 new Customer Service Agents, proactively assisting
passengers in the current international departures area
• MPI Green Lane established for low risk Australia and
New Zealand passengers to reduce processing times
• Installed a seventh security screen machine in the
international departures area; increasing security
processing capacity by around 16%
• Effectively managing the processing of 20% more
passengers than two years ago
18Strategic priority:
Invest for future growth
2017 Interim Results
42 capital expenditure projects currently underway each valued at over $1m
Highlights
• Completed new taxiway and fully serviced airfield stand
• Completed critical water, waste water, electricity and fuel projects
to ensure robust ongoing supply to the airport
performance
Financial
• Upgraded two remote airfield stands to accommodate an A380 or
two smaller aircraft, increasing our airfield pavement by the
equivalent of five rugby fields
Our continuing
journey
• Progressed second runway planning:
– received planning approvals
– initiated concept design
– updated detailed requirement modelling, now forecast towards the end of the 2020’s
• Significant progress on the complex international departure area upgrade and Pier B extension.
Project included assembling the largest mobile crane in the country to lift 32 tonne steel trusses
for the roof. We are on track to deliver:
Mid 2017 Late 2017 Mid 2018
• New security processing • Expansion of the two new duty free shops • Second half of the new
zone • First half of the new passenger lounge passenger lounge and retail
• First half of two new duty and retail hub hub
free shops • Adding Gate 17 on Pier B • Adding Gate 18 on Pier B
19Strategic priority:
Invest for future growth
2017 Interim Results
Improving our transport network
Highlights
• Established a taskforce with the NZ Transport Agency
and Auckland Transport focused on improving access
to the airport precinct
performance
Financial
• Transport initiatives to improve travel times include:
– upgraded Puhinui Road roundabout
Our continuing
– improved traffic light phasing at George Bolt
journey
Memorial Drive and Tom Pearce Drive intersection
– improved lane configurations at George Bolt
Memorial Drive and Laurence Stevens roundabout
to improve traffic flows
• Continued to advocate with NZ Transport Agency and
Auckland Transport to improve state highway access
and public transport services to the airport
• Opening of $1.4bn Waterview motorway tunnel and
completion of Kirkbride Road and State Highway 20
widening at Onehunga will assist travel to the airport
20Strategic priority:
Invest for future growth
2017 Interim Results
16.5% growth in property revenue
Highlights
Investment property
• Rent roll up 12% on the prior year $64.6 million rent roll
• $141m of projects under construction
281 hectares Land available for
performance
• 10,000 sqm of pre-commitments secured
Financial
development
including Röhlig Logistics and a building
expansion for GVI
99% Occupancy in the
Our continuing
• Agreed terms for large distribution centre in the portfolio
journey
Landing with construction to start in Q2 2017
• Major roading projects to complete mid 2017 to
enhance connectivity
New 5 star hotel
• Strong 92% occupancy at Novotel and the ibis
budget
• Restructured JV with Tainui Group Holdings.
Once the transaction has completed it will result
in 50:50 ownership of Novotel and new Pullman
hotel
• 250 room Pullman to open mid 2019
21 • Enhanced guest experience from new hotel
plaza adjacent to international terminalStrategic priority:
Invest for future growth
2017 Interim Results
Investing in our community
Highlights
• Ara, the Auckland Airport jobs and skills hub, is gaining
momentum. In the past six months Ara organised 746
training opportunities and placed 61 people into employment
performance
– 35 came off government benefit
Financial
• Helped 15 South Auckland secondary schools prepare their
students for work through customised engagement plans
Our continuing
• 8 graduate scholarships for local students
journey
• Improved organic waste recycling facilities in the international
terminal drove an increase in organic waste recycling to 47%
Being a good employer
• New staff Professional Development Framework will increase
employees’ ability to drive their own career development
• Introduced updated flexible working arrangements policy in
December 2016 which play an important part in increasing
employee diversity
• Increased health and safety headcount. Health and safety
culture survey improved 5% to 67% reflecting increasingly
proactive culture
22Regulatory update
2017 Interim Results
Economic regulation
Highlights
• The Commerce Commission completed its input methodologies review in December 2016
• The final decision reaffirmed that the Commission does not set prices for airport services and
that its focus is on ensuring there is transparency in relation to the pricing decisions made by
performance
Financial
airports
• Key points from the final decision include:
Our continuing
– a new forward-looking profitability measure using an IRR over a five year period reflecting
journey
each airport’s bespoke pricing approaches
– the Commission's approach to assessing airport profitability indicates that it will take into
account different contextual factors when assessing airport performance, including airport
specific required returns, investment volumes and risk profile
– flexibility in approach to disclosing revenue on future use assets
Pricing decisions
• Auckland Airport’s FY18-22 aeronautical price path consultation with major airlines and
representatives began in early FY17. The final pricing decision expected in May 2017
• Growth in travel and the remaining lifetime of the existing domestic terminal are driving a
significant capital programme, which is being consulted on with customers
• Charges will seek to provide a reasonable return on existing infrastructure and to support
23 ongoing investment in airport facilities and services for the long-term benefit of all airport usersOutlook
2017 Interim Results
Guidance
Highlights
• Ongoing strong performance to date has been in
line with expectations
performance
• We are now tightening underlying net profit after
Financial
tax (excluding any fair value changes and other
one-off items) guidance to between $235 million
and $243 million in FY17
Our continuing
journey
• Reflecting the acceleration in infrastructure
investment this year, we are lifting our capital
expenditure guidance for FY17 to between $370
million and $400 million in FY17, including
approximately $240 million of aeronautical spend
• This guidance is subject to any material adverse
events, significant one-off expenses, non-cash fair
value changes to property and deterioration due to
global market conditions or other unforeseeable
circumstances
24Questions
Appendix
Underlying profit reconciliation
2017    Interim Results

                                                                                    2016                                                 2015
                                                                  Reported Adjustments              Underlying         Reported      Adjustments        Underlying
            For the 6 months to 31 December
                                                                  earnings         $m                 earnings         earnings              $m           earnings
                                                                        $m                                  $m               $m                                 $m

            EBITDAFI                                                  235.9                  -           235.9             213.5                    -        213.5

            Share of profit from associates                            10.0              (2.4)              7.6               4.1               2.7             6.8

            Derivative fair value increases                              1.5             (1.5)                 -            (0.7)               0.7               -

            Investment property revaluation                            17.4            (17.4)                  -            16.0            (16.0)                -

            Depreciation                                              (37.4)                 -           (37.4)            (36.6)                   -        (36.6)

            Interest expense and other finance costs                  (36.8)                 -           (36.8)            (40.9)                   -        (40.9)

            Taxation expense                                          (48.8)               3.0           (45.8)            (39.6)               0.9          (38.7)
            Profit after tax                                          141.8            (18.3)            123.5             115.8            (11.7)           104.1

        •    We have made the following adjustments to show underlying profit after tax for the six-month periods ended 31 December 2016 and 31 December
             2015:
             – reversed out the impact of revaluations of investment property. An investor should monitor changes in investment property over time as a measure
               of growing value as a change in one particular year can be too short a period for measuring performance. Changes between years can be volatile
               and will consequently impact comparisons. The revaluation is unrealised and, therefore, is not considered when determining dividends in
               accordance with the dividend policy;
             – the group recognises gains or losses in the income statement arising from valuation movements in interest rate derivatives which are not hedge
               accounted or where the counterparty credit risk on derivatives impact accounting hedging relationships. These gains or losses, like investment
               property, are unrealised and interest rate derivative movements are expected to reverse out over the lives of the derivatives;
             – reversed the revaluations of investment property and financial derivatives contained within the share of profit of associates; and
             – reversed the taxation impacts of the above adjustments

   27
Important Notice and Glossary
2017 Interim Results
Disclaimer
This presentation is given on behalf of Auckland International Airport Limited. Information in this presentation:
• is provided for general information purposes only, and is not an offer or invitation for subscription, purchase, or recommendation of
securities in Auckland International Airport Limited (Auckland Airport);
• should be read in conjunction with, and is subject to, Auckland Airport's audited consolidated interim financial report for the six months
ended 31 December 2016, prior annual and interim reports and Auckland Airport's market releases on the NZX and ASX;
• includes forward-looking statements about Auckland Airport and the environment in which Auckland Airport operates, which are subject
to uncertainties and contingencies outside of Auckland Airport's control. Auckland Airport's actual results or performance may differ
materially from these statements;
• includes statements relating to past performance, which should not be regarded as a reliable indicator of future performance; and
• may contain information from third parties believed to be reliable; however, no representations or warranties are made as to the accuracy
or completeness of such information.
All information in this presentation is current at the date of this presentation, unless otherwise stated. Auckland Airport is not under any
obligation to update this presentation at any time after its release, whether as a result of new information, future events or otherwise.
All currency amounts are in New Zealand dollars unless otherwise stated.
Glossary
ARPS Average revenue per parking space
CBD Central business district
EBITDAFI Earnings before interest, taxation, depreciation, fair value adjustments and investments in associates
MCTOW Maximum certified take off weight
NPAT Net profit after tax
PAX Passenger
PSR Passenger spend rate
28You can also read


