STABILITY, SECURITY & GROWTH - THROUGH QUALITY, DIVERSIFICATION & SCALE INVESTOR PRESENTATION - H&R REIT
←
→
Page content transcription
If your browser does not render page correctly, please read the page content below
STABILITY,
                                                SECURITY
                                                & GROWTH
                                                THROUGH QUALITY,
                                                DIVERSIFICATION & SCALE

INVESTOR
PRESENTATION
As at December 31, 2020
unless otherwise noted

H&R Real Estate Investment Trust (TSX: HR.UN)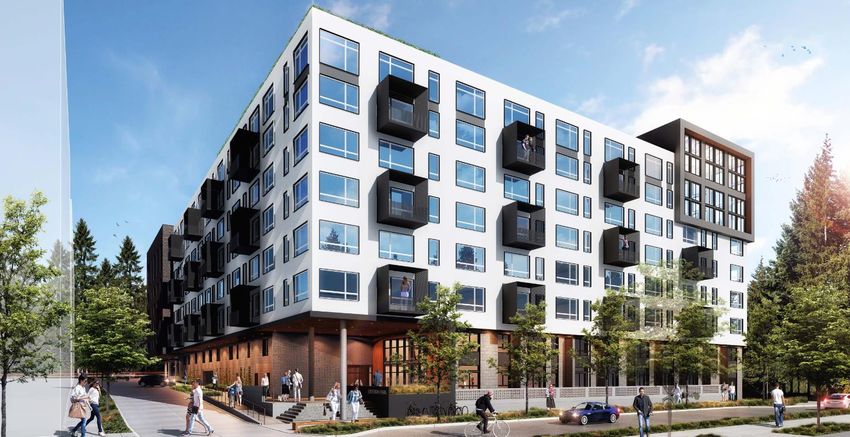
Caution Regarding Forward-looking Statements
                                                         Forward Looking Statements
Certain statements made in this presentation will contain forward‐looking information within the meaning of applicable securities laws (also known as forward‐looking
statements) including, among others, statements made or implied relating to H&R’s objectives, strategies to achieve those objectives, H&R’s beliefs, plans, estimates,
projections and intentions and statements with respect to H&R’s development activities, including planned future expansions, and building of new properties; the
expected yield on cost of H&R’s developments and other investments; the expected costs and timing of any of H&R’s projects; and the expected occupancy, management’s
expectations regarding future intensification opportunities including the timing of approvals for re-zoning and site plan applications, the impact of the COVID-19 virus on
the REIT and REIT’s tenants, the REIT’s bad debt and expected credit loss. Statements concerning forward‐looking information can be identified by words such as
“outlook”, “objective”, “may”, “will”, “expect”, “intend”, “estimate”, “anticipate”, “believe”, “should”, “plans”, “project”, “budget” or “continue” or similar expressions
suggesting future outcomes or events. Such forward‐looking statements reflect H&R’s current beliefs and are based on information currently available to management.
Forward‐looking statements are provided for the purpose of presenting information about management’s current expectations and plans relating to the future and readers
are cautioned that such statements may not be appropriate for other purposes. These statements are not guarantees of future performance and are based on H&R’s
estimates and assumptions that are subject to risks and uncertainties, including those discussed in H&R’s materials filed with the Canadian securities regulatory authorities
from time to time, including H&R’s MD&A for the year ended December 31, 2020, and H&R’s most recently filed annual information form, which could cause the actual
results and performance of H&R to differ materially from the forward‐looking statements made in this presentation. Although the forward‐looking statements made in this
presentation are based upon what H&R believes are reasonable assumptions, there can be no assurance that actual results will be consistent with these forward‐looking
statements. Readers are also urged to examine H&R’s materials filed with the Canadian securities regulatory authorities from time to time as they may contain discussions
on risks and uncertainties which could cause the actual results and performance of H&R to differ materially from the forward‐looking statements made in this presentation.
All forward‐looking statements made in this presentation are qualified by these cautionary statements. These forward‐looking statements are made as of February 11,
2021 and H&R, except as required by applicable law, assumes no obligation to update or revise them to reflect new information or the occurrence of future events or
circumstances.

                                                                 Non-GAAP Measures
The REIT’s audited annual financial statements are prepared in accordance with International Financial Reporting Standards (“IFRS”). H&R’s management uses a number of
measures which do not have a meaning recognized or standardized under IFRS or Canadian Generally Accepted Accounting Principles (“GAAP”). The non-GAAP measures
REIT’s proportionate share, Same-Asset property operating income (cash basis), Funds from Operations (“FFO”), Adjusted Funds from Operations (“AFFO”), Payout Ratio
per Unit as a % of AFFO, Interest Coverage ratio and Net Asset Value (“NAV”), as well as other non-GAAP measures discussed elsewhere in this presentation, should not be
construed as an alternative to financial measures calculated in accordance with GAAP. Further, H&R’s method of calculating these supplemental non-GAAP financial
measures may differ from the methods of other real estate investment trusts or other issuers, and accordingly may not be comparable. H&R uses these measures to better
assess its underlying performance and provides these additional measures so that investors may do the same. These non-GAAP financial measures are more fully defined
and discussed in H&R’s MD&A as at and for the three and twelve months ended December 31, 2020, available at www.hr-reit.com and on www.sedar.com.

                                                                                Other
All figures have been reported at H&R’s ownership interest unless otherwise stated.
Balance Sheet figures have been converted at $1.27 CAD for each U.S. $1.00.
Income Statement figures have been converted at $1.34 CAD for each U.S. $1.00.

2                 STABILITY, SECURITY & GROWTH through QUALITY, DIVERSIFICATION & SCALE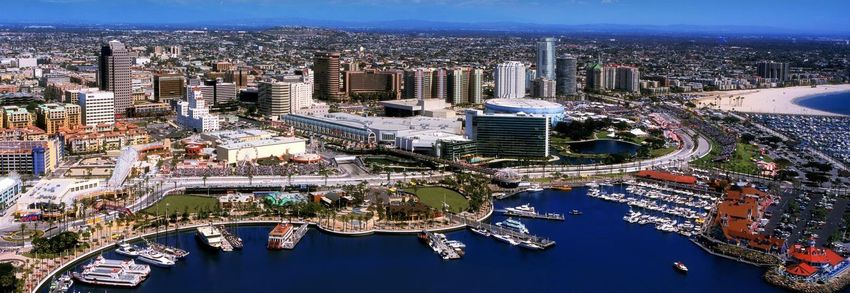
Stability, Security & Growth through
Quality, Diversification & Scale

     One of the Largest REITs in
                                                                                                                         Fully Internalized Management
     Canada with total assets of                                           H&R REIT                                              (Insiders own 6%)
            $13.4 billion

           Office(1)                                   Retail(1)                              Industrial(1)                            Residential(1)
                                                            (Primaris)                                                                 (Lantower Residential)

         33 Properties                               327 Properties                              87 Properties                           23 Properties
    ~10,740,000 Square Feet                     ~13,704,000 Square Feet                     ~9,276,000 Square Feet               7,831 Residential Rental Units

The Bow,    Front St.,   Corus Quay,        Orchard Park,            Dufferin Mall,    Purolator,           Unilever,            Grande Pines,           Legacy Lakes,
 Calgary    Toronto        Toronto            Kelowna                  Toronto          Calgary            Mississauga             Orlando                  Dallas

     Long Term Leases                           Stable Performance                           Pension Fund JV                     High Growth Opportunity

(1) Figures above are at H&R’s ownership interest including equity accounted investments.

3                STABILITY, SECURITY & GROWTH through QUALITY, DIVERSIFICATION & SCALE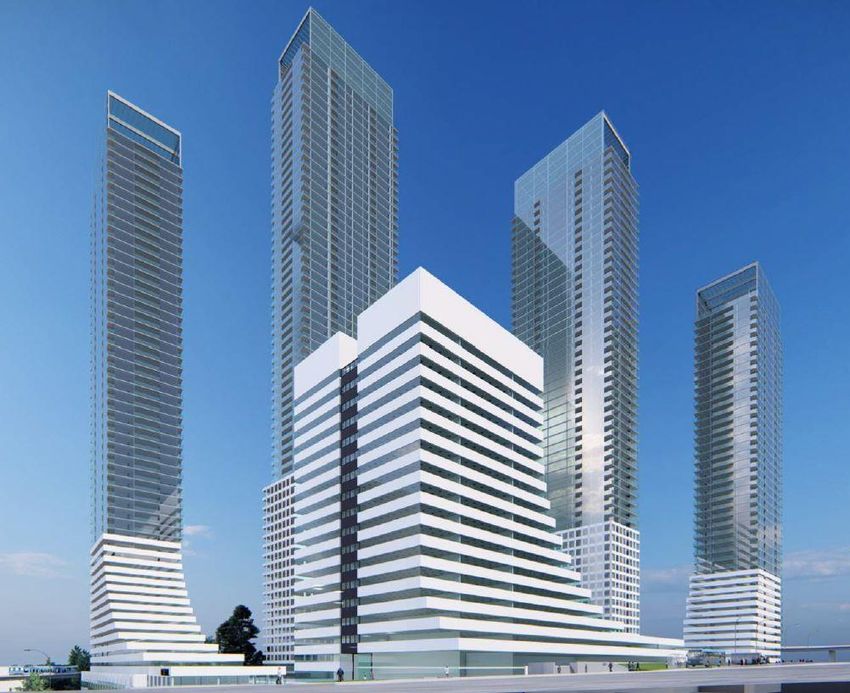
2020 Financial Highlights

    ▪ $1.1 billion of undrawn credit facilities available under H&R’s lines of credit
    ▪ Unencumbered asset pool of $3.7 billion
    ▪ 2020 FFO was $1.67 per Unit vs. $1.76 per Unit in 2019
    ▪ 2020 AFFO was $1.27 per Unit vs. $1.33 per Unit in 2019
    ▪ 2020 Payout ratio as a % of AFFO was 72.3%
    ▪ Bad debt expense included in FFO and AFFO above was $42.2M ($0.14 per Unit) in
      2020 vs. $2.2M ($0.007 per Unit) in 2019. Bad debt expense in Q4 2020 was $3.9M
      ($0.01 per Unit)
    ▪ H&R achieved an overall rent collection of 94% in January 2021, compared to 95% in
      Q4 2020, 95% in Q3 2020 and 91% in Q2 2020
    ▪ Due to the disruption caused by COVID-19, H&R decreased the fair value of its office
      and retail properties by $1.4 billion in 2020

4           STABILITY, SECURITY & GROWTH through QUALITY, DIVERSIFICATION & SCALE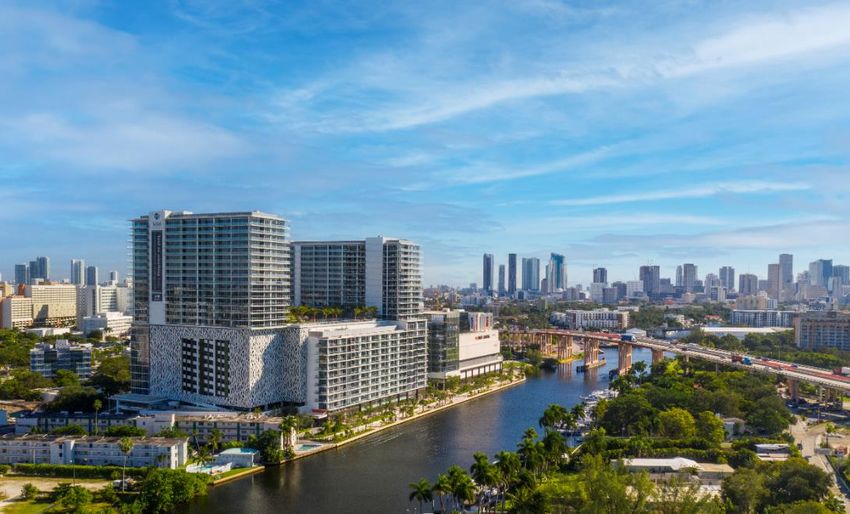
Portfolio Diversification

                              Fair Value of Investment Properties(1)
                           By Segment                                                                          By Region
                                                 Office                                                Ontario
                                                 39%                                                    31%

                                 $13.0                                                                               $13.0
                                 Billion                            Industrial
                                                                                       Alberta
                                                                                        17%
                                                                                                                     Billion
                                                                      10%                                                      United States
       Retail                                                                                                                       43%
       30%

                                                           Residential
                                                              21%                    Other Canadian Provinces
                                                                                               9%

    (1) Includes H&R’s proportionate share of equity accounted investments and excludes assets classified as held for sale.

5               STABILITY, SECURITY & GROWTH through QUALITY, DIVERSIFICATION & SCALE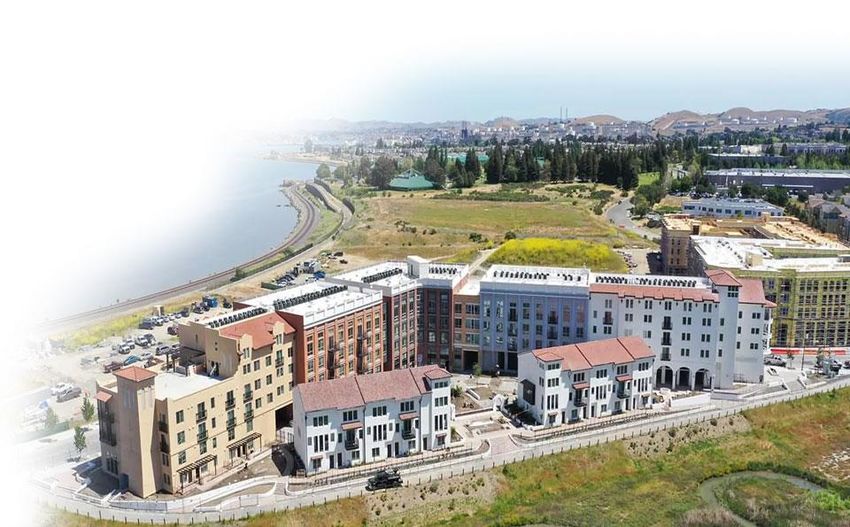
COVID-19 Update
    The financial results for the year ended December 31, 2020 include significant fair value adjustments recorded in Q1 2020.
    These adjustments are a result of H&R’s regular quarterly IFRS fair value process, and reflect:
    ▪ (i) an acceleration of challenging conditions in the retail landscape impacting the valuation assumptions of retail
      properties;
    ▪ (ii) energy sector volatility that may have impacted the credit quality of many companies operating in this industry and
      the related impacts on office property market fundamentals in markets with significant energy industry employment

     Fair Value Adjustment on Real Estate Assets                                                                                           Year ended
     (in thousands of Canadian dollars)                                                    Q1 2020     Q2 2020    Q3 2020    Q4 2020 December 31, 2020
     Operating Segment:
     Office                                                                             ($668,904)    ($34,210)   ($2,666)   ($6,049)       ($711,829)
     Retail                                                                              (656,358)      (7,882)    (7,804)   (15,190)        (687,234)
     Industrial                                                                              6,891      (4,518)    10,155     95,392          107,920
     Residential                                                                           19,600      (15,671)    93,353    (57,402)          39,880
     Fair value adjustment on real estate assets per the REIT's proportionate share     (1,298,771)    (62,281)    93,038     16,751        (1,251,263)
     Less: equity accounted investments                                                     (2,471)      4,605        (38)    53,209           55,305
     Fair value adjustment on real estate assets per the REIT's Financial Statements   ($1,301,242)   ($57,676)   $93,000    $69,960       ($1,195,958)

    ▪ Residential properties in U.S. Sun-Belt cities have seen an increase in demand since the start of COVID-19 and this has
      resulted in a decrease in the capitalization rates used as part of H&R’s regular quarterly IFRS fair value process in Q3
      2020
    ▪ Industrial properties have seen a continued rise in rental rates and an increase in investor demand which has resulted in
      a decrease in the capitalization rates used for these properties as part of H&R’s regular quarterly IFRS fair value process
      in Q4 2020
    ▪ The total fair value adjustment for the year ended December 31, 2020 of $1.2 billion resulted in an overall NAV per Unit
      decrease of $3.86

6                   STABILITY, SECURITY & GROWTH through QUALITY, DIVERSIFICATION & SCALE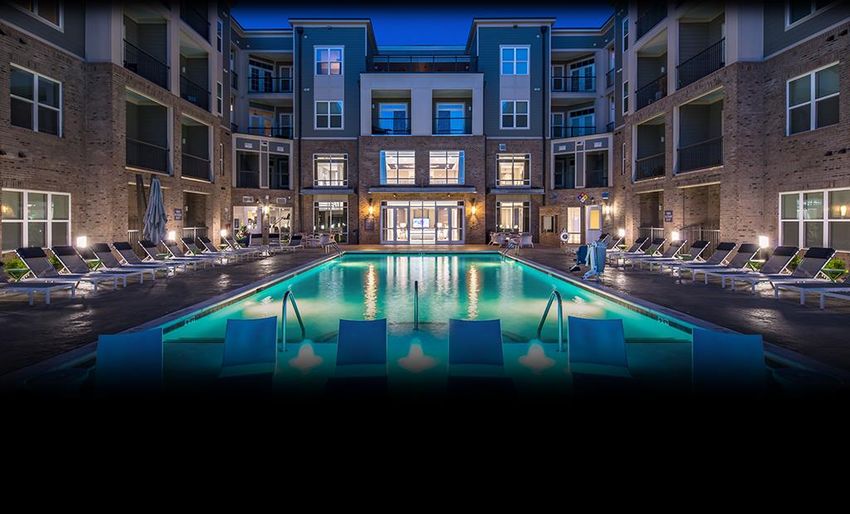
COVID-19: Rent Collection
     As of February 5, 2021, H&R’s rent collections since the onset of COVID-19 are as follows:

                                                               Average Share            Q2 2020           Q3 2020            Q4 2020 January 2021
                   (1)                                                        (2)                (2)                (2)                (2)                (2)
    Tenant Type                                                      of Rent        Collection         Collection         Collection         Collection
    Office                                                                45%              99%               99%                99%                99%
    Retail:
      Enclosed                                                           20%               65%               79%                83%                82%
      Other                                                              13%               93%               96%                95%                93%
    Total Retail                                                         33%               75%               86%                88%                86%
    Residential                                                           16%              97%               97%                97%                96%
    Industrial                                                             6%             100%               99%               100%                99%
         (3)
    Total                                                               100%               91%               95%                95%                94%

      ▪ H&R’s high-quality, long-term leased office portfolio delivered strong rent collection
        consistent with the profile of the tenant base, with 85.5% of revenues coming from
        investment-grade rated tenants.
      ▪ Rent collection was also strong in H&R’s industrial and residential portfolios, reflecting the
        stronger-than-average credit profile of the REIT’s tenant base across both of these portfolios.
     (1) Retail tenants in an office property for the purpose of this table have been classified as retail.
     (2) The average share of rent and collections include monthly billings for base rent and property operating costs.
     (3) April to September collections include an aggregate amount of $11.8 million received from the Government of Canada under the Canada Emergency
         Commercial Rent Assistance (“CECRA”) program.

7                  STABILITY, SECURITY & GROWTH through QUALITY, DIVERSIFICATION & SCALE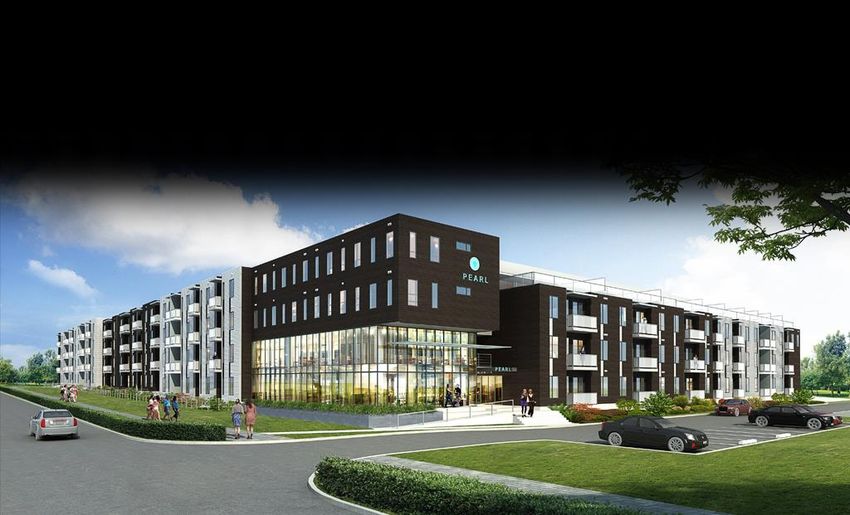
COVID-19: Bad Debt Expense

 The following table discloses H&R’s bad debt expense by segment. including the impact of COVID-19. H&R’s retail
 segment was impacted more than other segments due to government-mandated closures primarily affecting the
 REIT’s enclosed shopping centres.

Bad Debts Expense                                                                                                           Year ended
(in thousands of Canadian dollars)                                    Q1 2020         Q2 2020      Q3 2020    Q4 2020 December 31, 2020
Opera ti ng Segment:
Offi ce                                                                  $13               $446      $168       $721            $1,348
Reta i l                                                                  70              22,842    12,808     2,550            38,270
Indus tri a l                                                               -                52          -         -                52
Res i denti a l                                                          251               1,140      472        639             2,502
Ba d debt expens e per the REIT's proporti ona te s ha re                334              24,480    13,448     3,910            42,172
Les s : equi ty a ccounted i nves tments                                  13               (958)      (844)     (675)           (2,464)
Ba d debt expens e per the REIT's Fi na nci a l Sta tements             $347          $23,522      $12,604    $3,235           $39,708

8                 STABILITY, SECURITY & GROWTH through QUALITY, DIVERSIFICATION & SCALE
Office Portfolio

    ▪     Total value: $5.1 billion (weighted average cap rate: 6.40%)(1)
    ▪     Average remaining lease term to maturity: 12.2 years
    ▪     Occupancy: 99.6%
    ▪     Revenue from tenants with investment grade ratings: 85.5%

                                                                               Canada                           United
                                                          Ontario          Alberta    Other Subtotal                            Total
                                                                                                                States
        Number of properties                                  20                 4        4      28                  5           33
        Square feet (in thousands)                         5,375            2,607      893    8,875              1,865       10,740

        310-320-330 Front St.| Toronto            Corus Quay | Toronto                 Hess Tower | Houston   2 Gotham Centre | New York
    (1) Excludes one property which was classified as held for sale as at December 31, 2020.

9                 STABILITY, SECURITY & GROWTH through QUALITY, DIVERSIFICATION & SCALE
Alberta Office Portfolio

  ▪ H&R’s office tenants in Alberta are some of the strongest companies in the energy
    sector with an average remaining lease term of 16.0 years

  ▪ There are currently no vacancies in H&R’s Alberta Office Portfolio

                                                                         % of H&R's
                                           Square feet               Same-Asset Property            Remaining
                           Your Ownership at H&R's                    Operating Income              Lease Term                                     S&P Tenant
       Address           location Interest   Interest                   (cash basis)(1)               (years)              Major Tenant           Credit Rating
 th
5 Ave. at Centre St.     Calgary          100%      2,024,182                         13.8%                17.2       Ovintiv Inc.(2)             BBB- Negative
450-1st St., S.W.        Calgary           50%        465,594                          2.3%                10.3       TC Energy Corporation       BBB+ Stable
2767-2nd Ave.            Calgary          100%          69,793                         0.2%                18.2       AltaLink L.P.               A Stable
2611-3rd Ave.            Calgary           50%          47,613                         0.1%                18.2       AltaLink L.P.               A Stable
Total / Average                                     2,607,182                         16.4%                16.0

  (1) Same-asset property operating income (cash basis) includes the proportionate share of equity accounted investments and excludes straight-lining of contractual
      rent and realty taxes accounted for under IFRIC 21.
  (2) Ovintiv Inc. (formerly Encana Corporation) has sublet 27 floors to Cenovus Energy.

 10                 STABILITY, SECURITY & GROWTH through QUALITY, DIVERSIFICATION & SCALE
Retail Portfolio(1)
▪ Total value: $3.9 billion (weighted average cap rate: 7.00%)
▪ Average remaining lease term to maturity: 6.9 years
▪ Occupancy: 90.3%
Canada United States
Total
Ontario Alberta Other Subtotal ECHO Other Subtotal
Number of properties 36 17 14 67 243 17 260 327
Square feet (in thousands) 3,458 3,954 2,720 10,132 2,861 711 3,572 13,704
Enclosed
Shopping Grocery
Centre Anchored ECHO Other Total
Number of properties 17 22 243 45 327
Square feet (in thousands) 6,888 1,007 2,861 2,948 13,704
Weighted average cap rates 7.44% 6.45% 6.59% 6.55% 7.00%
Orchard Park | Kelowna Dufferin Mall | Toronto Stone Road Mall | Guelph
(1) Includes H&R’s proportionate share of equity accounted investments.
11 STABILITY, SECURITY & GROWTH through QUALITY, DIVERSIFICATION & SCALERetail Tenant Sales Mix(1)
By Gross Rent(2)
Full Service Restaurants
2% HBC
Entertainment (Casino & Theatre) 2%
Automotive 2% Fashion
5% 18%
Office/Financial
Institutions
5%
Food
7%
Walmart
/Grocery
/Liquor/
Cannibis
14%
General
Merchandise
9%
Large format Large format
fashion non-fashion
11% 13%
Personal Care/Service (including fitness)
12%
(1) Excluding ECHO.
(2) Gross Rent is based on estimated annualized gross revenue for retail tenants only, excluding straight-lining of contractual rent, rent amortization of tenant
inducements and capital expenditure recoveries. Retail revenue as a percentage of total revenue was 33% for the year ended December 31, 2020.
12 STABILITY, SECURITY & GROWTH through QUALITY, DIVERSIFICATION & SCALEPrimaris Enclosed Shopping Centres
▪ Certain properties were closed for business in Q2 2020 during the first wave of COVID-19 to comply with government mandates
while providing for certain essential service tenants to continue to operate out of these otherwise closed properties. Several of
these properties in Ontario and Manitoba were forced to close for a second time in Q4 2020 as the second wave of COVID-19
continues to negatively impact many parts of the world. The following sales figures exclude commercial retail unit tenants
occupying more than 15,000 feet:
All Store CRU Sales Same Store CRU Sales
(in thousands of Canadian dollars) (per square foot)
Rolling 12 month ended December 31 Rolling 12 month ended December 31
Primaris Enclosed Shopping Centres Location 2020 2019 % Change 2020 2019 % Change
(1)
Cataraqui Town Centre Kingston, ON $52,731 $82,583 (36.1%) $364 $554 (34.3%)
Dufferin Mall Toronto, ON 52,139 111,330 (53.2) 302 632 (52.2)
(1)
Grant Park Winnipeg, MB 16,648 26,225 (36.5) 320 484 (33.9)
(1)
Kildonan Place Winnipeg, MB 48,578 78,085 (37.8) 355 537 (33.9)
McAllister Place (1) Saint John, NB 42,283 52,275 (19.1) 362 431 (16.0)
Medicine Hat Mall Medicine Hat, AB 33,613 47,966 (29.9) 318 420 (24.3)
(2)
Northland Village Mall Calgary, AB 10,214 16,820 (39.3) 390 524 (25.6)
Orchard Park Shopping Centre Kelowna, BC 119,490 164,242 (27.2) 499 690 (27.7)
Park Place Shopping Centre Lethbridge, AB 57,924 81,917 (29.3) 448 629 (28.8)
Peter Pond Mall Fort McMurray, AB 52,262 68,744 (24.0) 509 647 (21.3)
Place d'Orleans(1) Orleans, ON 47,320 84,879 (44.3) 274 434 (36.9)
(1)
Place du Royaume Chicoutimi, QC 51,837 82,048 (36.8) 303 459 (34.0)
(1)
Regent Mall Fredericton, NB 59,960 80,180 (25.2) 455 597 (23.8)
Sherwood Park Mall Sherwood Park, AB 27,116 41,625 (34.9) 339 504 (32.7)
St. Albert Centre St. Albert, AB 20,192 33,823 (40.3) 307 481 (36.2)
Stone Road Mall Guelph, ON 63,752 103,609 (38.5) 381 599 (36.4)
Sunridge Mall Calgary, AB 54,996 87,509 (37.2) 332 516 (35.7)
(3)
Total $811,055 $1,243,860 (34.8%) $374 $551 (32.1%)
(1) All store sales and same store sales have been reported as if H&R owned 100% of these enclosed shopping centres.
(2) Northland Village is slated for redevelopment.
(3) The total same-store sales figures have been presented on a weighted average basis.
13 STABILITY, SECURITY & GROWTH through QUALITY, DIVERSIFICATION & SCALE(1)
Top 15 Retail Tenants by Revenue
% of rental income H&R owned Average lease
from investment Number of sq.ft. term to maturity Credit Ratings
Tenant properties (2) locations (in 000’s) (years)(3) (S&P)
Giant Eagle, Inc. 3.5% 201 1,636 10.6 Not Rated
Lowe's Companies, Inc. (4) 1.6 13 1,346 13.3 BBB+ Stable
(5)
Canadian Tire Corporation 1.3 17 577 5.9 BBB Negative
Shell Oil Products 1.1 14 182 2.2 AA- Negative
Loblaw Companies Limited (6) 0.9 18 262 8.0 BBB Stable
(7)
Empire Company Limited 0.9 14 492 10.3 BBB- Stable
(8)
The TJX Companies Inc. 0.8 16 403 6.3 A Negative
(9)
Walmart Inc. 0.7 9 751 6.6 AA Stable
Metro Inc. 0.7 12 420 5.8 BBB Stable
Bell Canada 0.5 17 52 2.1 BBB+ Stable
YM Inc.(10) 0.5 14 214 5.7 Not Rated
Hudson's Bay Company 0.4 6 589 6.5 Not Rated
Best Buy Co. Inc. 0.3 8 142 4.8 BBB Stable
(11)
Gap Inc. 0.3 9 121 4.7 BB- Negative
Publix Super Markets, Inc. 0.3 8 147 15.6 Not Rated
13.8% 376 7,334 9.9
(1) Includes the proportionate share of equity accounted investments.
(2) The percentage of rentals from investment properties is based on estimated annualized gross revenue excluding straight-lining of contractual rent, rent amortization of tenant inducements
and capital expenditure recoveries.
(3) Average lease term to maturity is weighted based on net rent.
(4) Lowe’s Companies, Inc. includes Rona.
(5) Canadian Tire Corporation includes Canadian Tire, Mark’s, Sport Chek, Atmosphere, Sports Experts and Party City.
(6) Loblaw Companies Limited includes Loblaw, No Frills and Shoppers Drug Mart.
(7) Empire Company Limited includes Sobeys Capital Inc., Safeway and Lawtons Drugs.
(8) The TJX Companies Inc. includes Winners, T.J. Maxx, Marshalls and Home Sense.
(9) Walmart Inc. includes Sam's Club.
(10) YM Inc. includes Amnesia, Bluenotes, Sirens, Suzy Shier, Urban Planet, Urban Kids and West 49.
(11) Gap Inc. includes Old Navy.
14 STABILITY, SECURITY & GROWTH through QUALITY, DIVERSIFICATION & SCALEIndustrial Portfolio(1)
▪ Total value: $1.2 billion (weighted average cap rate: 5.26%)(1)
▪ Average remaining lease term to maturity: 6.4 years
▪ Occupancy: 97.5%
Canada United
Total(2)
Ontario Alberta Other Subtotal States
Number of properties 37 19 28 84 3 87
Square feet (in thousands) 4,898 2,030 1,648 8,576 700 9,276
▪ H&R has a 50% ownership interest in 78 of the 87 properties
through a joint venture partnership with PSP Investment Board and
Crestpoint Real Estate Investments Ltd.
Sleep Country | GTA
(1) Excludes one property which was classified as held for sale as at December 31, 2020. Canadian Tire | GTA
(2) Includes H&R’s proportionate share of equity accounted investments.
15 STABILITY, SECURITY & GROWTH through QUALITY, DIVERSIFICATION & SCALECanadian Properties Under Development
(in thousands of Canadian Dollars)
At H&R's Ownership Interest
As at December 31, 2020 (in thousands of Canadian dollars)
Total Properties Costs Expected
Ownership Number of Development Under Remaining Yield
Interest Acres Budget Development to Complete on Cost
Current Developments:
140 Speirs Giffen Ave., Caledon, ON (1) 100.0% 4.7 $13,870 $5,409 $8,461 6.2%
34 Speirs Giffen Ave., Caledon, ON (1) 100.0% 4.9 15,533 6,017 9,516 7.4%
9.6 29,403 11,426 17,977
Future Developments:
Industrial Lands (Remaining lands), Caledon, ON (1) 100.0% 117.6 - 73,984 -
(2)
7333 Mississauga Rd. N., Mississauga, ON 100.0% 15.4 - 20,846 -
(3)
Slate Dr., Mississauga, ON 50.0% 24.6 - 19,839 -
(4)
3791 Kingsway, Burnaby, BC 50.0% 0.6 - 7,349 -
Total 167.8 $29,403 $133,444 $17,977
(1) H&R owns approximately 144 acres of land which is being held for development for up to 2.7 million square feet of industrial space. In June 2019,
construction commenced on the first three buildings totaling approximately 526,000 square feet. The first building, 205 Speirs Giffen Ave., was substantially
completed and transferred from properties under development to investment properties in Q4 2020. As a result of COVID-19, H&R has temporarily
suspended construction of the second and third buildings. In Q4 2020, H&R increased the expected yields on cost for both buildings due to a revision in
anticipated higher rents.
(2) Expected to be developed into two industrial buildings totalling approximately 329,000 square feet.
(3) Expected to be developed into one industrial building totalling approximately 500,000 square feet.
(4) Excess lands held for future-redevelopment. These lands are adjacent to the REIT’s 3777 Kingsway office tower of which it also has a 50% ownership interest.
16 STABILITY, SECURITY & GROWTH through QUALITY, DIVERSIFICATION & SCALEResidential Portfolio(1)
▪ Total value: U.S. $2.2 Billion (weighted average cap rate: 4.60%)
▪ Average age of properties: 5.6 years
▪ Occupancy: 88.1%
North
Texas Florida New York California Total
Carolina
Number of properties 9 7 5 1 1 23
Number of residential rental units 2,776 2,433 1,632 936 54 7,831
Ambrosio | Texas Jackson Park | New York Westshore | Florida
(1) Includes H&R’s proportionate share of equity accounted investments.
17 STABILITY, SECURITY & GROWTH through QUALITY, DIVERSIFICATION & SCALE▪ Strategy is to acquire or develop class A properties in U.S. Sun Belt cities where there is strong population and employment growth and to develop properties with partners in Gateway cities 18 STABILITY, SECURITY & GROWTH through QUALITY, DIVERSIFICATION & SCALE
U.S. Properties Under Development
     (in thousands of U.S. Dollars)

                                                                                                      At H&R Ownership Interest
                                                                                          Total          Properties             Costs       Construction      Expected      Expected
                                                        Ownership     Number      Development                Under      Remaining to           Financing          Yield   Completion
Development Name                                          Interest    of Acres          Budget        Development          Complete            Available        on Cost         Date
Current Developments:
 River Landing, Miami, FL(1)                                100.0%         2.3        $195,932            $183,001              $12,931           $       -       4.4%       Q1 2021
                                 (2)
 Shoreline, Long Beach, CA                                    31.2%        0.9          71,097               50,585              20,512           22,959          6.2%       Q3 2021
                                            (3)
 Hercules Project (Phase 2), Hercules, CA                     31.7%        2.8          31,186               21,789               9,397           11,674          6.0%       Q3 2021
                         (4)
 The Pearl, Austin, TX                                        33.3%        5.0          24,201               22,199               2,002               3,098       6.2%       Q3 2021
 Esterra Park, Seattle, WA (5)                                33.3%        1.1          31,859               27,624               4,235               7,370       6.0%       Q3 2021
                                                                          12.1         354,275              305,198              49,077           45,101
                           (6)
 Future Developments                                                      99.9                -              93,855                    -                  -
Total (in thousands of U.S. dollars)                                     112.0        $354,275            $399,053              $49,077          $45,101

 (1) In Q4 2020, the commercial portion of this project reached substantial completion and was transferred from properties under development to investment properties. The
     Residential portion of this project is shown above and will consist of 528 residential rental units.
 (2) 35-storey residential tower consisting of 315 luxury residential rental units and 6,450 square feet of retail space.
 (3) Total project spans 38.4 acres. Construction commenced in June 2018 on Phase 1 of this project which was substantially completed and transferred to investment properties
     in Q4 2020. Construction commenced in March 2019 on Phase 2 of this project which will consist of 232 residential rental units. Future phases will be announced as further
     development information becomes available.
 (4) Residential development consisting of 383 residential rental units which is close to major technology employers including Apple, IBM, Oracle and Samsung as well as the
     University of Texas at Austin and downtown Austin.
 (5) Seven-storey residential tower consisting of 263 residential rental units, which is part of a larger master planned community and is adjacent to transit, Microsoft
     Corporations’s headquarters, and future light rail which is expected to be completed in 2023.
 (6) Consists of seven separate parcels of land in the United States totalling 99.9 acres. H&R has a 31.7% interest in one of the parcels amounting to U.S. $12.1 million at H&R’s
     ownership interest. H&R is the sole owner of the remaining six parcels.

19                   STABILITY, SECURITY & GROWTH through QUALITY, DIVERSIFICATION & SCALE
River Landing - Miami, FL
▪ Prime urban mixed-use development
▪ 528 residential rental units
▪ 347,000 sf of urban retail
▪ 149,000 sf of office
20 STABILITY, SECURITY & GROWTH through QUALITY, DIVERSIFICATION & SCALERiver Landing – Miami, FL
▪ 1,000 feet of waterfront on the Miami river
▪ Adjacent to the Health District and close proximity to downtown Miami
▪ In Q4 2020, the retail and office portion of this project, known as “River Landing Commercial”, reached substantial
completion and was transferred from properties under development to investment properties
▪ Strong Leasing Progress:
▪ Retail occupancy was 65.3% as at December 31, 2020 which includes the following major tenants: Publix Super Markets Inc.,
Hobby Lobby, Burlington, Ross Stores Inc., Old Navy and Planet Fitness
▪ Committed occupancy for retail space as at December 31, 2020 was 80.3% with the remaining retail leaseup expected to occur
during the balance 2021
▪ As at December 31, 2020, 134 residential leases have been entered into and occupancy was 21.4%, exceeding management’s
expectations on leasing velocity
▪ The total cost of the project is expected to be
completed on budget at approximately
U.S. $495.9 million
21 STABILITY, SECURITY & GROWTH through QUALITY, DIVERSIFICATION & SCALEShoreline Gateway - Long Beach, CA ▪ Land acquired July 16, 2018 ▪ H&R ownership: 31.2% ▪ 35-storey residential tower consisting of 315 residential rental units ▪ 6,450 sf of retail space ▪ Development budget: U.S. $227.1M at 100% level ▪ Construction financing: U.S. $132.0M secured at 100% level ▪ Will become the tallest residential tower in Long Beach with views overlooking the Pacific Ocean ▪ Expected to be completed in Q3 2021 22 STABILITY, SECURITY & GROWTH through QUALITY, DIVERSIFICATION & SCALE
Hercules Bayfront – San Francisco, CA

     ▪ H&R ownership: 31.7%
     ▪ 38.4 acres of land to be developed into a waterfront master planned community which will be
       surrounded by a future intermodal transit centre
     ▪ In Q4 2020, Phase 1 known as “The Exchange at Bayfront” consisting of 172 residential rental
       units, including lofts and townhomes and 13,762 square feet of ground level retail space
       reached substantial completion and was transferred from properties under development to
       investment properties
        ▪ As at December 31, 2020, 120 leases had been entered into and occupancy was 68.0%
        ▪ At the 100% level, the property was valued at approximately U.S. $87.8 million compared to costs of
          approximately U.S. $81.3 million, resulting in a fair value gain of U.S. $6.5 million since the start of the
          project
     ▪ Phase 2 known as “The Grand at Bayfront” will consist of
       232 residential rental units including a state-of-the-art fitness
       centre, bike shop, residents lounge and sporting club
        ▪ Total development budget of
          U.S. $98.4 million and construction financing
          of U.S. $65.4 million has been secured, both
          at the 100% level
        ▪ Expected to be completed in Q3 2021

23            STABILITY, SECURITY & GROWTH through QUALITY, DIVERSIFICATION & SCALE
The Pearl - Austin, TX
▪ H&R ownership: 33.3% ▪ This residential development site is close to
major technology employers including
▪ 383 residential rental units Apple, IBM, Oracle and Samsung, as well as
▪ Development budget: U.S. $72.2M and the University of Texas at Austin and
construction financing of U.S. $47.9M has been downtown Austin
secured, both at 100% level
▪ Expected to be completed in Q3 2021
24 STABILITY, SECURITY & GROWTH through QUALITY, DIVERSIFICATION & SCALEEsterra Park - Seattle, WA
▪ H&R ownership: 33.3% ▪ This residential development site is part of a larger
master planned community and is adjacent to
▪ 263 residential rental units Microsoft Corporation’s headquarters, bus transit and
▪ Development budget: U.S. $95.7M and future light rail which is expected to be completed in
construction financing of U.S. $66.5M has been 2023
secured, both at 100% level
▪ Expected to be completed in Q3 2021
25 STABILITY, SECURITY & GROWTH through QUALITY, DIVERSIFICATION & SCALEFuture Intensification Opportunities
Office Opportunities: Retail Opportunities:
▪ 3777 & 3791 Kingsway Street, Burnaby, BC ▪ Dufferin Mall, Toronto, ON
▪ 145 Wellington Street W., Toronto, ON ▪ Grant Park, Winnipeg, MB
▪ 53 & 55 Yonge Street, Toronto, ON ▪ Kildonan Place, Winnipeg, MB
▪ 310-320-330 Front Street W., Toronto, ON ▪ Northland Village, Calgary, AB
▪ Orchard Park Shopping Centre, Kelowna, BC
▪ Place d’Orleans, Orleans, ON
▪ Sunridge Mall, Calgary, AB
26 STABILITY, SECURITY & GROWTH through QUALITY, DIVERSIFICATION & SCALE3777 & 3791 Kingsway – Burnaby, BC ▪ In June 2020, H&R along with its partner, submitted a re-zoning application for the east and north portions of its 3777 & 3791 Kingsway sites ▪ The proposal could add over 2,000 residential rental units in four mixed-use high density towers including retail and residential uses with approximately 1,800,000 square feet of residential area and 44,000 square feet of commercial area ▪ The REIT expects to obtain approval for its re-zoning and site plan applications in Q4 2021 27 STABILITY, SECURITY & GROWTH through QUALITY, DIVERSIFICATION & SCALE
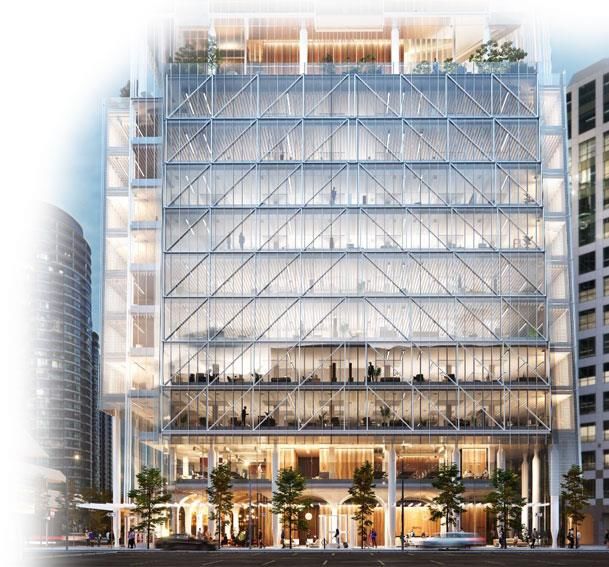
145 Wellington St. W. – Toronto, ON

▪ 145 Wellington St. W. is located at the interface between Toronto’s
  Financial District and Entertainment District.
▪ In August 2019, H&R submitted a rezoning application for the
  redevelopment of 145 Wellington St. W., which is currently a 13-storey
  office building
▪ The proposed project would redevelop the subject site with a full office
  replacement in a new modern 13-storey podium, topped with a 52-storey
  residential tower, for an overall building height of 65 storeys
▪ A total of 157,500 square feet of office space
  and 1,750 square feet of grade-related retail
  and 476 new residential rental units is proposed
▪ Re-zoning and site plan approval is
  expected in Q4 2021

28       STABILITY, SECURITY & GROWTH through QUALITY, DIVERSIFICATION & SCALE
53 & 55 Yonge St. – Toronto, ON

     ▪ 53 & 55 Yonge St., is located in the heart of Toronto’s Financial District
     ▪ In November 2020, the REIT acquired 53 Yonge St., a five-storey
       11,110 square foot office property, for $11.5 million
     ▪ The two properties encompass approximately 0.37 acres and the REIT
       submitted a re-zoning application in January 2021 to replace the
       existing 13-storey and five-storey office buildings with a 66-storey
       residential and office tower with retail uses on the first two floors
     ▪ This further breaks down into approximately
       12,000 square feet of retail space, 146,000 square
       feet of office space and 283,000 square feet of
       residential space (approximately 500 residential
       rental units)
     ▪ The REIT expects to obtain approval for its
       re-zoning and site plan applications in Q4 2022

29           STABILITY, SECURITY & GROWTH through QUALITY, DIVERSIFICATION & SCALE
310 Front St. – Toronto, ON ▪ 310 Front St. is located at the interface between Toronto’s Financial District and Entertainment District. ▪ H&R plans to submit a re-zoning application for a 69-storey mixed use development including retail, residential and office uses. ▪ The development will replace the existing eight- storey office building at 310 Front St., and will integrate into H&R’s larger office block which incudes 320 and 330 Front St. ▪ The project will include approximately 118,000 square feet of office, 2,000 square feet of retail and 463,000 square feet of residential space ▪ H&R expects to obtain approval for its re-zoning and site plan applications in Q4 2022 30 STABILITY, SECURITY & GROWTH through QUALITY, DIVERSIFICATION & SCALE
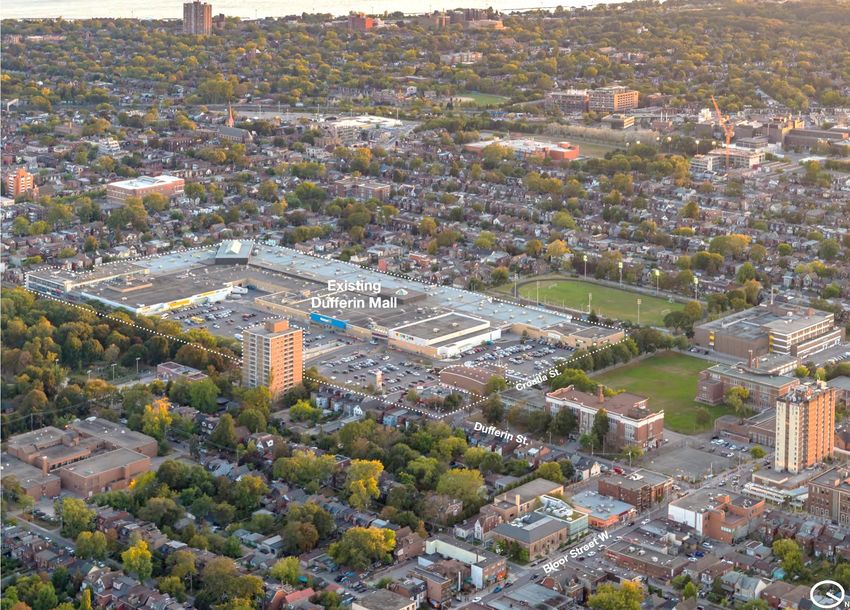
Dufferin Grove Village – Toronto, ON

     ▪ In July 2019, H&R submitted combined applications for rezoning and for the
       redevelopment of the surface parking lots, drive-through restaurants and strip plaza that
       currently occupy the north end of Dufferin Mall to create “Dufferin Grove Village”
     ▪ The proposed project would replace the surface parking with four residential buildings
       over two blocks
     ▪ This new community is in direct proximity to Dufferin Station on the TTC’s Bloor Line,
       and it introduces a mix of residential and commercial uses including, Dufferin Commons,
       a new public park
     ▪ The west block would support two residential buildings
       of 35 and 39 storeys, and the east block would support
       two residential buildings of 14 and 23 storeys.
     ▪ Combined, they would introduce approximately
       1,135 residential rental units to the site as well
       as 75,000 square feet of retail space.
     ▪ Re-zoning and site plan approval is expected
       in Q4 2021

31           STABILITY, SECURITY & GROWTH through QUALITY, DIVERSIFICATION & SCALE
Top 15 Tenants by Revenue(1)
Predictable and stable income from long-term leases with high quality investment grade tenants
% of Rentals from Average Lease
Investment Number of H&R owned Term to Maturity Credit Ratings
Tenant Properties(2) Locations sq.ft. (in 000’s) (years)(3) (S&P)
1. Ovintiv Inc. (formerly Encana Corporation) (4) 11.9% 1 1,997 17.4 BBB- Negative
2. Bell Canada 8.4 23 2,536 13.6 BBB+ Stable
3. Hess Corporation 5.7 1 845 12.2 BBB- Negative
4. New York City Department of Health 4.0 1 660 9.9 AA Stable
5. Giant Eagle, Inc. 3.5 201 1,636 10.6 Not Rated
6. Canadian Tire Corporation(5) 3.0 19 2,681 6.0 BBB Negative
7. TC Energy Corporation 1.9 1 466 10.3 BBB+ Stable
8. Corus Entertainment Inc. 1.9 1 472 12.2 BB Negative
9. Lowe's Companies, Inc.(6) 1.6 13 1,346 13.3 BBB+ Stable
10. Telus Communications 1.2 17 356 5.2 BBB+ Negative
11. Shell Oil Products 1.1 14 182 2.2 AA- Negative
12. Toronto-Dominion Bank 1.1 7 286 6.6 AA- Stable
13. Public Works and Government Services, Canada 1.0 5 321 4.5 AAA Stable
14. Loblaw Companies Limited(7) 1.0 19 273 8.4 BBB Stable
15. Royal Bank of Canada 0.9 5 247 4.4 AA- Stable
48.2% 328 14,304 11.6
(1) Includes the proportionate share of equity accounted investments.
(2) The percentage of rentals from investment properties is based on estimated annualized gross revenue excluding straight-lining of contractual rent, rent amortization of tenant inducements
and capital expenditure recoveries.
(3) Average lease term to maturity is weighted based on net rent.
(4) Ovintiv Inc. has sublet 27 floors to Cenovus Energy at The Bow located in Calgary, AB. Ovintiv Inc.’s lease obligations expire on May 13, 2038.
(5) Canadian Tire Corporation includes Canadian Tire, Mark’s, Sport Chek, Atmosphere, Sports Experts and Party City.
(6) Lowe’s Companies, Inc. includes Rona.
(7) Loblaw Companies Limited includes Loblaw, No Frills and Shoppers Drug Mart.
32 STABILITY, SECURITY & GROWTH through QUALITY, DIVERSIFICATION & SCALELimited Lease Rollover (1)
▪ Low-risk rollover schedule
▪ Well diversified by property and geography
▪ Average remaining lease term of 9.5 years, one of the longest in the industry
Canadian Portfolio
(in 000’s sq.ft.)
2,345 Industrial
2,104
1,681 Retail
1,212 1,035 Office
2021 2022 2023 2024 2025
% of the REIT‘s GLA 4% 7% 3% 6% 5%
U.S. Portfolio
(in 000’s sq.ft.)
Industrial
Retail
690 457
222 292 Office
158
2021 2022 2023 2024 2025
% of the REIT’s GLAStrong Balance Sheet
BBB (High) Unencumbered Available under Interest WAIR(1) WATM(1)
Stable Trend by Assets Lines of Credit Coverage
DBRS $3.7B $1,103M 3.6% 3.5 years
3.1x
Debt(1) to Total Assets(2)
Unsecured
Mortgages 29%
Debentures 12%
50%
47.7%
44.3% 44.6% 44.6% 44.4%
Unsecured Term 45%
Total Loans 5%
Capitalization 40%
$12.6 Billion Lines of Credit
4% 35%
Unitholders' Equity 30%
and Exchangeable 2016 2017 2018 2019 2020
Units 50%
(1) Debt includes mortgages payable, debentures payable, unsecured term loans and lines of credit.
(2) The increase in debt to total assets from 2019 to 2020 is primarily due to fair value adjustments to certain office and retail properties totaling $1.2 billion which is
further discussed on slide 6 of this Investor Presentation.
34 STABILITY, SECURITY & GROWTH through QUALITY, DIVERSIFICATION & SCALESummary
▪ One of the largest REITs in Canada with total assets of $13.4 Billion
▪ High quality real estate
▪ Predictable income
▪ Creditworthy tenants
▪ Long-term leases, with contractual rent escalations
▪ High, stable occupancy
▪ Minimal near term lease expiries and debt maturities
▪ Development pipeline expected to create significant value
and enhance cash flows
▪ Solid balance sheet with a conservative payout ratio
▪ Fully internalized and aligned management
▪ CEO, founders and trustees own approximately
6% of the REIT (including exchangeable units)
▪ NAV per unit is $21.93(1)
(1) Refer to the December 31, 2020 MD&A for a detailed calculation.
35 STABILITY, SECURITY & GROWTH through QUALITY, DIVERSIFICATION & SCALEYou can also read