STABILITY, SECURITY & GROWTH - THROUGH QUALITY, DIVERSIFICATION & SCALE INVESTOR PRESENTATION - H&R REIT
←
→
Page content transcription
If your browser does not render page correctly, please read the page content below
STABILITY,
                                                SECURITY
                                                & GROWTH
                                                THROUGH QUALITY,
                                                DIVERSIFICATION & SCALE

INVESTOR
PRESENTATION
As at March 31, 2021
unless otherwise noted

H&R Real Estate Investment Trust (TSX: HR.UN)
Caution Regarding Forward-looking Statements
                                                          Forward Looking Statements
Certain statements made in this presentation will contain forward‐looking information within the meaning of applicable securities laws (also known as forward‐looking
statements) including, among others, statements made or implied relating to H&R’s objectives, strategies to achieve those objectives, H&R’s beliefs, plans, estimates,
projections and intentions and statements with respect to H&R’s development activities, including planned future expansions, and building of new properties; the expected
yield on cost of H&R’s developments and other investments; the expected costs and timing of any of H&R’s projects; and the expected occupancy, management’s
expectations regarding future intensification opportunities including the timing of approvals for re-zoning and site plan applications, the impact of the COVID-19 virus on the
REIT and REIT’s tenants, the REIT’s bad debt and expected credit loss. Statements concerning forward‐looking information can be identified by words such as “outlook”,
“objective”, “may”, “will”, “expect”, “intend”, “estimate”, “anticipate”, “believe”, “should”, “plans”, “project”, “budget” or “continue” or similar expressions suggesting
future outcomes or events. Such forward‐looking statements reflect H&R’s current beliefs and are based on information currently available to management.
Forward‐looking statements are provided for the purpose of presenting information about management’s current expectations and plans relating to the future and readers
are cautioned that such statements may not be appropriate for other purposes. These statements are not guarantees of future performance and are based on H&R’s
estimates and assumptions that are subject to risks and uncertainties, including those discussed in H&R’s materials filed with the Canadian securities regulatory authorities
from time to time, including H&R’s MD&A for the quarter ended March 31, 2021, and H&R’s most recently filed annual information form, which could cause the actual
results and performance of H&R to differ materially from the forward‐looking statements made in this presentation. Although the forward‐looking statements made in this
presentation are based upon what H&R believes are reasonable assumptions, there can be no assurance that actual results will be consistent with these forward‐looking
statements. Readers are also urged to examine H&R’s materials filed with the Canadian securities regulatory authorities from time to time as they may contain discussions
on risks and uncertainties which could cause the actual results and performance of H&R to differ materially from the forward‐looking statements made in this presentation.
All forward‐looking statements made in this presentation are qualified by these cautionary statements. These forward‐looking statements are made as of May 13, 2021 and
H&R, except as required by applicable law, assumes no obligation to update or revise them to reflect new information or the occurrence of future events or circumstances.

                                                                  Non-GAAP Measures
The REIT’s audited annual financial statements are prepared in accordance with International Financial Reporting Standards (“IFRS”). H&R’s management uses a number of
measures which do not have a meaning recognized or standardized under IFRS or Canadian Generally Accepted Accounting Principles (“GAAP”). The non-GAAP measures
REIT’s proportionate share, property operating income (cash basis), Same-Asset property operating income (cash basis), Funds from Operations (“FFO”), Adjusted Funds
from Operations (“AFFO”), Payout Ratio per Unit as a % of AFFO, Interest Coverage ratio and Net Asset Value (“NAV”), as well as other non-GAAP measures discussed
elsewhere in this presentation, should not be construed as an alternative to financial measures calculated in accordance with GAAP. Further, H&R’s method of calculating
these supplemental non-GAAP financial measures may differ from the methods of other real estate investment trusts or other issuers, and accordingly may not be
comparable. H&R uses these measures to better assess its underlying performance and provides these additional measures so that investors may do the same. These non-
GAAP financial measures are more fully defined and discussed in H&R’s MD&A as at and for the three months ended March 31, 2021, available at www.hr-reit.com and on
www.sedar.com.

                                                                                 Other
All figures have been reported at H&R’s ownership interest unless otherwise stated.
Balance Sheet figures have been converted at $1.26 CAD for each U.S. $1.00.
Income Statement figures have been converted at $1.27 CAD for each U.S. $1.00.

 2                  STABILITY, SECURITY & GROWTH through QUALITY, DIVERSIFICATION & SCALE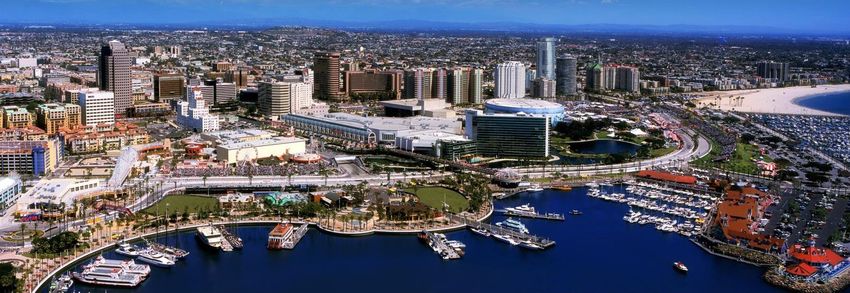
Stability, Security & Growth through
Quality, Diversification & Scale

     One of the Largest REITs in
                                                                                                                         Fully Internalized Management
     Canada with total assets of                                           H&R REIT                                              (Insiders own 6%)
            $13.2 billion

           Office(1)                                   Retail(1)                              Industrial(1)                            Residential(1)
                                                            (Primaris)                                                                 (Lantower Residential)

         32 Properties                               322 Properties                              86 Properties                           24 Properties
    ~10,568,000 Square Feet                     ~13,653,000 Square Feet                     ~9,236,000 Square Feet               8,141 Residential Rental Units

The Bow,    Front St.,   Corus Quay,        Orchard Park,            Dufferin Mall,    Purolator,           Unilever,            Grande Pines,           Legacy Lakes,
 Calgary    Toronto        Toronto            Kelowna                  Toronto          Calgary            Mississauga             Orlando                  Dallas

     Long Term Leases                           Stable Performance                           Pension Fund JV                     High Growth Opportunity

(1) Figures above are at H&R’s ownership interest including equity accounted investments.

3                STABILITY, SECURITY & GROWTH through QUALITY, DIVERSIFICATION & SCALE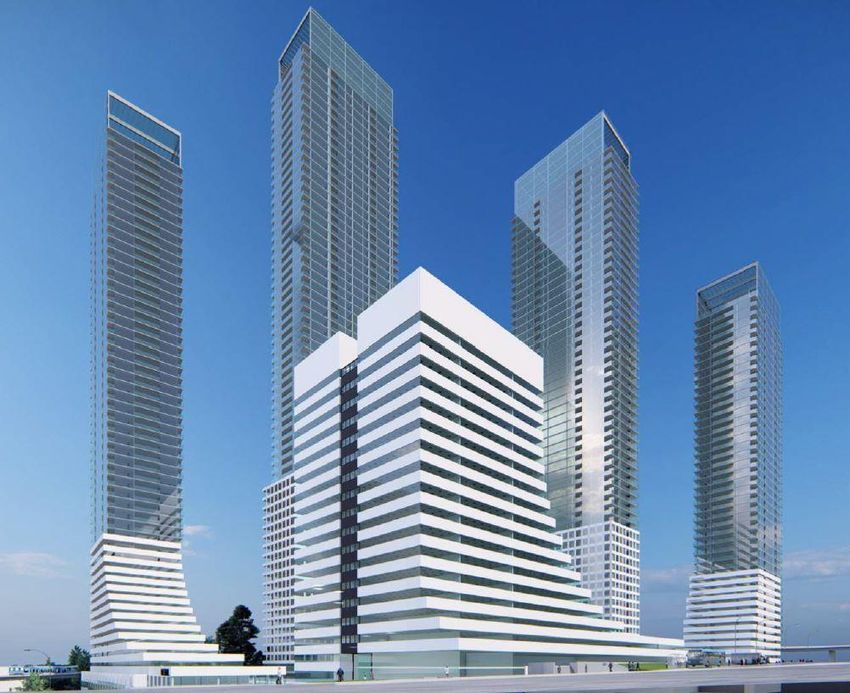
Q1 2021 Financial Highlights

    ▪ FFO was $0.40 per Unit vs. $0.42 per Unit in Q4 2020 and $0.45 per Unit in Q1 2020
    ▪ AFFO was $0.32 per Unit vs. $0.22 per Unit in Q4 2020 and $0.40 per Unit in Q1 2020
    ▪ Payout ratio as a % of AFFO was 53.6%
    ▪ Bad debt expense for the three months ended March 31, 2021 of $1.0 million compared
      to $3.2 million for Q4 2020 and $0.3 million for Q1 2020
    ▪ H&R achieved an overall rent collection of 94% in April 2021, compared to 96% in Q1 2021
      and 96% in Q4 2020
    ▪ The first of two residential towers at River Landing in Miami, FL reached substantial
      completion and was transferred from properties under development to investment
      properties
    ▪ H&R acquired 12.4 acres of vacant land in Jersey City, NJ for U.S. $162.0 million, and
      received approximately U.S. $146.2 million for the repayment of the outstanding
      mortgage receivable secured by this land
    ▪ H&R currently has three properties in lease-up (see slide 5): River Landing, Phase 1 of the
      Hercules Project and Jackson Park
    ▪ $1.4 billion of undrawn credit facilities available under H&R’s lines of credit
    ▪ Unencumbered asset pool of $3.9 billion
4           STABILITY, SECURITY & GROWTH through QUALITY, DIVERSIFICATION & SCALE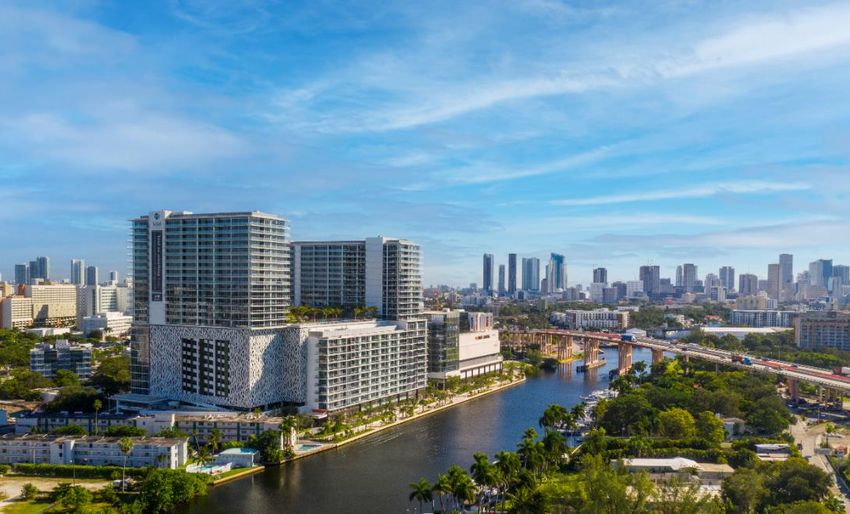
Properties in Lease-up

▪ River Landing; Miami, FL
      ▪ In Q4 2020 and Q1 2021, U.S. $294.3 million and U.S. $118.4 million, respectively, were transferred from
        properties under development to investment properties
      ▪ Q1 2021 property operating income (cash basis) was approximately U.S. $0.6 million
      ▪ Annual property operating income (cash basis) once lease-up is complete is expected to U.S. $24.8 million
▪ Phase 1 of the Hercules Project; Hercules, CA(1)
      ▪ In Q4 2020, U.S. $25.7 million was transferred from properties under development to investment properties
      ▪ Q1 2021 property operating income (cash basis) was approximately U.S. $0.3 million
      ▪ Annual property operating income (cash basis) once lease-up is complete is expected to be U.S. $1.4 million
▪ Jackson Park; Long Island City, NY(1)
      ▪ Q1 2021 property operating income (cash basis) was approximately U.S. $3.0 million
      ▪ Prior to COVID-19, property operating income (cash basis) was approximately U.S. $8.0 million in Q1 2020

    (1) All figures have been stated at H&R’s ownership interest.

5                 STABILITY, SECURITY & GROWTH through QUALITY, DIVERSIFICATION & SCALE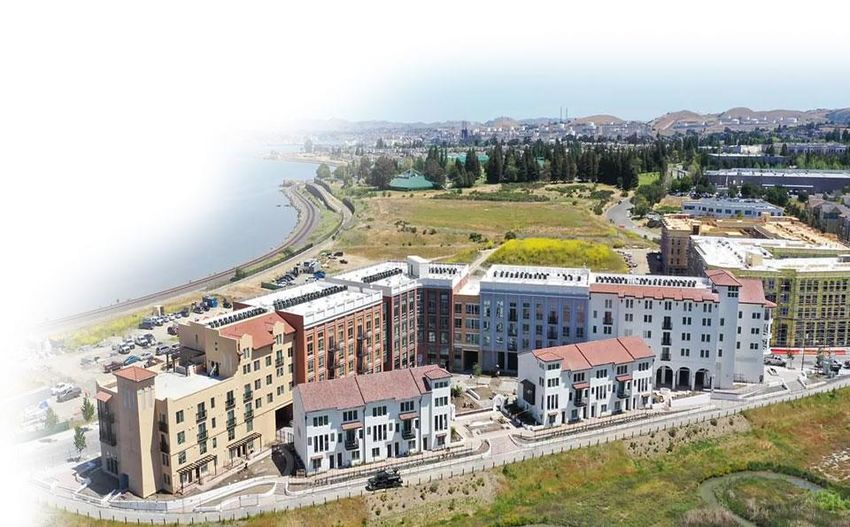
Portfolio Diversification

                          Fair Value of Investment Properties(1)
                      By Segment                                                                          By Region

                                           Office                                            Ontario
                                            38%                                               30%

                           $13.1                                                                            $13.1
                                                              Industrial
                           Billion                               9%
                                                                              Alberta
                                                                               18%
                                                                                                            Billion
                                                                                                                              United States
    Retail                                                                                                                        43%
    31%

                                                      Residential
                                                         22%
                                                                             Other Canadian Provinces
                                                                                       9%

    (1) Includes H&R’s proportionate share of equity accounted investments and excludes assets classified as held for sale.

6            STABILITY, SECURITY & GROWTH through QUALITY, DIVERSIFICATION & SCALE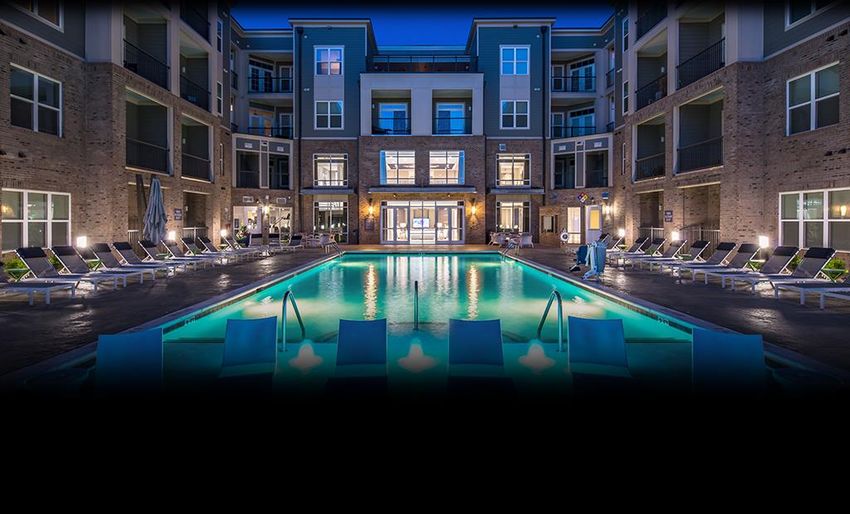
COVID-19: Rent Collection & Bad Debt Expense

    As of May 7, 2021, H&R’s rent collections are as follows:

                                                                                             Share of            Q4 2020           Q1 2021          April 2021
                   (1)                                                                               (2)                  (2)                (2)                (2)
    Tenant Type                                                                                 Rent        Collection          Collection         Collection
    Office                                                                                       44%               100%               99%                99%
    Retail:
      Enclosed                                                                                   20%                87%               89%                81%
      Other                                                                                      14%                96%               96%                94%
    Total Retail                                                                                 34%                90%               92%                86%
    Residential                                                                                  16%                97%               96%                96%
    Industrial                                                                                     6%              100%              100%               100%
    Total                                                                                       100%                96%               96%                94%

     ▪ H&R’s high-quality, long-term leased office portfolio delivered strong rent collection
       consistent with the profile of the tenant base, with 85.8% of revenues coming from
       investment-grade rated tenants.
     ▪ Rent collection was also stable in H&R’s industrial and residential portfolios, reflecting the
       stronger-than-average credit profile of the REIT’s tenant base across both of these portfolios.
     ▪ H&R has recorded a bad debt expense for Q1 2021 of $1.0 million compared to $3.2 million
       for Q4 2020 and $0.3 million for Q1 2020.
    (1) Retail tenants in an office property for the purpose of this table have been classified as retail.
    (2) The average share of rent and collections includes monthly billings for base rent and property operating costs.

7                 STABILITY, SECURITY & GROWTH through QUALITY, DIVERSIFICATION & SCALE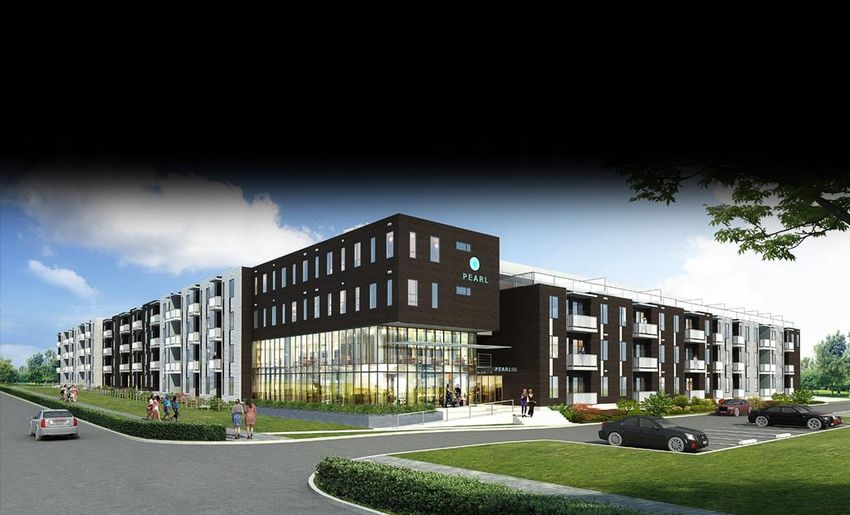
Office Portfolio

    ▪     Total value: $5.1 billion (weighted average cap rate: 6.54%)
    ▪     Average remaining lease term to maturity: 12.2 years
    ▪     Occupancy: 99.7%
    ▪     Revenue from tenants with investment grade ratings: 85.8%

                                                                         Canada                         United
                                                     Ontario         Alberta    Other Subtotal                          Total
                                                                                                        States
        Number of properties                             20                4        4      28                4           32
        Square feet (in thousands)                    5,375           2,607      893    8,875            1,693       10,568

        310-320-330 Front St.| Toronto        Corus Quay | Toronto             Hess Tower | Houston   2 Gotham Centre | New York

8                STABILITY, SECURITY & GROWTH through QUALITY, DIVERSIFICATION & SCALE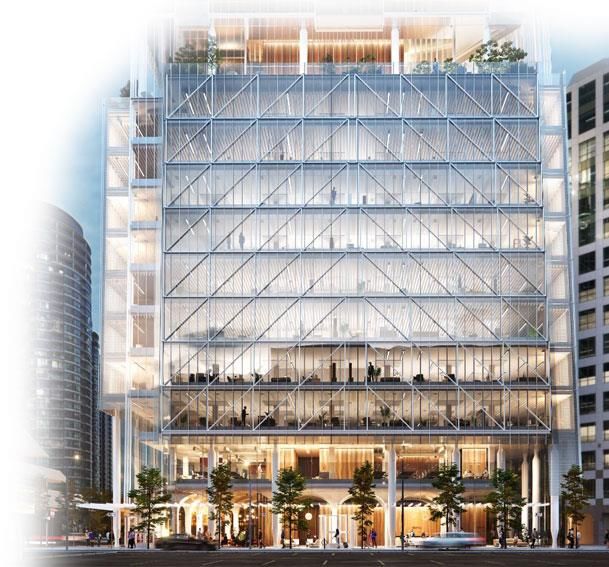
Alberta Office Portfolio

  ▪ H&R’s office tenants in Alberta are some of the strongest companies in the energy
    sector with an average remaining lease term of 15.8 years

  ▪ There are currently no vacancies in H&R’s Alberta Office Portfolio

                                                                         % of H&R's
                                           Square feet               Same-Asset Property            Remaining
                           Your Ownership at H&R's                    Operating Income              Lease Term                                     S&P Tenant
          Address        location Interest   Interest                   (cash basis)(1)               (years)              Major Tenant           Credit Rating
 th
5 Ave. at Centre St.     Calgary          100%      2,024,182                         15.0%                16.9       Ovintiv Inc.(2)             BBB- Negative
450-1st St., S.W.        Calgary           50%        465,594                          2.4%                10.1       TC Energy Corporation       BBB+ Stable
2767-2nd Ave.            Calgary          100%          69,793                         0.2%                17.9       AltaLink L.P.               A Stable
2611-3rd Ave.            Calgary           50%          47,613                         0.2%                17.9       AltaLink L.P.               A Stable
Total / Average                                     2,607,182                         17.8%                15.8

  (1) Same-asset property operating income (cash basis) includes the proportionate share of equity accounted investments and excludes straight-lining of contractual
      rent and realty taxes accounted for under IFRIC 21.
  (2) Ovintiv Inc. (formerly Encana Corporation) has sublet 27 floors to Cenovus Energy.

      9             STABILITY, SECURITY & GROWTH through QUALITY, DIVERSIFICATION & SCALE
Retail Portfolio(1)
     ▪ Total value: $4.0 billion (weighted average cap rate: 6.79%)
     ▪ Average remaining lease term to maturity: 6.8 years
     ▪ Occupancy: 90.3%
                                                                       Canada                        United States
                                                                                                                          Total
                                                   Ontario         Alberta    Other Subtotal     ECHO     Other Subtotal
     Number of properties                              36               17       14      67        238       17      255    322
     Square feet (in thousands)                     3,458           3,946     2,720 10,124       2,852      677    3,529 13,653
                                                                     Enclosed
                                                                     Shopping          Grocery
                                                                       Centre         Anchored      ECHO           Other         Total
     Number of properties                                                  17               22        238             45          322
     Square feet (in thousands)                                         6,881            1,007      2,852          2,913       13,653
     Weighted average cap rates                                         7.14%            6.42%      6.58%          6.27%        6.79%

           Orchard Park | Kelowna                                      Dufferin Mall | Toronto              Stone Road Mall | Guelph
     (1) Includes H&R’s proportionate share of equity accounted investments.

10                STABILITY, SECURITY & GROWTH through QUALITY, DIVERSIFICATION & SCALE
Retail Tenant Sales Mix(1)
By Gross Rent(2)
Full Service Restaurants
2% HBC
Entertainment (Casino & Theatre) 2%
Automotive 2% Fashion
4% 17%
Office/Financial
Institutions
6%
Food
7% Walmart
/Grocery
/Liquor/
Cannibis
14%
General
Merchandise
9%
Large format Large format
fashion non-fashion
12% 13%
Personal Care/Service (including fitness)
12%
(1) Excluding ECHO.
(2) Gross Rent is based on estimated annualized gross revenue for retail tenants only, excluding straight-lining of contractual rent, rent amortization of tenant
inducements and capital expenditure recoveries. Retail revenue as a percentage of total revenue was 33% for the year ended March 31, 2021.
11 STABILITY, SECURITY & GROWTH through QUALITY, DIVERSIFICATION & SCALEPrimaris Enclosed Shopping Centres
▪ Certain properties have been forced to close for business throughout the COVID-19 pandemic in order to comply with
government mandates. Specific essential service tenants have been able to continue to operate out of these otherwise closed
properties. The following sales figures exclude commercial retail unit tenants occupying more than 15,000 feet.
All Store CRU Sales Same Store CRU Sales
(in thousands of Canadian dollars) (per square foot)
Rolling 12 month ended March 31 Rolling 12 month ended March 31
Primaris Enclosed Shopping Centres Location 2021 2020 % Change 2021 2020 % Change
Cataraqui Town Centre(1) Kingston, ON $46,558 $82,438 (43.5%) $321 $552 (41.8%)
Dufferin Mall Toronto, ON 40,564 110,796 (63.4) 246 653 (62.3)
(1)
Grant Park Winnipeg, MB 15,108 26,385 (42.7) 295 494 (40.3)
Kildonan Place(1) Winnipeg, MB 44,693 78,457 (43.0) 326 538 (39.4)
(1)
McAllister Place Saint John, NB 41,057 52,927 (22.4) 353 432 (18.3)
Medicine Hat Mall Medicine Hat, AB 32,380 47,981 (32.5) 302 419 (27.9)
(2)
Northland Village Mall Calgary, AB 8,651 16,958 (49.0) 394 513 (23.2)
Orchard Park Shopping Centre Kelowna, BC 115,307 165,572 (30.4) 474 685 (30.8)
Park Place Shopping Centre Lethbridge, AB 57,279 81,929 (30.1) 443 631 (29.8)
Peter Pond Mall Fort McMurray, AB 51,321 68,268 (24.8) 503 641 (21.5)
(1)
Place d'Orleans Orleans, ON 38,311 85,141 (55.0) 234 440 (46.8)
(1)
Place du Royaume Chicoutimi, QC 46,317 82,537 (43.9) 268 460 (41.7)
(1)
Regent Mall Fredericton, NB 57,270 80,093 (28.5) 434 598 (27.4)
Sherwood Park Mall Sherwood Park, AB 25,033 41,732 (40.0) 312 505 (38.2)
St. Albert Centre St. Albert, AB 19,163 33,811 (43.3) 302 479 (37.0)
Stone Road Mall Guelph, ON 53,805 101,785 (47.1) 321 537 (40.2)
Sunridge Mall Calgary, AB 51,669 87,415 (40.9) 314 519 (39.5)
(3)
Total $744,486 $1,244,225 (40.2%) $348 $548 (36.5%)
(1) All store sales and same store sales have been reported as if H&R owned 100% of these enclosed shopping centres.
(2) Northland Village is slated for redevelopment.
(3) The total same-store sales figures have been presented on a weighted average basis.
12 STABILITY, SECURITY & GROWTH through QUALITY, DIVERSIFICATION & SCALE(1)
Top 15 Retail Tenants by Revenue
% of rental income H&R owned Average lease
from investment Number of sq.ft. term to maturity Credit Ratings
(2) (3)
Tenant properties locations (in 000’s) (years) (S&P)
1. Giant Eagle, Inc. 3.4% 196 1,627 10.4 Not Rated
(4)
2. Lowe's Companies, Inc. 1.7 13 1,346 13.0 BBB+ Stable
(5)
3. Canadian Tire Corporation 1.3 17 578 6.0 BBB Stable
(6)
4. Loblaw Companies Limited 0.9 18 262 7.7 BBB Stable
(7)
5. The TJX Companies Inc. 0.9 17 429 6.5 A Stable
(8)
6. Empire Company Limited 0.9 14 492 10.0 BBB- Stable
7. Shell Oil Products 0.8 12 152 2.5 A+ Stable
(9)
8. Walmart Inc. 0.8 9 751 7.2 AA Stable
9. Metro Inc. 0.7 12 420 5.5 BBB Stable
10. Bell Canada 0.5 17 52 1.9 BBB+ Stable
11. Hudson's Bay Company 0.5 6 589 6.3 Not Rated
(10)
12. YM Inc. 0.5 14 216 4.7 Not Rated
(11)
13. Gap Inc. 0.4 9 121 4.5 BB- Positive
14. Best Buy Co. Inc. 0.4 8 142 4.4 BBB Stable
15. Indigo Books & Music 0.3 11 112 5.7 Not Rated
14.0% 373 7,289 11.9
(1) Includes the proportionate share of equity accounted investments.
(2) The percentage of rentals from investment properties is based on estimated annualized gross revenue excluding straight-lining of contractual rent, rent amortization of tenant inducements
and capital expenditure recoveries.
(3) Average lease term to maturity is weighted based on net rent.
(4) Lowe’s Companies, Inc. includes Rona.
(5) Canadian Tire Corporation includes Canadian Tire, Mark’s, Sport Chek, Atmosphere, Sports Experts and Party City.
(6) Loblaw Companies Limited includes Loblaw, No Frills and Shoppers Drug Mart.
(7) The TJX Companies Inc. includes Winners, T.J. Maxx, Marshalls and Home Sense.
(8) Empire Company Limited includes Sobeys Capital Inc., Safeway and Lawtons Drugs.
(9) Walmart Inc. includes Sam's Club.
(10) YM Inc. includes Amnesia, Bluenotes, Sirens, Suzy Shier, Urban Planet, Urban Kids and West 49.
(11) Gap Inc. includes Old Navy.
13 STABILITY, SECURITY & GROWTH through QUALITY, DIVERSIFICATION & SCALEIndustrial Portfolio(1)
▪ Total value: $1.2 billion (weighted average cap rate: 5.27%)
▪ Average remaining lease term to maturity: 6.2 years
▪ Occupancy: 95.8%
Canada United
Total(1)
Ontario Alberta Other Subtotal States
Number of properties 36 19 28 83 3 86
Square feet (in thousands) 4,858 2,030 1,648 8,536 700 9,236
▪ H&R has a 50% ownership interest in 77 of the 86 properties
through a joint venture partnership with PSP Investment Board and
Crestpoint Real Estate Investments Ltd.
Sleep Country | GTA
(1) Includes H&R’s proportionate share of equity accounted investments. Canadian Tire | GTA
14 STABILITY, SECURITY & GROWTH through QUALITY, DIVERSIFICATION & SCALECanadian Properties Under Development
(in thousands of Canadian Dollars)
At H&R's Ownership Interest
As at March 31, 2021 (in thousands of Canadian dollars)
Total Properties Costs Expected Expected
Ownership Number of Development Under Remaining Yield Completion
Interest Acres Budget Development to Complete on Cost Date
Current Developments:
140 Speirs Giffen Ave., Caledon, ON (1) 100.0% 4.7 $14,358 $5,532 $8,826 6.0% Q2 2022
(1)(2)
34 Speirs Giffen Ave., Caledon, ON 100.0% 4.9 16,342 6,163 10,179 7.0% Q2 2022
9.6 30,700 11,695 19,005
Future Developments:
(1)
Industrial Lands (Remaining lands), Caledon, ON 100.0% 117.6 - 74,151 -
(3)
7333 Mississauga Rd. N., Mississauga, ON 100.0% 15.4 - 20,975 -
(4)
Slate Dr., Mississauga, ON 50.0% 24.6 - 19,952 -
(5)
3791 Kingsway, Burnaby, BC 50.0% 0.6 - 7,427 -
Total 167.8 $30,700 $134,200 $19,005
(1) H&R owns approximately 144 acres of land which is being held for development for up to 2.7 million square feet of industrial space. The first building, 205
Speirs Giffen Ave., was substantially completed and transferred from properties under development to investment properties in Q4 2020. There are currently
two buildings under construction totalling approximately 183,008 square feet.
(2) Subsequent to March 31, 2021, H&R completed a 10-year lease with an industrial tenant to occupy the entire property totaling 105,014 square feet.
(3) Expected to be developed into two industrial buildings totalling approximately 329,000 square feet.
(4) Expected to be developed into industrial property.
(5) Excess lands held for future-redevelopment. These lands are adjacent to the REIT’s 3777 Kingsway office tower of which it also has a 50% ownership interest.
15 STABILITY, SECURITY & GROWTH through QUALITY, DIVERSIFICATION & SCALEResidential Portfolio(1)
▪ Total value: U.S. $2.3 Billion (weighted average cap rate: 4.57%)
▪ Average age of properties: 6.3 years
▪ Occupancy: 88.4%
North
Texas Florida Carolina New York California Total
Number of properties 9 8 5 1 1 24
Number of residential rental units 2,776 2,743 1,632 936 54 8,141
Ambrosio | Texas Jackson Park | New York Westshore | Florida
(1) Includes H&R’s proportionate share of equity accounted investments.
16 STABILITY, SECURITY & GROWTH through QUALITY, DIVERSIFICATION & SCALE▪ Strategy is to acquire or develop class A properties in U.S. Sun Belt cities where there is strong population and employment growth and to develop properties with partners in Gateway cities 17 STABILITY, SECURITY & GROWTH through QUALITY, DIVERSIFICATION & SCALE
U.S. Properties Under Development
     (in thousands of U.S. Dollars)

                                                                                                       At H&R Ownership Interest
     As at March 31, 2021                                                                             (in thousands of U.S. dollars)
                                                                                          Total           Properties                 Costs   Construction    Expected      Expected
                                                          Ownership    Number     Development                 Under        Remaining to         Financing        Yield   Completion
     Development Name                                       Interest   of Acres         Budget        Development              Complete         Available      on Cost         Date
     Current Developments:
      River Landing - Residential Tower 2, Miami, FL(1)       100.0%        1.1         $83,242             $80,560               $2,682         $       -       4.4%       Q2 2021
                                    (2
      Shoreline, Long Beach, CA                                31.2%        0.9          71,097              55,576               15,521          15,772         6.2%       Q1 2022
                                                 (3)
      Hercules Project (Phase 2), Hercules, CA                 31.7%        2.8          31,186              25,489                5,697             9,574       6.0%       Q4 2021
                              (4)
      The Pearl, Austin, TX                                    33.3%        5.0          24,201              22,625                1,576             1,829       6.2%       Q4 2021
      Esterra Park, Seattle, WA (5)                            33.3%        1.1          31,859              30,646                1,213             3,405       6.0%       Q4 2021
                                                                           10.9         241,585             214,896               26,689          30,580
     Future Developments:
      Jersey City Lands, Jersey City, NJ                      100.0%       12.4               -             163,335                     -                -
                                              (6)
      Other Remaining Future Developments                                  99.0               -             103,476                     -                -
     Total (excluding ECHO)                                               122.3        $241,585           $481,707               $26,689         $30,580

(1) In Q1 2021, the first of two residential towers reached substantial completion and was transferred from properties under development to investment properties.
(2) 35-storey residential tower consisting of 315 luxury residential rental units and 6,450 square feet of retail space.
(3) Total project spans 38.4 acres. Construction commenced in June 2018 on Phase 1 of this project which was substantially completed and transferred to investment properties
    in Q4 2020. Construction commenced in March 2019 on Phase 2 of this project which will consist of 232 residential rental units. Future phases will be announced as further
    development information becomes available.
(4) Residential development consisting of 383 residential rental units which is close to major technology employers including Apple, IBM, Oracle and Samsung as well as the
    University of Texas at Austin and downtown Austin.
(5) Seven-storey residential tower consisting of 263 residential rental units, which is part of a larger master planned community and is adjacent to transit, Microsoft
    Corporation’s headquarters, and future light rail which is expected to be completed in 2023.
(6) Consists of seven separate parcels of land in the United States totalling 99.0 acres. H&R has a 31.7% interest in one of the parcels amounting to U.S. $12.2 million at H&R’s
    ownership interest. H&R is the sole owner of the remaining six parcels.

18                    STABILITY, SECURITY & GROWTH through QUALITY, DIVERSIFICATION & SCALE
River Landing - Miami, FL
▪ Prime urban mixed-use development
▪ 528 residential rental units
▪ 339,000 sf of urban retail
▪ 125,000 sf of office
19 STABILITY, SECURITY & GROWTH through QUALITY, DIVERSIFICATION & SCALERiver Landing – Miami, FL
▪ 1,000 feet of waterfront on the Miami river
▪ Adjacent to the Health District and close proximity to downtown Miami
▪ In Q4 2020, the retail and office portion of this project, known as “River Landing Commercial”, reached substantial
completion and was transferred from properties under development to investment properties.
▪ In Q1 2021, the first of two residential towers reached substantial completion and was transferred from properties
under development to investment properties. The second residential tower is expected to be transferred from
properties under development to investment properties in Q2 2021.
▪ Strong Leasing Progress:
▪ Retail occupancy was 74.6% as at March 31, 2021 which includes the following major tenants: Publix Super Markets Inc., Hobby
Lobby, Burlington, Ross Stores Inc., T.J. Maxx, Old Navy and Planet Fitness
▪ Committed occupancy for retail space as at March 31, 2021was 81.7%
with the remaining retail lease-up expected to occur during 2021
▪ As at March 31, 2021, 228 residential leases in the first
tower have been entered into and occupancy was
62.9%, exceeding management’s expectations on
leasing velocity
▪ The total cost of the project is expected to
be completed on budget at approximately
U.S. $495.9 million of which U.S. $294.3 million
was allocated to River Landing Commercial
and the remaining U.S $201.6 million has been
allocated to the residential towers.
20 STABILITY, SECURITY & GROWTH through QUALITY, DIVERSIFICATION & SCALEShoreline Gateway - Long Beach, CA ▪ Land acquired July 16, 2018 ▪ H&R ownership: 31.2% ▪ 35-storey residential tower consisting of 315 residential rental units ▪ 6,450 sf of retail space ▪ Development budget: U.S. $71.1M at H&R’s ownership interest ▪ Construction financing: U.S. $41.1M secured at H&R’s ownership interest ▪ Will become the tallest residential tower in Long Beach with views overlooking the Pacific Ocean ▪ Expected to be completed in Q1 2022 21 STABILITY, SECURITY & GROWTH through QUALITY, DIVERSIFICATION & SCALE
Hercules Bayfront – San Francisco, CA

     ▪ H&R ownership: 31.7%
     ▪ 38.4 acres of land to be developed into a waterfront master planned community which will be
       surrounded by a future intermodal transit centre
     ▪ In Q4 2020, Phase 1 known as “The Exchange at Bayfront” consisting of 172 residential rental
       units, including lofts and townhomes and 13,762 square feet of ground level retail space
       reached substantial completion and was transferred from properties under development to
       investment properties
     ▪ Phase 2 known as “The Grand at Bayfront” will consist of
       232 residential rental units including a state-of-the-art fitness
       centre, bike shop, residents lounge and sporting club
        ▪ Total development budget of U.S. $31.2 million and construction financing
          of U.S. $20.7 million has been secured, both at H&R’s ownership
          interest
        ▪ Expected to be completed in Q4 2021

22            STABILITY, SECURITY & GROWTH through QUALITY, DIVERSIFICATION & SCALE
The Pearl - Austin, TX
▪ H&R ownership: 33.3% ▪ This residential development site is close to
major technology employers including
▪ 383 residential rental units Apple, IBM, Oracle and Samsung, as well as
▪ Development budget: U.S. $24.2M and the University of Texas at Austin and
construction financing of U.S. $16.0M has been downtown Austin
secured, both at H&R’s ownership interest
▪ Expected to be completed in Q4 2021
23 STABILITY, SECURITY & GROWTH through QUALITY, DIVERSIFICATION & SCALEEsterra Park - Seattle, WA
▪ H&R ownership: 33.3% ▪ This residential development site is part of a larger
master planned community and is adjacent to
▪ 263 residential rental units Microsoft Corporation’s headquarters, bus transit and
▪ Development budget: U.S. $31.9M and future light rail which is expected to be completed in
construction financing of U.S. $22.2M has been 2023
secured, both at H&R’s ownership interest
▪ Expected to be completed in Q4 2021
24 STABILITY, SECURITY & GROWTH through QUALITY, DIVERSIFICATION & SCALEFuture Intensification Opportunities
Office Opportunities: Retail Opportunities:
▪ 3777 & 3791 Kingsway Street, Burnaby, BC ▪ Dufferin Mall, Toronto, ON
▪ 145 Wellington Street W., Toronto, ON ▪ Grant Park, Winnipeg, MB
▪ 53 & 55 Yonge Street, Toronto, ON ▪ Kildonan Place, Winnipeg, MB
▪ 310-320-330 Front Street W., Toronto, ON ▪ Northland Village, Calgary, AB
▪ Orchard Park Shopping Centre, Kelowna, BC
▪ Place d’Orleans, Orleans, ON
▪ Sunridge Mall, Calgary, AB
25 STABILITY, SECURITY & GROWTH through QUALITY, DIVERSIFICATION & SCALE3777 & 3791 Kingsway – Burnaby, BC ▪ In June 2020, H&R along with its partner, submitted a re-zoning application for the east and north portions of its 3777 & 3791 Kingsway sites ▪ The proposal could add over 2,000 residential rental units in four mixed-use high density towers including retail and residential uses with approximately 1,800,000 square feet of residential area and 44,000 square feet of commercial area ▪ The REIT expects to obtain approval for its re-zoning and site plan applications in Q2 2022 26 STABILITY, SECURITY & GROWTH through QUALITY, DIVERSIFICATION & SCALE
145 Wellington St. W. – Toronto, ON

▪ 145 Wellington St. W. is located at the junction of Toronto’s Financial and
  Entertainment Districts
▪ In August 2019, H&R submitted a rezoning and site plan approval
  application for the redevelopment of 145 Wellington St. W., which is
  currently a 13-storey office building
▪ The proposed project would redevelop the subject site with a full office
  replacement in a new modern 13-storey podium, topped with a 52-storey
  residential tower, for an overall building height of 65 storeys
▪ A total of 157,500 square feet of office space
  and 1,750 square feet of grade-related retail
  and 476 new residential rental units is proposed
▪ Re-zoning and site plan approval is
  expected in Q4 2021

27       STABILITY, SECURITY & GROWTH through QUALITY, DIVERSIFICATION & SCALE
55 Yonge St. – Toronto, ON

     ▪ 53 & 55 Yonge St., is located in the heart of Toronto’s Financial District
     ▪ In November 2020, the REIT acquired 53 Yonge St., a five-storey
       11,110 square foot office property, for $11.5 million
     ▪ The two properties encompass approximately 0.37 acres and the REIT
       submitted a re-zoning application in March 2021 to replace the
       existing 13-storey and five-storey office buildings with a 66-storey
       residential and office tower with retail uses on the first two floors
     ▪ This further breaks down into approximately
       12,000 square feet of retail space, 146,000 square
       feet of office space and 400,000 square feet of
       residential space (approximately 500 residential
       rental units)
     ▪ The REIT expects to obtain approval for its
       re-zoning and site plan applications in Q4 2022

28           STABILITY, SECURITY & GROWTH through QUALITY, DIVERSIFICATION & SCALE
310 Front St. – Toronto, ON ▪ 310 Front St. is located at the junction between Toronto’s Financial and Entertainment Districts ▪ In April 2021, H&R submitted a combined a re-zoning application and official plan amendment application for a 69-storey mixed use development including retail, residential and office uses ▪ The development will replace the existing eight- storey office building at 310 Front St., and will integrate into H&R’s larger office block which incudes 320 and 330 Front St. ▪ The project will include approximately 118,000 square feet of office, 2,000 square feet of retail and 431,000 square feet of residential space ▪ H&R expects to obtain approval for its re-zoning and site plan applications in Q4 2022 29 STABILITY, SECURITY & GROWTH through QUALITY, DIVERSIFICATION & SCALE
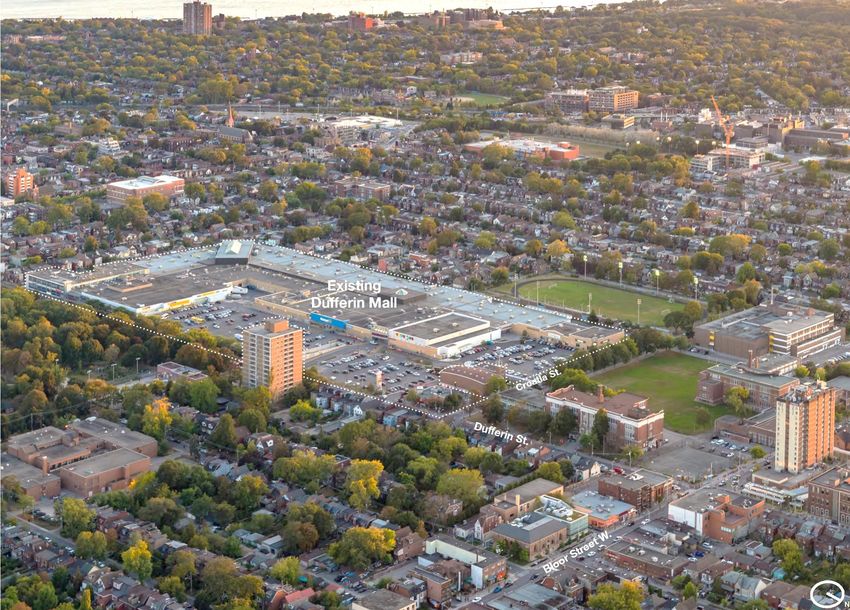
Dufferin Grove Village – Toronto, ON

     ▪ In July 2019, H&R submitted combined applications for rezoning and for the
       redevelopment of the surface parking lots, drive-through restaurants and strip plaza that
       currently occupy the north end of Dufferin Mall to create “Dufferin Grove Village”
     ▪ The proposed project would replace the surface parking with four residential buildings
       over two blocks
     ▪ This new community is in direct proximity to Dufferin Station on the TTC’s Bloor Line,
       and it introduces a mix of residential and commercial uses including, a new public park
     ▪ The west block would support two residential buildings
       of 35 and 39 storeys, and the east block would support
       two residential buildings of 14 and 23 storeys
     ▪ Combined, they would introduce approximately
       1,135 residential rental units to the site as well
       as 75,000 square feet of retail space.
     ▪ Re-zoning and site plan approval is expected
       in Q4 2021

30           STABILITY, SECURITY & GROWTH through QUALITY, DIVERSIFICATION & SCALE
Top 15 Tenants by Revenue(1)
Predictable and stable income from long-term leases with high quality investment grade tenants
% of Rentals from Average Lease
Investment Number of H&R owned Term to Maturity Credit Ratings
(2)
Tenant Properties Locations sq.ft. (in 000’s) (in years)(3) (S&P)
1. (4) 12.2% 1 1,997 17.1 BBB- Negative
Ovintiv Inc. (formerly Encana Corporation)
2. Bell Canada 8.7 23 2,536 13.4 BBB+ Stable
3. Hess Corporation 5.7 1 845 11.9 BBB- Stable
4. New York City Department of Health 4.1 1 660 9.6 A+ Negative
5. Giant Eagle, Inc. 3.4 196 1,627 10.4 Not Rated
6. Canadian Tire Corporation(5) 3.0 19 2,682 5.9 BBB Stable
7. Corus Entertainment Inc. 1.9 1 472 12.0 BB Stable
8. TC Energy Corporation 1.9 1 466 10.1 BBB+ Stable
9. Lowe's Companies, Inc.(6) 1.7 13 1,346 13.0 BBB+ Stable
10. Telus Communications 1.2 17 356 4.9 BBB+ Negative
11. Toronto-Dominion Bank 1.1 7 286 6.3 AA- Stable
12. The TJX Companies Inc.(7) 1.1 18 681 5.7 A Stable
13. Public Works and Government Services, Canada 1.1 5 321 4.2 AAA Stable
14. Loblaw Companies Limited(8) 1.0 19 273 8.1 BBB Stable
15. Royal Bank of Canada 1.0 5 247 4.2 AA- Stable
49.1% 327 14,795 11.6
(1) Includes the proportionate share of equity accounted investments.
(2) The percentage of rentals from investment properties is based on estimated annualized gross revenue excluding straight-lining of contractual rent, rent amortization of tenant inducements
and capital expenditure recoveries.
(3) Average lease term to maturity is weighted based on net rent.
(4) Ovintiv Inc. has sublet 27 floors to Cenovus Energy at The Bow located in Calgary, AB. Ovintiv Inc.’s lease obligations expire on May 13, 2038.
(5) Canadian Tire Corporation includes Canadian Tire, Mark’s, Sport Chek, Atmosphere, Sports Experts and Party City.
(6) Lowe’s Companies, Inc. includes Rona.
(7) The TJX Companies Inc. includes Winners, T.J. Maxx, Marshalls and Home Sense.
(8) Loblaw Companies Limited includes Loblaw, No Frills and Shoppers Drug Mart.
31 STABILITY, SECURITY & GROWTH through QUALITY, DIVERSIFICATION & SCALELimited Lease Rollover (1)
▪ Low-risk rollover schedule
▪ Well diversified by property and geography
▪ Average remaining lease term of 9.5 years, one of the longest in the industry
Canadian Portfolio
(in 000’s sq.ft.)
2,365 Industrial
2,115
1,659 Retail
1,069 Office
770
2021 2022 2023 2024 2025
% of the REIT‘s GLA 2% 7% 3% 6% 5%
U.S. Portfolio
(in 000’s sq.ft.)
Industrial
Retail
690
137 223 290 293 Office
2021 2022 2023 2024 2025
% of the REIT’s GLAStrong Balance Sheet
BBB (High) Unencumbered Available under Interest WAIR(1) WATM(1)
Stable Trend by Assets Lines of Credit Coverage
DBRS $3.9B $1,412M 3.6% 3.6 years
2.8x
Debt(1) to Total Assets
Mortgages 29% Unsecured 50%
Debentures 15% 47.7% (2)
46.7%
44.6% 44.6% 44.4%
45%
Total Unsecured Term
Capitalization Loans 4% 40%
$12.5 Billion Lines of Credit
1% 35%
Unitholders' Equity
30%
and Exchangeable 2017 2018 2019 2020 Q1 2021
Units 51%
(1) Debt includes mortgages payable, debentures payable, unsecured term loans and lines of credit.
(2) The increase in debt to total assets from 2019 to 2020 is primarily due to fair value adjustments to certain office and retail properties totaling $1.2 billion.
33 STABILITY, SECURITY & GROWTH through QUALITY, DIVERSIFICATION & SCALEMortgages Payable by Operating Segment
Weighted Average Weighted Average Balance
Operating Segment: Interest Rate Years to Maturity Outstanding(1)
Office 4.0% 2.5 $1,624,670
Retail 3.9% 2.3 637,070
Industrial 4.3% 4.9 303,185
Residential 3.8% 6.4 1,054,619
4.0% 4.0 $3,619,544
(1) Excludes financing costs and mark-to-market adjustment arising on acquisitions.
34 STABILITY, SECURITY & GROWTH through QUALITY, DIVERSIFICATION & SCALESummary
▪ One of the largest REITs in Canada with total assets of $13.2 Billion
▪ High quality real estate
▪ Predictable income
▪ Creditworthy tenants
▪ Long-term leases, with contractual rent escalations
▪ High, stable occupancy
▪ Minimal near term lease expiries and debt maturities
▪ Development pipeline expected to create significant value
and enhance cash flows
▪ Solid balance sheet with a conservative payout ratio
▪ Fully internalized and aligned management
▪ CEO, founders and trustees own approximately
6% of the REIT (including exchangeable units)
▪ NAV per unit is $22.24(1)
(1) Refer to the March 31, 2021 MD&A for a detailed calculation.
35 STABILITY, SECURITY & GROWTH through QUALITY, DIVERSIFICATION & SCALEYou can also read