Summary of Water Quality Survey Results - Prepared for Upper Clutha Lakes Trust July 2019 - WAI Wanaka
←
→
Page content transcription
If your browser does not render page correctly, please read the page content below
Summary of Water Quality Survey Results
        Prepared for Upper Clutha Lakes Trust

                                     July 2019
Prepared For
Upper Clutha Lakes Trust

Prepared By
Landpro Ltd
13 Pinot Noir Drive
PO Box 302
Cromwell

Tel +64 3 445 9905

© Landpro Ltd 2019
QUALITY INFORMATION

Reference:          L:\18379 - Upper Clutha Lakes Trust - Upper Clutha Integrated Catchment
Management Plan\Docs\190726 18379 Wanaka water survey results summary REVISED.docx

Date:                        26 July 2019

Prepared by:                 Tim Muller

Reviewed by:                 Nick Boyens and Claire Perkins

Client Review:               Julie Perry

Version Number:              FINAL (Rev 1)

Disclaimer:
We have prepared this report for our client based on their instructions. They may use it, as agreed between us. Landpro has
no duty, and does not make or give any express or implied representation or guarantee, whatsoever to any person other
than our client. If you are not our client then, unless this report has been provided to you as a local authority or central
government agency as part of a public process:
     •    you have no right to use or to rely on this report or any part of it, and
    •     you may not reproduce any of it.
We have done our best to ensure the information is fit for purpose at the date of preparation and meets the specific needs of
our client. Sometimes things change or new information comes to light. This can affect our recommendations and findings.
1 Introduction
This report summarises the Upper Clutha community’s values and concerns regarding
freshwater, as expressed in their responses to an online survey in March-April 2019. The
survey was carried out to inform the forthcoming Integrated Catchment Management Plan
for the area.
The survey consisted of two main sections:
• Demographic questions to enable us to identify whether the survey population is
generally representative of the Upper Clutha community.
• Questions regarding water quality and other freshwater issues, which were the
primary focus of the survey.
In total, there were 271 responses to the survey, with a 48.7 % completion rate (as calculated
by Typeform, the website which hosted the survey). Participation in the survey was voluntary
and this must be taken into account when interpreting the results. For example, it is likely that
those who chose to complete a survey on water quality issues are more concerned about
water quality than the general population.
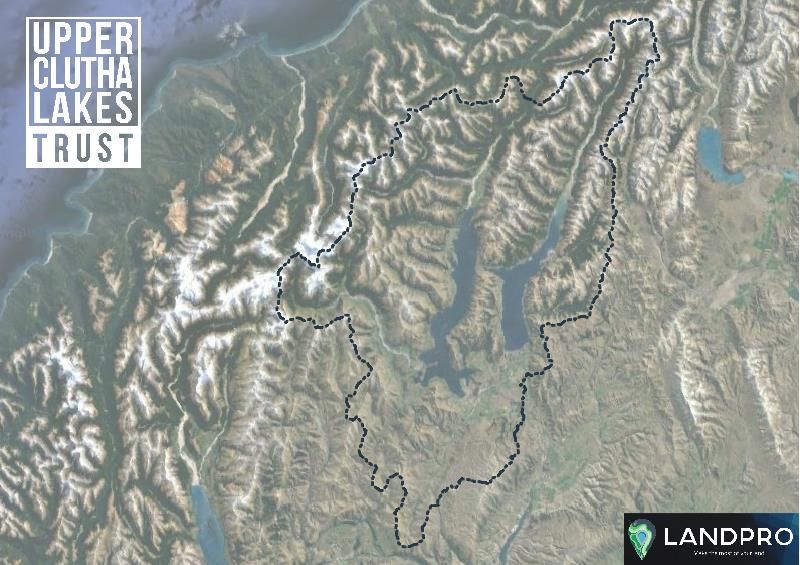
All questions in the survey related to the study area pictured below. This was defined for
respondents as “the Clutha/Mata-Au catchment down to Luggate Creek, including lakes and
tributaries”.
The study area roughly corresponds to the Hāwea, Wānaka and Matukituki area units from
the 2013 New Zealand Census, the populations of which are shown in Table 1. Projected
populations from a study commissioned by Queenstown Lakes District Council (Rationale,
2017) are also shown.
© Landpro Ltd., 2019
1Figure 1 - Study area map, as included in survey.
Table 1: Study area population
Area unit 2013 Population (as 2018 population
at Census) (projected)
Hāwea 2,172 2,850
Wānaka 6,474 9,140
Matukituki 387 510
Total 9,033 12,500
© Landpro Ltd., 2019
22 Demographic questions
Of the 271 total responses, 268 were from individuals, with group submissions on behalf of
Forest and Bird, Hāwea Community Association, and Mount Aspiring College. These group
responses are summarised in Section 4. The graphs and discussion in the remainder of this
report relate to the 268 individual responses only.
233 of the individual submissions were from residents of the Upper Clutha area, which is
almost 2 % of the total resident population of the area. The remaining responses were from
tourists/one-off visitors to the area (6) and frequent visitors to the area, defined as visiting
more than once per year (27).
Figure 2: Individual survey respondents’ identification as residents, frequent visitors,
or tourists in the Upper Clutha. Data excludes two non-responses.
© Landpro Ltd., 2019
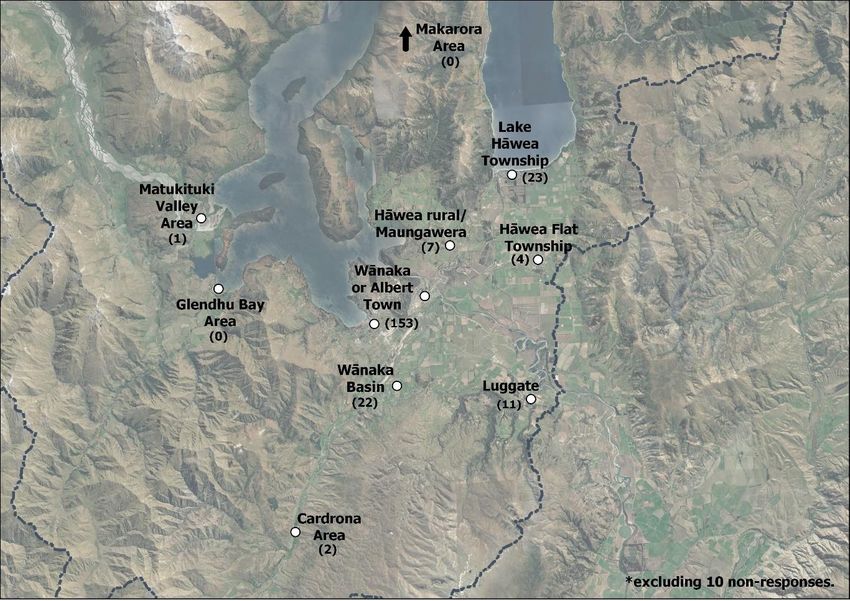
3The 233 respondents who live in the Upper Clutha were asked to state in which of these
towns/areas they lived. The map below shows the choices given to respondents, and the
number of responses for each option is shown in brackets.
Figure 3: Place of residence for individual survey respondents identifying as an Upper
Clutha resident.
The areas specified in the survey were mapped onto the three Stats NZ Area Units in the
Upper Clutha (with Wānaka including only the Wānaka and Albert Town urban areas,
Matukituki including the Wānaka Basin, Cardrona and Glendhu Bay areas, and the remaining
areas falling within Hāwea). The proportion of responses for each area generally followed
the populations (as at 2013 census), although the Matukituki area was slightly over-
represented, with slightly fewer responses from Hāwea than would be expected. This may
be in part because the Wānaka Basin area is difficult to define precisely and arguably
overlaps with all 3 Area Units.
© Landpro Ltd., 2019
4Figure 4: Comparison of resident survey respondents by statistical area unit with
population of each area unit as at the 2013 Census. Survey data excludes 10-non-
responses.
Figure 5: Gender breakdown of individual survey respondents vs all Upper Clutha
residents from the 2013 Census. Survey data excludes 5 non-responses.
© Landpro Ltd., 2019
5Men were slightly under-represented in the survey respondents relative to the general
population (46 % male, 54 % female, excluding 5 non-responses). This was the case (within
~1 %) for both the full dataset of individual responses and the residents-only subset.
The survey respondents were noticeably older than the general population. The lack of
responses from 0-19 year olds is not unexpected, but the number of responses from 20-39
years olds is also less than would be expected based on the age distribution of the general
population.
Figure 6: Age distribution of survey respondents vs Upper Clutha population as at
2013 Census. Survey data excludes 6 non-responses.
© Landpro Ltd., 2019
6European/Pākehā1 respondents were over-represented relative to other ethnic groups
amongst the survey respondents. Only one respondent identified as Asian, and none as
Pasifika. Māori were also under-represented (2.7 % of the survey respondents versus approx.
5 % of the Upper Clutha population), although we note that specific consultation in relation
to the values and concerns of local iwi has been carried out in addition to the survey.
Analysing the survey ethnicity data for residents only did not make an appreciable
difference.
Figure 7: Ethnicity distribution of survey population (full individual dataset and
residents only) vs Upper Clutha population as at 2013 Census. Survey data excludes
10 non-responses. Multiple responses also possible. "MELAA" = "Middle Eastern, Latin
American and African”. “European/Pākehā” includes “Other”.
1
Note that this category includes “Other”. All survey respondents who selected the “Other” option stated
their ethnicity either as “New Zealander” or similar, or a nationality from another predominantly Caucasian
country (English, Australian, etc). Similarly, a note in the Census data table used suggests that the “Other”
category is dominated by “New Zealander”, which was historically recoded as European. Note also that the
figure shows percentages adding up to 100 %, whereas in fact 7 of the 258 individual respondents to this
question indicated more than one ethnicity – these people are effectively counted twice in the visualisation.
© Landpro Ltd., 2019
7Respondents were also asked to state which (if any) of a group of relevant industries/sectors
they worked in. This was primarily to identify any attempts by a particular group to
undermine the survey by responding en masse (in the highly unlikely event that this
occurred). While the categories used cannot be meaningfully compared with Census or
similar data, based on local knowledge none of the industries/sectors mentioned appear to
be over-represented.
Figure 8: Individual survey respondents by industry/sector of work. Excludes five non-
responses. Multiple answers also possible.
Overall, from a demographic perspective, the survey respondents appear to be generally
representative of the Upper Clutha population, but more consultation may be needed to
better understand the views and concerns of ethnic minorities and especially young people.
No attempt was made to adjust the data to account for the under-represented populations,
primarily because there was insufficient data from these groups (young people and ethnic
minorities) to do so meaningfully.
There were also relatively few responses from visitors to the area. Given the importance of
tourism to the economic and social life of the Upper Clutha, there may be a benefit to further
investigating visitors’ views on water quality in the area.
© Landpro Ltd., 2019
83 Freshwater quality and management questions
When asked which Upper Clutha waterway(s) were most significant to them personally, the
largest waterways (The Clutha/Mata-Au and the two main Lakes) were unsurprisingly the
most commonly-selected options. However, a very large number of respondents (approx.
40 %) selected “all of the above”, recognising the interconnected nature of the waterways
in the catchment.
The one respondent who selected “Other” specified that Timaru Creek was of particular
significance to them. Respondents who selected “groundwater aquifers” were given the
option of specifying the aquifer they were referring to. Understandably, most respondents
did not know the official names of the aquifers in the area, but based on the descriptions
given, the Wānaka Basin Cardrona Gravel Aquifer, Hāwea Flat Aquifer, Cardrona Alluvial
Ribbon Aquifer and Luggate Groundwater Management Zone are all particularly significant
to at least one of the respondents. Use of groundwater for domestic water supply and
springs feeding Bullock Creek were also both frequently mentioned in responses to this
question.
Figure 9: Personal significance of Upper Clutha waterways to individual survey
respondents. Excludes two non-responses. Multiple answers also possible.
© Landpro Ltd., 2019
9Most respondents reported using water for drinking, recreation, and irrigation of domestic
gardens. A smaller number selected the other (mostly business-related) options given.
Responses given by those who selected “Other” (either business use or non-business)
related largely to recreational/amenity values.
Figure 10: Uses of water for individual survey respondents. Excludes four non-
responses. Multiple answers possible.
© Landpro Ltd., 2019
10Survey respondents reported enjoying a wide range of recreational activities in/near
waterways. In terms of water contact, there were a wide range from activities involving full
immersion (e.g. swimming) to activities such as sightseeing with probably minimal or no
contact with water. Walking/jogging and swimming were the most common responses.
“Other” responses were primarily sporting activities (including skiing/snowboarding,
canyoning and windsurfing), as well as exercising dogs, harvesting wild herbs, and “parasite
research”.
Figure 11: Water-related recreational activities enjoyed by individual survey
respondents.
About half of individual respondents believe that water quality in the Upper Clutha is “very
good” or “good”, while only 16 % believe water quality to be “very poor” or “poor”. However,
about 75% of respondents believe that water quality is getting worse, with fewer than 1%
believing water quality is getting better.
© Landpro Ltd., 2019
11Figure 12: Individual survey respondents perception of overall water quality in the
Upper Clutha. Excludes "not sure" - 8 responses.
Figure 13: Individual survey respondents' perception of change in Upper Clutha Water
quality over time. Excludes "not sure" - 19 responses.
© Landpro Ltd., 2019
12Figure 14: Individual survey respondents' level of concern about various potential
water quality problems. Excludes 1-6 non-responses per problem.
Respondents were asked to identify their level of concern in relation to various potential
threats to water quality in the Upper Clutha. There was significant concern about most of
these issues, with 50 % or more of respondents “very concerned” about all but two of the
threats identified. Respondents were also given the opportunity to identify any other threats
to water quality which concerned them with most (166) doing so. However, the responses
to this question largely reiterated the threats already identified in Figure 14. The most
common concerns raised related to agricultural runoff and related issues, use of pesticides,
fertilisers and other chemicals, and issues related to population growth. A more detailed
summary of these responses is attached (Appendix A).
© Landpro Ltd., 2019
13Figure 15: The importance of various water quality values to individual survey
respondents. Excludes non-responses (0-4 per value).
When asked to rate the important of various water quality values, respondents indicated
that all of the values needed to be considered, with all of the values considered at least
“moderately important” by 90 % of respondents or more. Respondents were also given the
opportunity to specify any additional values that were important to them, but not listed
above. There were 102 responses to this, with the most common value statements relating
to waterways being free of pollution, guardianship of water as a resource for future
generations, and maintaining public access to waterways. The attached table includes a
more detailed summary of these responses (Appendix A).
When asked how often they had taken some form of action to improve or protect water
quality in the Upper Clutha region, almost three-quarters of respondents said they had done
so at least once or twice. This includes about 20 % of respondents who said they had taken
such actions “many times”. There was surprisingly little difference between visitors and
residents in responses to this question, although it must be noted that most of the visitors
group described themselves as frequent visitors to the area, the total numbers of non-
resident respondents was small, and the scale of the actions reported also varied
significantly, as discussed below.
© Landpro Ltd., 2019
14Figure 16: Frequency with which resident and non-resident respondents reported
having taken actions to improve or protect water quality. Excludes two respondents
who didn't indicate whether or not they were Upper Clutha residents.
Respondents (except those who had selected “never” for the previous question) were asked
to state what actions they had taken to improve/protect water quality. There were 210
responses to this question, with the most common themes being education/lobbying
actions, rubbish collection, and planting.
Similarly, respondents were asked what actions they thought would lead to the biggest
improvement in water quality. There were five main themes which had a similar level of
support: controls on agriculture, government actions, increased awareness/education, and
better management of stormwater and wastewater. There were also a large range of
responses classified as “other”.
Another related question asked which actions to improve water quality respondents would
actively support. The most common responses to this question related to planting activities
and rubbish collection. Again, there were also a wide range of responses that did not fit into
any of these groups.
The final question gave respondents an opportunity to make any further general comments
about water in the Upper Clutha. The most common themes were respondents emphasising
that immediate action was needed, and reinforcing that they believed water quality was
declining. There was also a common sentiment that waterways were being taken for granted.
Other respondents raised concerns about didymo and urban development issues, and again,
there were a large number of responses which did not relate to any of these themes.
© Landpro Ltd., 2019
154 Group responses
As noted above, there were three responses to the survey from groups. In general, these
responses were consistent with the individual responses summarised above. Specific
comments made in these submissions are summarised in Table 2.
Table 2: Summary of key points made in group submissions.
Hāwea Community Forest and Bird Mount Aspiring
Association Protection Society College
(Central Otago Lakes
Branch)
Values Generally in line with Generally consistent with Generally in line with
individual responses. individual respondents. individual responses.
Also highlighted the Also emphasised the
values and importance of a
responsibilities sustainable, high quality
associated with National water supply.
Parks (presumably Mt
Aspiring NP).
Concerns Raised concerns Freedom campers using Concerned about lack of
about “too much waterways for washing. environmental concern
tourism, especially at Free access to water for from tourists in self-
the low end of commercial/irrigation contained vehicles. Also
market”, and “too use. about water purity and
much growth without particularly didymo.
enough infrastructure
in place first”.
Actions Suggested that all Already involved in Supports planting and
new house builds monitoring of fencing along rivers and
should be required to conservation educational signage.
include water holding management issues.
tanks, and that house Control of stormwater,
water should be agriculture runoff and
charged. Also livestock access to
recommended waterways seen as key
controls on tourism issues. Emphasised that
and residential native freshwater species
growth, to enable should be prioritised
infrastructure issues over sport fish. Also
to be resolved. offered technical support
in preparing the ICMP.
© Landpro Ltd., 2019
165 Summary
Those who answered the survey value waterways in the Upper Clutha for a wide variety of
reasons, but safe water for human use (drinking and recreation), ecological values
(biodiversity and control of invasive species) and water clarity were the most important
values. The Clutha/Mata-Au and Lakes Wānaka and Hāwea are considered the most
significant water bodies by respondents, but many indicated that the whole catchment
system was of equal significance to them.
The most common human uses of water in the Upper Clutha were identified as drinking
water, recreational activities (primarily swimming and walking/jogging), and irrigation of
domestic gardens.
There was a general consensus among most respondents that water quality in the area is
good, but declining. This is reflected in the answers received when respondents were asked
to identify their level of concern in relation to 14 varied threats to water quality - a significant
majority of those who took the survey were at least “moderately concerned” about all of
these issues. Threats related to agricultural runoff, urban development (wastewater and
stormwater) and invasive species were the main areas of concern for identified.
About two-thirds to three-quarters of respondents have taken some form of action to
improve or protect water quality (at least once or twice), primarily education or lobbying,
planting, or rubbish collection. When asked which actions would make the biggest
difference to water quality in the Upper Clutha, the most common responses related to
government (local or central) actions, such as better management of of farming and
stormwater and wastewater discharges, as well as education/awareness-raising.
The ICMP which is currently in preparation will build upon these ideas to present a plan for
both immediate and long-term actions to improve water quality in the catchment.
© Landpro Ltd., 2019
17Appendix A: Summary of responses to text-entry questions
Question No of Theme Responses Comment / representative quote
responses on theme
What effects of 233 Waste and sewage 168 General concern about Freedom Camping and/or people
tourism on water toileting/washing at the lake/waterways.
quality are you
concerned about? “Washing in the streams, urinating and defecating near
waterways.”
Traffic and crowding 79 An increase in tourism puts increased pressure on
infrastructure
“It is the consequence of having more people in the area and
the general increase … that is a concern.”
Other 63 Concern about the number of motorboats on the lake
“More motorboats – more oil spills and noise pollution – over
fishing.”
What other threats to 166 Livestock/agriculture 56 The growth of dairy farming and associated run off/ ground
water quality concern water quality impacts
you, if any?
Chemicals/fertilisers 52 Chemical and pesticide contamination
(including 1080)
Land use/population 37 Continuing intensification of land development
growth
Didymo/algae 15 Introduction of new species, i.e. lake snow and rock snot
© Landpro Ltd., 2019
18Question No of Theme Responses Comment / representative quote
responses on theme
Stormwater/Wastewater 27 Sediment runoff and demand on wastewater and storm-water
infrastructure with urban development
Boating 15 overuse by power boats in busy summer months
Other 45 “Ignorance.”
“Apathy.”
Other than those 102 Access to Waterways 14 “Maintaining public walking access to waterways is very
mentioned already, important.”
what values are Guardianship 20 “That we are responsible tenants of these waterways for future
important to you for generations.”
the Upper Clutha? No Pollution 31 “Fresh water is the life blood of ecosystems within the
environment including us as a society, ensuring we maintain
the highest possible quality will reduce long term negative
ramifications.”
Other 48 “We need designated boat free zones.”
What actions have Rubbish collection 50 “Removal of rubbish from the lakes and rivers.”
you taken to improve 210 Cleaning boats/gear 17 “Checked and cleaned boats before used in waterways.”
/protect water Planting 35 “Planting Riparian plants along rivers/wetlands with Te
quality? Kakano.”
Education/Lobbying 83 “Member of river watch, send in petitions whenever possible.”
“Spoken to campers, written to local authorities.”
Water Conservation 17 “Conserving water at home – limit irrigation, wash cars on
lawn.”
“Very minimal irrigation (planting that can survive this
climate).”
Limit Detergent Use 17 “We make sure nothing harmful goes down our wastes (e.g.
cleaning with baking soda and vinegar and nothing else).”
© Landpro Ltd., 2019
19Question No of Theme Responses Comment / representative quote
responses on theme
Other 52 Use of home filters; managing own wastewater/stormwater
systems; not toileting around waterways while hiking or
camping
What specific 237 Stormwater/wastewater 32 “Stormwater and wastewater not going into lake.”
action(s) do you management
think would lead to Runoff 43 “Cut down on urban and agricultural runoff.”
the biggest management/reduction
improvement in Increased 36 “Education for tourists…mindfulness at an individual level when
water quality in the awareness/education using water, but also community driven actions.”
Upper Clutha? Livestock reduction 50 “ORC to regulate – reduce dairying.”
Increased management 40 This also includes tighter controls placed on urban growth
by local/central govt. “Better care by Council and those responsible for our
waterways.”
“Council monitoring, testing and enforcement.”
Other 113 Increase filtering systems; reduce use of chemicals and fertiliser
What kinds of 220 Planting 42 “Plantings and care for wetlands and rivers/lakes. Removal of
activities to improve invasive species.”
water quality in the Rubbish collection 18 “Rubbish collection, public awareness.”
Upper Clutha would Wetland development 7 “Planting, wetland restoration.”
you be willing to Reducing chemical use 8 “Getting rid of chlorination of drinking water.”
actively support? “Forbidding use of fertilisers.”
Other 133 Several non-specific responses. However, some responses
covered: lobbying council/govt, belonging to community
groups/taskforce, restricting urban and rural runoff, restricting
boat use, water monitoring, and increasing general awareness
and education
© Landpro Ltd., 2019
20Question No of Theme Responses Comment / representative quote
responses on theme
Is there anything else 132 Decline in water quality 14 “The quality has definitely declined since I moved here in 2001.
you want to tell us There was no didymo in the rivers and much fewer tourists.”
about water in the Didymo concerns 4 “Get rid of didymo and the like.”
Upper Clutha Urban development 4 “Ramp up strict regulations for ensuring site-specific suitable
catchment? development.”
Immediate action 18 “Make decisions based on the umpteen reports and start the
required process of improvement – now.”
Waterways taken for 10 “Some of the best in the world by seriously under threat with
granted a very poor attitude from ORC towards their duty of care.”
Other 54 Lot of comments here that essentially say “keep the water
clean” without providing any specific details on how this should
be achieved
© Landpro Ltd., 2019
21You can also read