Jobs Through Electronics Recycling
←
→
Page content transcription
If your browser does not render page correctly, please read the page content below
Jobs Through
Electronics Recycling
Coalition for American Electronics Recycling
Membership Survey and Jobs Study of the
Potential of the U.S. Electronics Recycling Industry
FINAL REPORT I January 2013

Prepared by:

                   PO BOX 2, WINDSOR, VT I 802.674.2849 I 802.674.6915
                   www.DSMEnvironmental.com
Jobs Through
Electronics Recycling
Coalition for American Electronics Recycling

Prepared by:

Contents
Executive Summary........................................................................................................................................ i

Introduction .................................................................................................................................................. 1

Survey Method.............................................................................................................................................. 2

   Population Surveyed ................................................................................................................................. 2

   Data Collection .......................................................................................................................................... 3

Results ........................................................................................................................................................... 4

   Survey Results ........................................................................................................................................... 4

   Allocation of Employment by Activity ....................................................................................................... 4

   Extrapolation of Survey Results to all CAER Members .............................................................................. 5

Potential Increase in Jobs ............................................................................................................................. 8

   Potential Total Job Creation ...................................................................................................................... 8

Bibliography ................................................................................................................................................ 11

Appendix A Survey Form ……..…………………………………………….…………………………………………………………..….12
Executive Summary

               DSM Environmental Services, Inc. (DSM) was              per location for both small and large
               contracted by the Coalition for American                companies. These facility location coefficients
               Electronics Recycling (CAER) to estimate the            were applied to small and large CAER member
               number of jobs associated with electronic waste         companies that did not respond to the survey
               recycling in the United States (US), and to             to estimate total employment, payroll and
               project how many jobs might be created with             throughput for the entire CAER membership.
               increased electronic waste recycling activity           Based on extrapolation of the survey results to
               carried out in the US.                                  the entire CAER membership, DSM estimates
                                                                       that CAER members recycled nearly 1.2 billion
               CAER members represent a wide range of US               pounds of electronics last year, employing
               electronic recyclers from large companies that          roughly 6,850 people in the United States at an
               perform other solid waste management and                estimated payroll of $250 million.
               recycling functions to smaller companies solely
               engaged in de-manufacturing for the recycling           According to the recent US EPA funded report,
               of electronic components. CAER membership               roughly 4.8 billion pounds of e-waste were
                                                                       generated in the United States in 2011. 2
               does not include brokers who aggregate and
               export untested electronics.                            Assuming that CAER members processed 1.2
                                                                       billion pounds of material in 2011, the EPA
               DSM surveyed 21 of 67 CAER members engaged              report suggests that another 3.6 billion pounds
               in electronics recycling 1 representing 89 of 163       of e‐waste are being landfilled, processed by
               physical locations. The survey asked for three          other domestic recycling companies or
                                                                       exported. This 3.6 billion pounds represents a
               critical pieces of information from each
               company – employment, payroll, and annual               potential 21,000 full time equivalent recycling
               throughput for the most recent year, as well as         jobs with a corresponding payroll of $772.9
                                                                       million and the potential for 21,000 additional
               a breakdown of employment and throughput
                                                                       indirect jobs through indirect and induced
               for the different activities undertaken within
               each facility. Figure ES-1 (at right) illustrates       economic impacts.
               the breakdown of employment by specific                 Figure ES -1:
               activities carried out by surveyed members.             Employment
                                                                       by Activity at
               Survey results were then aggregated for small           CAER
               and large CAER member companies to calculate            Facilities
               average employment, payroll and throughput
January 2013

               1
                At the time of this analysis (August, 2012), CAER
               membership was at 72 organizations including 5
               affiliate members not directly engaged in
                                                                       2
               electronics recycling activity. At the time of report    See: Characterizing Transboundary Flows of Used
               printing, membership had grown to 77                    Electronics: Summary Report. January 2012.
               organizations.

               JOBS THROUGH ELECTRONICS RECYCLING I Final Report
               Page i
Introduction
DSM Environmental Services, Inc. (DSM) was engaged in electronics recycling activity 4 to
contracted by the Coalition for American quantify the current value of the CAER portion
Electronics Recycling (CAER) to estimate the of the US electronics recycling industry.
number of jobs associated with electronic waste
recycling in the United States (US), and to Most importantly, the data were also used to
project how many jobs might be created with estimate the job impacts of increasing recycling
increased electronic waste recycling activity of electronic waste in the US as opposed to
carried out in the US. brokering and export.
As of August, 2012, there were 72 CAER
member companies 3 including five affiliates
operating in 34 states, plus the District of
Columbia. Of these, 67 member companies
were directly engaged in some type of
electronics recycling activity, operating out of
163 locations. CAER member companies
process all types of electronic waste -- from
consumer products to equipment used by the
telecommunications industry -- and vary widely
in their size and the types of electronics
recycling activity that they carry out.
DSM’s proposed scope of work required that a
representative sample of CAER members agree
to participate in confidential surveys conducted
by DSM to obtain data on processes undertaken
and employment, average payroll, and tonnage
throughput.
Data gathered through DSM’s surveys of CAER
members formed the basis for an analysis of
current jobs (and payroll) per ton of electronics
processed for recycling. This included
estimating throughput per employee per year
January 2013
for different recycling activities throughout
their operations. These results were
extrapolated to the entire CAER membership 4
Note that the results do not include
employment/jobs at affiliate members who are
3
CAER membership includes affiliate members not directly engaged in electronics recycling
who do not operate electronics recycling facilities. activity.
JOBS THROUGH ELECTRONICS RECYCLING I Final Report
Page 1Survey Method
Population Surveyed representative of the entire population of US
CAER members represent a wide range of US based companies that handle used electronics,
electronic recyclers from large companies that but is instead representative of those
perform other solid waste management and companies who de-manufacture or refurbish
recycling functions to smaller companies solely the electronic devices in the US.
engaged in de-manufacturing for the recycling
of electronic components. While CAER As expected, there is a wide spectrum of types
membership does includes affiliate members of electronics collected by different CAER
not directly engaged in electronics recycling members, and great variation in the value of
activity but supportive of CAER’s mission, these the different electronic components recovered,
supporting members were not included in the leading to a wide range in de-manufacturing
survey and analysis. processes to remove potentially valuable
components and materials. For example, CAER
CAER members include companies whose members who collect material primarily from
business model is designed around recycling or municipal recycling programs receive large
refurbishing of electronics from original quantities of relatively low value old televisions,
equipment manufacturers and retailers, and while CAER members who specialize in
companies that serve corporations and/or managing electronics from corporations and
institutions that handle sensitive data and need institutions receive much higher value
to certify that all electronic devices are first electronics. But even in this case, there can be a
cleared of all digital data before recovering any significant difference in the value of the
components. CAER members also include components recovered from the delivered
companies that are focused primarily on materials.
providing a recycling destination for electronics
collected through municipal, regional or In addition, TV peripherals such as VCRs, DVD
statewide collection programs or through players, DVRs, cable/satellite receivers,
retailer take-back arrangements. converter boxes, and game consoles, as well as
mobile devices including cell phones, personal
CAER membership does not include brokers digital assistants (PDAs), smart phones, and
who aggregate and export untested electronics. pagers all vary greatly in components and value.
In these cases the employment and value added
materials are also exported, as are potential Because of the range in size, type and materials
environmental damages from de-manufacturing accepted by different CAER members, DSM
January 2013
practices in countries with lower environmental attempted to survey as large a number of CAER
standards and fewer controls. members as possible based on the willingness
of CAER members to participate. Ultimately
Because CAER does not include brokers who are DSM was able to obtain complete surveys from
primarily exporters, CAER membership is not
JOBS THROUGH ELECTRONICS RECYCLING I Final Report
Page 221 CAER members representing 89 locations • Administration and Management -
across the country. Management, accounting, regulatory, and
commodity sales;
Data Collection
• Asset Recovery and IT Asset Disposition
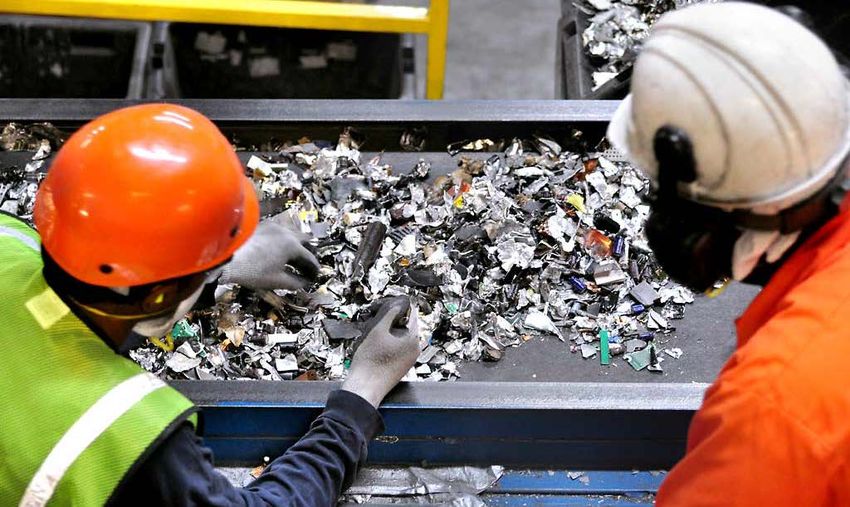
DSM began the analysis by arranging plant visits (ITAD) - Certified data destruction and
with six CAER members located in the disposition of IT assets where the recycler
northeast. The goal was to visit representative has the capability to record make, model
facilities and interview facility managers so that and serial number, and in some cases
DSM could better understand the types of engages in refurbishment of equipment for
resale;
activities carried out and the representative mix
of components typically recovered from de- • Manual De-Manufacturing – Manual de-
manufacturing. DSM conducted telephone manufacturing of electronic devices to
interviews with several additional CAER recover the various components inherent in
members to supplement our understanding of the devices (companies that have hard drive
the industry. shredding technology only are included in
this category);
The plant tours were used to design the CAER
• Shredding - Owns/operates shredding
member survey to capture relevant data on jobs technology to shred electronic devices
from the different activities typical to most other than just hard drives and may include
facilities. DSM then worked with members of companies that have de-manufacturing
the CAER Board to gain feedback on a draft facilities;
survey.
• Glass Cleaning Technology - Owns and
operates technology to clean glass to the
The final survey (Appendix A) was sent out to all
commodity level;
CAER members requesting that they follow up
with DSM on any questions they might have. • Smelter/Refinery - Performs
refining/smelting on site or at one of the
The survey asked for three critical pieces of company's locations; and,
information from each company – employment,
payroll, and annual throughput for the most • Other Activities - Collectors, drivers and
other functions not listed above.
recent year. As part of these surveys, DSM also
asked for employment and throughput for the
The data collected were entered into an Excel
different activities undertaken within each
spreadsheet to analyze the results by location
facility. The following activity areas were
and to investigate outliers or unusual results.
designated in the survey:
DSM followed up with those companies where
January 2013
results were atypical to ensure accurate data
were used in the final analysis.
JOBS THROUGH ELECTRONICS RECYCLING I Final Report
Page 3Results
Survey Results company activities; primarily drivers engaged in
collection or transfer of material between
As indicated above, DSM received completed
facilities. 5
surveys from 21 of CAER’s 67 member
companies that engage in electronics recycling Figure 2 illustrates this breakdown of
activity (vs. affiliates or supporting members). employment among surveyed CAER members.
These 21 surveys represent 89 of the 163 CAER
member locations across the US. Figure 2: Employment by Activity
(CAER Survey – 89 locations)
In total, these 89 facilities employed 4,300
people and processed 715 million pounds of
electronic waste last year, with a weighted
average of 166,000 pounds processed per
employee per year (rounded). Total annual
reported payroll was $158.4 million, or an
average of $37,500 per employee per year
(rounded, including benefits and payments for
temporary workers).
The average firm responding to the survey had
four locations and 205 employees, and
processed 34.15 million pounds of electronics.
The average is skewed by some large members
with multiple locations. The median company The total amount of material processed through
responding to the survey had 100 employees at each type of activity was also summed from the
two locations and processed 10.6 million survey results. Table 1 illustrates that the
pounds of electronics. surveyed CAER members processed 105 million
pounds for asset recovery and ITAD, 252 million
Allocation of Employment by pounds (rounded) were de-manufactured, and
Activity 332 million pounds were shredded. Table 1
also shows that only 7 percent of glass goes
On average, roughly 45 percent of employment
through glass cleaning operations at CAER
was reported to be in de-manufacturing
member facilities. This is because many CAER
followed by 21 percent in asset recovery and
members do not own and operate glass
ITAD functions, and 18 percent in shredding
cleaning equipment.
related operations. Roughly 11 percent of
January 2013
employees were engaged in administration and
management activities including sales functions,
while roughly two percent were engaged in
glass cleaning related activities. Finally, the
remaining two percent were engaged in other
5
Numbers do not add to 100 percent due to
rounding.
JOBS THROUGH ELECTRONICS RECYCLING I Final Report
Page 4Table 1: CAER Survey Results, Throughput by Extrapolation of Survey Results to
Major Activity, In Annual Pounds (1)
all CAER Members
Activity Annual Pounds Percent (%) DSM used the survey results to project total
Asset Recovery and employment, payroll and material throughput
ITAD 105,206,478 13% for the entire CAER membership based on the
Demanufacturing 278,432,324 34% following methodology. Because of economies
Shredding 334,491,154 41% of scale associated with large companies, DSM
Glass Cleaning 52,999,030 7%
extrapolated the survey results by aggregating
Other Activities 43,769,486 5%
responses by company size to create average
(1) Numbers are greater than total pounds employment, payroll and throughput at a single
reported because some materials are location for large and for small CAER member
double counted as they go through more companies.
than one process.
In order to define a business as small, the Small
Business Administration (SBA) applies a size
The breakdown of the average annual pounds standard measured by gross receipts or number
handled per employee performing specific of employees above which a business can no
activities is presented in Table 2. Not longer be considered small. While these
surprisingly, asset recovery and de- thresholds are developed for most business
manufacturing functions among CAER members sectors classified under the North American
were significantly more labor intensive than Industry Classification System (NAICS),
shredding and glass cleaning (glass cleaning electronics recyclers are a relatively new
because of the high weight of CRT glass and industry without a unique classification code.
automation). Size standards for the 6 NAICS codes that may
be used for electronic recyclers use $12.5 and
$7 million in gross receipts and/or 100 or fewer
Table 2: Average Annual Pounds
Handled/Processed Per Employee from CAER employees, meaning that a company would be
Member Survey (Rounded) considered a "small business" if their average
annual gross receipts or employment does not
Average exceed these thresholds. 6
Pounds/Employee
Activity (FTE) Per Year
Asset Recovery and ITAD 115,000 6
For example, members may be assigned to
Demanufacturing 145,000 NAICS 562111, 562112, 562119 and/or 562219
Shredding 421,000 (respectively Solid Waste Collection, Hazardous
Glass Cleaning 736,000 Waste Collection, Other Nonhazardous Treatment
Companywide: 166,000
January 2013
and Disposal and All Other Miscellaneous Waste
Management) of which the first three use $12.5
(1) Companywide accounts for all incoming million in gross receipts as the size standard and
materials and is divided by total the last, $7 million, meaning that a company
employment including those in
would be considered a "small business" if their
management, sales and administrative
average annual gross receipts does not exceed
functions.
$12.5, or $7 million, for the past three years.
JOBS THROUGH ELECTRONICS RECYCLING I Final Report
Page 5Because DSM did not collect gross receipt percent of CAER members, representing 55
information from most CAER members percent of CAER member facilities or locations.
surveyed, this could not be used as an indicator
of size. Therefore, DSM used a combination of Table 4 then presents the results of calculating
the average payroll, employee count and
employment, number of locations and total
payroll to classify surveyed companies as large throughput per location for large and small
or small. sized companies.
In the absence of a clear size standard, DSM The coefficients presented in Table 4 (per
location coefficient) are then used to
defined large as surveyed companies with a
payroll greater than $5 million and/or extrapolate the results from surveyed facilities
employment greater than 100, while those to the total CAER membership facilities, which
are presented in Table 5. This extrapolation is
companies defined as small were assumed to
done for those locations that did not respond to
have 100 or fewer employees and no more than
the survey (the “No Data” column in Table 3) by
two locations.
multiplying the average results in Table 4 for
Once the surveyed companies had been divided large and for small companies by the number of
into large and small companies, then average locations for large and for small companies not
employment, payroll and throughput responding. These modeled results are then
coefficients were calculated for each size. These added to the aggregated survey results and
coefficients formed the basis for estimating shown in Table 5 to estimate the total
employment and payroll at non-responding employment, payroll and throughput for all 163
large and small CAER member companies, by locations operated by CAER members.
location.
As illustrated by Table 5, DSM estimates that
Because DSM did not have employment data CAER members recycled nearly 1.2 billion
for most non-responding CAER members, DSM pounds of electronics last year, employing
used location counts and available CAER roughly 6,850 people in the United States at an
member data to segregate non-respondents by estimated payroll of $251 million
size.
Table 3 presents total CAER member company
and location counts and the count for members
surveyed (by company and location). As Table 3
illustrates, DSM obtained surveys from 31
January 2013
5 (continued)
Other electronic recyclers may be
assigned to NAICS 562920, Materials Recovery
Facilities which has a size standard of $12.5
million in gross receipts or NAICS 423930,
Recyclable Material Merchant Wholesalers which
has a size standard of 100 employees.
JOBS THROUGH ELECTRONICS RECYCLING I Final Report
Page 6Table 3: CAER Membership, Sample Size and Missing Data to be Modeled
Total CAER Members Surveyed Members No Data
Size Class Companies Locations Companies Locations Companies Locations
Large 17 105 10 76 7 29
Small 50 58 11 13 39 45
Total: 67 163 21 89 46 74
Table 4: Average Annual Payroll, Employee Count and Throughput for Surveyed
Large and Small CAER Member Companies, By Facility/Location
Average Per Location
Size Class Payroll ($) Employees (FTE's) Throughput (pounds)
Large 1,945,281 53 8,600,411
Small 812,395 23 4,741,279
Table 5: CAER Survey Results Extrapolated to Total CAER Membership Facilities
(Estimated Jobs, Payroll and Throughput, 2011)
CAER Membership Employees
Categories
Companies Locations Survey Results Extrapolated Total
Large 17 105 4,004 1,528 5,532
Small 50 58 296 1,025 1,321
Total: 67 163 4,300 2,553 6,853
CAER Membership Payroll ($ 1,000)
Categories
Companies Locations Survey Results Extrapolated Total
Large 17 105 $147,841 $56,413 $204,254
Small 50 58 $10,561 $36,558 $47,119
Total: 67 163 $158,402 $92,971 $251,373
CAER Membership Throughput (1,000 Lbs)
Categories
Companies Locations Survey Results Extrapolated Total
Large 17 105 653,631 249,412 903,043
January 2013
Small 50 58 61,637 213,358 274,994
Total: 67 163 715,268 462,769 1,178,037
JOBS THROUGH ELECTRONICS RECYCLING I Final Report
Page 7Potential Increase in Jobs
The purpose of this analysis is to provide CAER • Smelting of shredded circuit boards and
members with a way to assess how many more other precious metal rich materials
jobs might be created in the US if a ban on the would continue to occur primarily
export of unprocessed e-waste were in place. outside of the US, as would recycling of
significant quantities of CRT glass.
In its simplest form, the statement can be made
that, based on DSM’s estimates of the total
throughput and employment of CAER’s Potential Total Job Creation
membership, a new job would be created for
Estimating the total number of new jobs
every additional 172,000 pounds of e-waste
associated with a ban on the export of un-
processed in the United States. 7 This estimate
processed e-waste is significantly more difficult
represents only those jobs directly involved in
than simply quantifying the potential job
processing the additional e-waste. Additional
creation associated with every additional
indirect and induced jobs generated by the
million pounds of e-waste processed in the US.
expenditure of wages associated with the new
This is because there is no generally agreed
direct jobs in e-waste recycling would also be
upon, independent source of data on the
created. Typically indirect and induced jobs
generation, recovery and export of e-waste
double the amount of direct jobs created.
in/from the United States. 8
The estimate of the potential creation of direct
jobs is based on the following important For example, the Electronics Take Back Coalition
assumptions: states that “Recycling industry leaders estimate
that 50% ‐ 80% of all electronic waste collected
• The mix of e-waste processed in the US in the US for recycling is not really recycled at
under a ban on export would be similar all, but is exported via container ship to
to the mix of e-waste currently being developing countries”; while a recent ISRI study
processed by CAER members; (2011) reported that 70% of e-waste was
recycled in the US.
• The relative mix of large and small
companies processing the additional e-
To begin to quantify potential job creation, DSM
waste would resemble that of the
current CAER membership; and, conducted a literature search in an attempt to
find credible data on the generation and
recycling of e-waste in the US.
7
CAER membership’s estimated annual
January 2013
throughput of 1.178 billion pounds divided by
estimated employment of 6,853 persons (Table 5)
equals an average of 171,903 pounds handled per 8
See for example, Characterization of
employee. This is different from the figures in Transboundary Flows of Used Electronics:
Table 2 which is based on the weighted average Summary Report, Miller, TR, et al, Massachusetts
among companies surveyed but not the entire Institute of Technology and J. Linnell, National
CAER membership. Center for Electronics Recycling, January, 2012.
JOBS THROUGH ELECTRONICS RECYCLING I Final Report
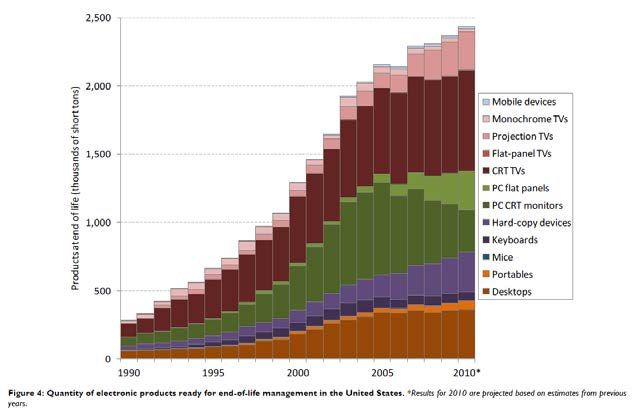
Page 8DSM reviewed the September 2011 survey Figure 2: Quantity of Electronic Products Ready
sponsored by the Institute of Scrap Metal for End-of-life Management in the United
Recyclers (ISRI), eWaste and Environmental States 10 (Source: US EPA ORCR, 2011)
Opportunities Survey, which concluded that 3.5
million tons of electronics were treated by the
recycling industry in the US in 2010 and that 70
percent were processed domestically (or 4.9
billion pounds). 9
DSM also reviewed estimates made by the US
EPA, including those researchers supported by
US EPA.
Based on a review of these two reports as well
as other available literature it is DSM’s opinion
that the US EPA funded report, Characterizing
Transboundary Flows of Used Electronics, 2012
represents the most credible data on potential Note: These are 2010 results based on
generation of e-waste in the US. estimates from previous years.
Figure 8 of that report presents an estimate of DSM recognizes that some of these recycling
roughly 2.4 million tons of e‐waste generation
jobs already exist in non-CAER member
in 2010 in the US, or 4.8 billion pounds (see
companies, but also recognizes that a ban on
Figure 2). export of untested electronics and on landfilling
Assuming that CAER members processed 1.2 electronic waste would help to secure tens of
billion pounds of material in 2011, the US EPA thousands of newly created jobs in the US as
funded report suggests that another 3.6 billion well as more than $1 billion of payroll.
pounds of e-waste are being landfilled, In addition, the amount of jobs associated with
processed by other domestic recycling
recycling electronic waste in the US can be
companies or exported. This additional 3.6
assumed to continue to increase as the amount
billion pounds of e‐waste represents a potential electronic waste continues to rise. The US EPA
21,000 full time equivalent recycling jobs with a
estimates that electronic waste is growing 2-3
corresponding payroll of $772.9 million.
times faster than any other portion of the waste
Assuming a typical multiplier of 2, these direct stream, as the use of electronic devices has
recycling jobs would result in another 21,000
rapidly increased over the past two decades,
indirect and induced jobs, for a total of 42,000
resulting in a large number of products reaching
January 2013
jobs.
9
IDC (David Daoud). Inside the US Electronics
Industry. IDC #229786, Volume: 1, eWaste and
Environmental Opportunities: Survey. September 10
Figure 8 from Characterizing Transboundary
2011. Flows of Used Electronics: Summary Report.
JOBS THROUGH ELECTRONICS RECYCLING I Final Report
Page 9their end of life at a much faster rate than
previously experienced. 11, 12
Finally, even if one were to accept the ISRI
report 13 estimate that 3.5 million tons were
collected for recycling in the US (which is
significantly higher than the current US EPA
estimate), and that 70 percent was processed
for recycling in the US, that would still leave 2
billion pounds that could be processed in the
US, which would result in an estimated 12,200
new direct jobs with a payroll of $448 million.
11
See EPA Region 1 Website at:
January 2013
http://www.epa.gov/region1/solidwaste/electro
nic/index.html
12
Consumers Electronics Association. Market
Research Reports: Trends in CE Reuse, Recycle and
Removal. April 2008.
13
Harris, Eric. State of the U.S. Electronics
Recycling Industry, ISRI, E-Scrap Conference,
October 5, 2011.
JOBS THROUGH ELECTRONICS RECYCLING I Final Report
Page 10Bibliography
Bill of Attributes (BOA) in Life Cycle Modeling of Laptop Computers: Results and Trends from Disassembly
Studies (Ramzy Kahhat, Soumya Poduri, Eric Williams) White Paper #103 | March 2011
Gateway Lab Research Team. CRT Waste Management For RRT Design and Construction. Nathaniel
Egosi, P.E., President. Research Team: Julien Dumoulin-Smith, Jonathan Barbee, Jia Hou, David Judd,
Dheerja Kaur. Faculty Advisor: Marco Castaldi.
IDC (David Daoud). Inside the US Electronics Industry. IDC #229786, Volume: 1, eWaste and
Environmental Opportunities: Survey. September 2011
National Strategy For Electronics Stewardship Interagency Task Force On Electronics Stewardship Co-
Chairs: White House Council on Environmental Quality, Environmental Protection Agency, and General
Services Administration. July 20, 2011.
T. Reed Miller, Jeremy Gregory, Huabo Duan, Randolph Kirchain, Jason Linnell. Characterizing
Transboundary Flows of Used Electronics: Summary Report. Massachusetts Institute of Technology,
Materials Systems Lab and National Center for Electronics Recycling with Support from US
Environmental Protection Agency. January 2012
SBA SIZE STANDARDS METHODOLOGY. Size Standards Division, Office of Government Contracting
& Business Development. April 2009.
U.S. Environmental Protection Agency, Office of Solid Waste. ELECTRONICS WASTE MANAGEMENT IN
THE UNITED STATES APPROACH 1. Final. EPA530-R-08-009 US EPA Washington, DC. July, 2008
U.S. Government Accountability Office, GAO Report to the Chairman, Committee on Foreign Affairs,
House of Representatives. ELECTRONIC WASTE EPA Needs to Better Control Harmful U.S. Exports
through Stronger Enforcement and More Comprehensive Regulation. GAO-08-1044. August 2008.
U. S. Small Business Administration. Table of Small Business Size Standards Matched to North American
Industry Classification System Codes. Effective October 24, 2012.
January 2013
JOBS THROUGH ELECTRONICS RECYCLING I Final Report
Page 11Appendix
Survey Form: Jobs Through Electronics Recycling
January 2013
JOBS THROUGH ELECTRONICS RECYCLING I Final Report
Page 12COALITION FOR AMERICAN
ElectronicsRecycling
CAER Jobs Survey
Conducted by:
COMPANY NAME AND CONTACT INFORMATION
Company Name: Subsidiary of:
Mailing Address:
City: State: Zip:
Contact Name: Title:
E‐mail address: Phone :
Number of Locations:
Location(s) Represented by
this Survey (Please list):
COMPANY WIDE DATA
Total Employment (FTE's): Please list employment for all locations.
Total Annual Payroll ($): Please list payroll for all locations.
Does this include benefits? Yes_______ No________ If No , what percent should be added for benefits?
Annual Lbs Processed: %
Please review the notes below before completing survey.
1) If you have more than one facility you can aggregate data for all of your facilities in the U.S. or you can
complete the survey on the next page for each individual facility location.
2) We would like you to separate employees by activity type. For example, we would like to separate the
number of employees and volume for asset recovery and IT asset disposition from those utilized for
manual demanufacturing from those shredding or glass cleaning.
3) If you are uncertain as to the pounds by process, please make your best estimate based on percentage of
throughput that goes through that process.
4) We understand that material may flow from one process to another. Please enter total input (company‐
wide) or by facility, and then throughput by operation so we can understand how much material is being
double counted.
5) Please provide total full time equivalent (FTE) employment for your company. For payroll, please include
company‐wide payroll, including all benefits and administrative/management payroll. Please note
whether you are including benefits in your total payroll calculation and if so, enter % above.
If questions on completing this form, please contact:
Natalie Starr 802.674.2840 x102 or Natalie@DSMEnvironmental.com
Ted Siegler 802.674.2840 x101 or Ted@DSMEnvironmental.com
If questions on the commissioning of this study, please contact those names below or a CAER board member:
Katie Reilly, Electronic Recyclers International kreilly@electronicrecyclers.com
Wendy Neu, Hugo Neu wneu@hugoneu.comCAER JOBS SURVEY (Page 2)
IMPORTANT: This part of the survey can be completed for the entire firm or per location. Please specify on form whether this is for
a single location or multiple locations, and please complete for each functional area.
Location (if not company‐wide), and Total
Employment at This Location
OPERATIONS/SERVICES PROVIDED
Indicate if you provide Pounds To
this type of service with Total Pounds, Another Operation Employment
Activity Type Description a "Yes" or "No." 2011 at This Location (FTE's)
Administration and Management, accounting,
Management regulatory, commodity sales
Not applicable
Certified data destruction and
disposition of IT assets where
Asset Recovery and recycler has capability to record
IT Asset Disposition make, model and serial number,
etc. and refurbishment of
equipment for resale.
Solely manual de‐manufacturing
of material. Companies that
Manual De‐
have hard drive shredding
Manufacturing
technology ONLY are included in
this category.
Owns/operates shredding
technology to shred electronic
Shredding devices other than just hard
Technology drives. May include companies
that have de‐manufacturing
facilities as well.
Owns and operates technology to
Glass Cleaning
clean glass down to the
Technology
commodity level
Performs refining/smelting on
Smelter/Refinery site or at one of the company's
locations.
Collectors, drivers and other
functions not listed above (please
list in this box)
Other Activities
Totals: 100%You can also read