The Economic Importance of the U.S. Private Shipbuilding and Repairing Industry - Maritime Administration (MARAD)
←
→
Page content transcription
If your browser does not render page correctly, please read the page content below
The Economic
Importance of the U.S.
Private Shipbuilding
and Repairing Industry
Maritime Administration
(MARAD)
March 30, 2021
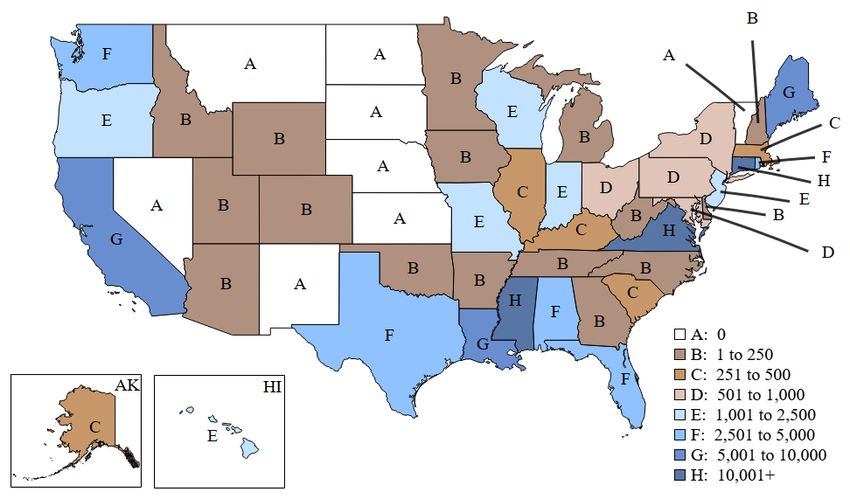
Table of Contents
Executive Summary ................................................................................................................................. 1
I. Introduction .......................................................................................................................................... 4
II. Overview of the U.S. Private Shipbuilding and Repairing Industry ................................................... 6
           A. Industry Definition .................................................................................................................. 6
           B. Description of the Industry...................................................................................................... 6
III. The Economic Impact of the U.S. Private Shipbuilding and Repairing Industry ............................ 15
           A. National Impact ..................................................................................................................... 15
           B. State Impacts ......................................................................................................................... 18
Appendices............................................................................................................................................. 22
           Appendix A: Economic Impact Breakdown: State-Level Detail ............................................. 22
           Appendix B: Data Sources and Methodology .......................................................................... 26
           Appendix C: Longitudinal Data Comparison ........................................................................... 29

This information has been prepared solely for the use and benefit of MARAD and is not intended for reliance by any other person.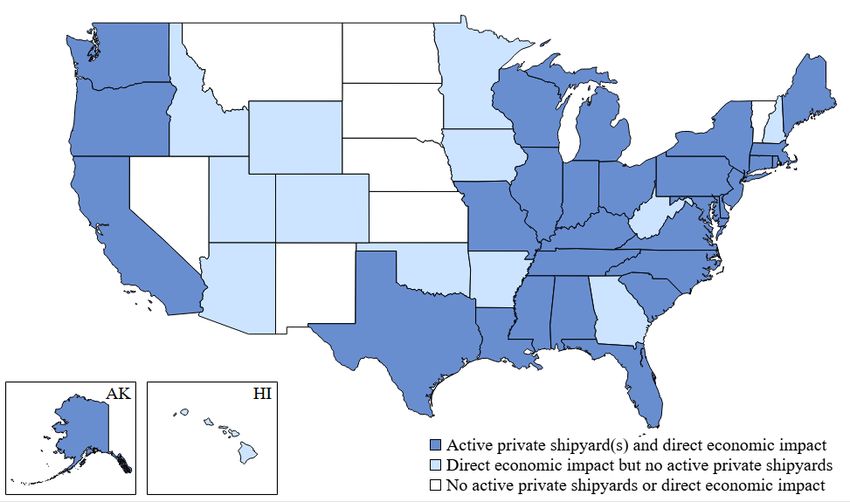
Figures
Figure E1: Total Employment Impact Attributable to the U.S. Private Shipbuilding and Repairing
          Industry, 2019 ......................................................................................................................... 1
Figure E2: Total Labor Income and GDP Impacts Attributable to the U.S. Private Shipbuilding
          and Repairing Industry, 2019 .................................................................................................. 1
Figure E3: Total (Direct, Indirect, and Induced) Employment Impact Attributable to the U.S.
          Private Shipbuilding and Repairing Industry: Top Ten States, 2019 .................................... 2
Figure 1: States with Active Private Shipbuilders and Direct Economic Impact from the Private
          Shipbuilding and Repairing Industry ...................................................................................... 7
Figure 2: Direct Employment in the U.S. Private Shipbuilding and Repairing Industry by State,
          2019 ......................................................................................................................................... 8
Figure 3: Direct Payroll Employment in the U.S. Private Shipbuilding and Repairing Industry,
          2005 to 2020............................................................................................................................ 9
Figure 4: Capital Expenditures by U.S. Private Shipbuilding and Repairing Industry by Type,
          2019 ....................................................................................................................................... 11
Figure 5: U.S. Private Shipbuilding and Repairing Industry Revenues by Product Type, 2019 .......... 12
Figure 6: U.S. Private Shipbuilding and Repairing Industry Costs by Type, 2019 .............................. 13
Figure 7: Total Direct GDP in U.S. Private Shipbuilding and Repairing Industry, 2019 .................... 13
Figure 8: Imports and Exports for the U.S. Shipbuilding and Repairing Industry, 2011–2020 ........... 14
Figure 9: Private Shipbuilding and Repairing Industry’s Total Employment Impact as a Percent
          of Total State Employment: Top Ten States, 2019 ............................................................... 20
Figure 10: Total (Direct, Indirect, and Induced) Employment Impact Attributable to the U.S.
          Private Shipbuilding and Repairing Industry: Top Ten States, 2019 .................................. 20

This information has been prepared solely for the use and benefit of MARAD and is not intended for reliance by any other person.
Tables
Table 1: Total Direct Employment in the U.S. Private Shipbuilding and Repairing Industry: Top
10 States, 2019 ........................................................................................................................ 8
Table 2: Total Direct Labor Income in the U.S. Private Shipbuilding and Repairing Industry: Top
10 States, 2019 ...................................................................................................................... 10
Table 3: Deliveries by U.S. Shipyards, by Type of Vessel, 2015–2020............................................... 11
Table 4: Economic Importance of the U.S. Private Shipbuilding and Repairing Industry, 2019......... 15
Table 5: Direct Economic Impact of the U.S. Private Shipbuilding and Repairing Industry, by
Segment, 2019 ....................................................................................................................... 16
Table 6: Indirect and Induced Activities Attributable to the U.S. Private Shipbuilding and
Repairing Industry, by Industry, 2019 .................................................................................. 17
Table 7: Direct, Indirect, and Induced Taxes Supported by the U.S. Private Shipbuilding and
Repairing Industry, 2019....................................................................................................... 18
Table 8: Direct Impact of the U.S. Private Shipbuilding and Repairing Industry, by State, 2019 ....... 19
Table 9: Total (Direct, Indirect, and Induced) Economic Activities Attributable to the U.S.
Private Shipbuilding and Repairing Industry, 2019 .............................................................. 21
Table A1: Employment Attributable to the U.S. Private Shipbuilding and Repairing Industry,
2019 ....................................................................................................................................... 23
Table A2: Labor Income Attributable to the U.S. Private Shipbuilding and Repairing Industry,
2019 ....................................................................................................................................... 24
Table A3: GDP Attributable to the U.S. Private Shipbuilding and Repairing Industry, 2019 ............. 25
Table A4: Longitudinal Data Comparison (2015 and 2021 Reports) ................................................... 29
This information has been prepared solely for the use and benefit of MARAD and is not intended for reliance by any other person.Executive Summary
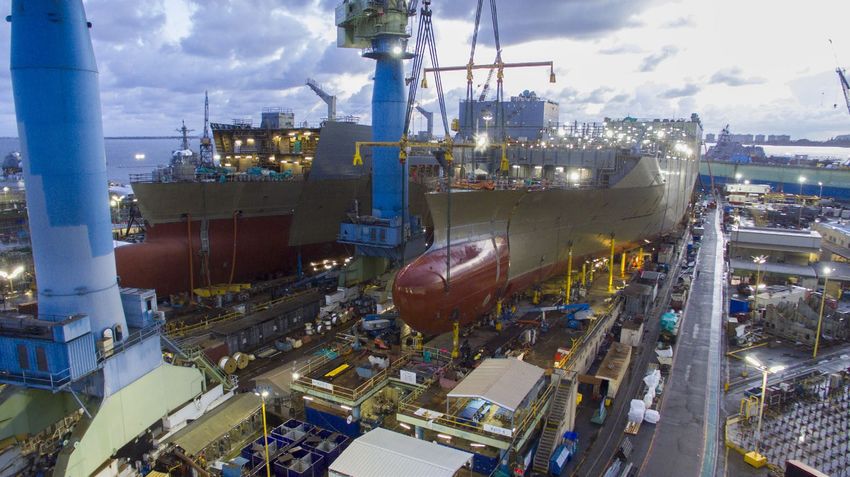
The U.S. private shipbuilding and repairing industry is comprised of establishments that are primarily
engaged in operating shipyards, which are fixed facilities with drydocks and fabrication equipment.
Shipyard activities include ship construction, repair, conversion and alteration, as well as the
production of prefabricated ship and barge sections and other specialized services. The industry also
includes manufacturing and other facilities outside of the shipyard, which provide parts or services for
shipbuilding activities within a shipyard.
In 2019, the U.S. private shipbuilding and repairing industry directly provided 107,180 jobs (see
Figure E1, below), $9.9 billion in labor income, and $12.2 billion in gross domestic product, or GDP,
to the national economy (see Figure E2, below). Including direct, indirect, and induced impacts, on a
nationwide basis, total economic activity associated with the industry reached 393,390 jobs, $28.1
billion of labor income, and $42.4 billion in GDP in 2019.
Figure E1: Total Employment Impact Attributable to the U.S. Private Shipbuilding and
Repairing Industry, 2019
Total Employment Impact = 393,390
Employment 107,180 276,100 10,110
0 50,000 100,000 150,000 200,000 250,000 300,000 350,000 400,000 450,000
Number of Jobs
Direct Impacts Indirect and Induced from Operations Indirect and Induced from Capital Investments
Source: Calculations using the IMPLAN modeling system (2019 database).
Figure E2: Total Labor Income and GDP Impacts Attributable to the U.S. Private Shipbuilding
and Repairing Industry, 2019
Total Impact = $28.1B
Labor
$9.9B $17.4B $0.7B
Income
Total Impact = $42.4B
GDP $12.2B $29.1B $1.1B
$0 $5 $10 $15
$20 $25 $30 $35 $40 $45
Billions of Dollars
Direct Impacts Indirect and Induced from Operations Indirect and Induced from Capital Investments
Source: Calculations using the IMPLAN modeling system (2019 database).
1
This information has been prepared solely for the use and benefit of MARAD and is not intended for reliance by any other person.The industry impact by state varies based on the level of direct activity and the share of the supply
chain included in the state. The states with the highest levels of overall direct, indirect, and induced
employment associated with the industry are Virginia, California, Connecticut, Mississippi, and Texas
(see Figure E3).
Figure E3: Total (Direct, Indirect, and Induced) Employment Impact Attributable to the U.S.
Private Shipbuilding and Repairing Industry: Top Ten States, 2019
80,000
71,710
70,000
60,000
Number of Jobs
50,000
37,880
40,000
28,310
30,000 24,910
21,530 21,380
20,000 16,780
13,860 11,510 11,370
10,000
0
Source: Calculations using the IMPLAN modeling system (2019 database).
Considering the indirect and induced impacts, each direct job in the U.S. private shipbuilding and
repairing industry is associated with another 2.67 jobs in other parts of the U.S. economy; each dollar
of direct labor income and GDP in the U.S. private shipbuilding and repairing industry is associated
with another $1.82 in labor income and $2.48 in GDP, respectively, in other parts of the U.S.
economy.
Currently there are 154 private shipyards in the United States, spread across 29 states and the U.S.
Virgin Islands, that are classified as active shipbuilders. In addition, there are more than 300
shipyards engaged in ship repairs or capable of building ships but not actively engaged in
shipbuilding. 1 The majority of shipyards are located in the coastal states, but there also are active
shipyards on major inland waterways such as the Great Lakes, the Mississippi River, and the Ohio
River. Employment in shipbuilding and repairing is concentrated in a relatively small number of
coastal states, with the top five states accounting for 64 percent of all private employment in the
shipbuilding and repairing industry.
The Federal government, including the U.S. Navy, U.S. Army, and U.S. Coast Guard, is an important
source of demand for U.S. shipbuilders. While less than three percent of the vessels delivered in 2020
(16 of 608) were delivered to U.S. government agencies, 14 of the 15 deliveries of large deep-draft
vessels were to the U.S. government: seven to the U.S. Navy and seven to the U.S. Coast Guard.
1
See www.shipbuildinghistory.com for details. www.shipbuildinghistory.com is maintained by Tim Colton, a
professional with more than 60 years of experience in the shipbuilding industry. His resume is accessible at
http://shipbuildinghistory.com/resume.htm.
2
This information has been prepared solely for the use and benefit of MARAD and is not intended for reliance by any other person.The purpose of this report is to measure the economic importance of the U.S. private shipbuilding and
repairing industry at the national and state levels for calendar year 2019. The importance of the
industry is not limited to the direct output and employment it generates (i.e., “direct impact”).
Companies in the shipbuilding and repairing industry purchase inputs from other domestic industries,
contributing to economic activity in those sectors (i.e., “indirect” impact). Employees spend their
incomes, helping to support the local and national economies (i.e., “induced” impact). Thus, the
economic importance of the U.S. private shipbuilding and repairing industry includes direct, indirect,
and induced effects. Put differently, the report seeks to document what happens in the U.S. private
shipbuilding and repairing industry and its relationships to the broader economy. It is important to
note that the term “economic impacts” as used in this report reflects the association of employment,
labor income, and gross domestic product (GDP) with the U.S. private shipbuilding and repairing
industry (including the economic effects of services performed for the government), but does not
imply that some of this economic activity would not otherwise exist without the industry.
The IMPLAN model, an input-output (I-O) model based on Federal government data, was used to
estimate the industry’s overall economic impact. I-O modeling is typically employed to analyze how
a change in economic activity in one sector of the economy affects activities in other sectors of the
economy. In a so-called “marginal” impact analysis, I-O model results can be viewed as showing the
impact of small changes in activity in one sector (e.g., shipbuilding) on the rest of the economy before
any price adjustments and any adjustments away from other sectors of the economy. The ultimate
economic impact of a change in activity can be less pronounced than shown in initial I-O results,
particularly if induced price changes are large.
I-O models can also be used in an economic contribution analysis, as done in this study. By
simulating a “complete shutdown” of an existing industry, an economic contribution study attempts to
quantify the portion of a region’s economy that can be attributed to such an existing industry. It uses
the I-O model to identify all backward (i.e., upstream) linkages in the study area. An economic
contribution analysis, when compared with the entire study area economy, offers insights into the
relative extent and magnitude of the industry in the study area. However, this is not to say that a
complete shutdown of the shipbuilding and repairing industry would result in the permanent loss of
the jobs and output attributable to the industry through this exercise. In this unlikely event, the
resources currently allocated to the shipyards may find employment in other industries, which would
compensate in part for the loss of the jobs and output from the shipyard sector.
The study disaggregates the industry’s economic activity into two components: operational and capital
investment impacts. The operational impact is from purchases of intermediate goods and services,
and the capital investment impact is from investment in new structures and equipment. 2 These
economic impacts represent all of the backward linkages of the U.S. shipbuilding and repairing
industry to its suppliers. They do not capture any forward linkages (i.e., the economic impact on
production in sectors that use ships or other shipyard products as an input).
2
The IMPLAN model results were adjusted to include the economic activity attributable to capital spending by the
shipbuilding and repairing sector.
3
This information has been prepared solely for the use and benefit of MARAD and is not intended for reliance by any other person.I. Introduction
The purpose of this report is to quantify the economic importance of the U.S. private shipbuilding and
repairing industry in 2019, in terms of employment, labor income, and GDP. 3 The study quantifies
the industry’s operational impact (due to its purchases of intermediate inputs) and capital investment
impact (due to its investment in new structures and equipment) at the national and state level. These
economic impacts represent all of the backward linkages of the U.S. shipbuilding and repairing
industry to its suppliers. They do not capture any forward linkages (i.e., the economic impact on
production in sectors that use ships as an input). All economic impacts are reported in gross terms,
which means they do not take account of what would have taken place in the absence of the
shipbuilding and repairing industry.
In describing the economic importance of the U.S. private shipbuilding and repairing industry through
its employment and purchases of goods and services, this report considers three separate channels—
the direct impact, the indirect impact, and the induced impact—that in aggregate provide a measure of
the economic importance of the U.S. private shipbuilding and repairing industry.
• Direct impact is measured as the jobs, labor income, and GDP within the U.S. private
shipbuilding and repairing industry.
• Indirect impact is measured as the jobs, labor income, and GDP occurring throughout the
supply chain of the U.S. private shipbuilding and repairing industry. The indirect impact also
includes suppliers to the companies providing goods and services to the U.S. private
shipbuilding and repairing industry.
• Induced impact is measured as the jobs, labor income, and GDP resulting from household
spending of labor income earned either directly or indirectly from the U.S. private shipbuilding
and repairing industry’s spending under standard input-output modeling assumptions. It
should be interpreted with caution as it involves personal spending decisions by employees of
shipyards and its supply chain that are further removed from direct shipyard expenditure
activities and are more difficult to estimate.
Together these effects demonstrate the private shipbuilding and repairing industry’s economic
importance and relationship to all sectors of the U.S. economy.
The IMPLAN model, an input-output (I-O) model based on Federal government data, was used to
estimate the industry’s overall economic impact. I-O modeling is typically employed to analyze how
a change in economic activity in one sector of the economy affects activities in other sectors of the
economy. In a so-called “marginal” impact analysis, I-O model results can be viewed as showing the
impact of small changes in activity in one sector (e.g., shipbuilding) on the rest of the economy before
any price adjustments and any adjustments away from other sectors of the economy. The ultimate
economic impact of a change in activity can be less pronounced than shown in initial I-O results,
particularly if induced price changes are large.
I-O models can also be used in an economic contribution analysis, as done in this study. By
simulating a “complete shutdown” of an existing industry, an economic contribution study attempts to
quantify the portion of a region’s economy that can be attributed to such an existing industry. It uses
the I-O model to identify all backward (i.e., upstream) linkages in the study area. An economic
3
Gross domestic product (GDP) reflects the income earned by labor (e.g., wages and salaries) and capital (e.g., profits)
and any indirect business taxes (including excise taxes, property taxes, fees, licenses, and sales taxes paid by businesses).
4
This information has been prepared solely for the use and benefit of MARAD and is not intended for reliance by any other person.contribution analysis, when compared with the entire regional economy, offer insights into the relative
extent and magnitude of the industry in the study area. However, this is not to say that a complete
shutdown of the shipbuilding and repairing industry would result in the permanent loss of the jobs and
output attributable to the industry as these resources may find employment in other industries.
The rest of this report is organized as follows. Section II provides a brief overview of the U.S.
private shipbuilding and repairing industry. Section III presents estimates of the industry’s economic
impact in 2019 in terms of employment, labor income, and GDP at the national and state levels.
Appendix A provides additional details on the industry’s economic impact at the state level.
Appendix B provides a description of the data sources and methodology used for the study.
5
This information has been prepared solely for the use and benefit of MARAD and is not intended for reliance by any other person.II. Overview of the U.S. Private Shipbuilding and
Repairing Industry
A. Industry Definition
Economic activity directly associated with the U.S. private shipbuilding and repairing industry is
primarily captured in government data under the North American Industry Classification System
(NAICS) sector 336611, Shipbuilding and Repairing. According to the U.S. Census Bureau, this
industry comprises establishments that are primarily engaged in operating shipyards, which are fixed
facilities with drydocks and fabrication equipment. Shipyard activities include ship construction,
repair, conversion, and alteration. They also include the production of prefabricated ship and barge
sections, and other specialized services. 4 The industry may also include manufacturing and other
facilities outside of the shipyard, which provide parts or services for ship building activities within a
shipyard.
The industry also includes a portion of NAICS sector 488390, Other Support Activities for Water
Transportation. Among other activities, NAICS sector 488390 includes routine repair and
maintenance of ships from floating drydocks, as well as ship scaling services not done in a shipyard.
According to the 2017 Economic Census, approximately 76.7 percent of the revenues of NAICS
sector 488390 were derived from routine repairs and maintenance of maritime vessels. 5
B. Description of the Industry
Currently there are 154 private shipyards in the United States, spread across 29 states and the U.S.
Virgin Islands, that are classified as active shipbuilders. In addition, there are more than 300 private
shipyards engaged in ship repairs or capable of building ships but not actively engaged in
shipbuilding. 6 As shown in Figure 1, below, the majority of active shipbuilders are located in the
coastal states. However, there also are active shipyards on major inland waterways such as the Great
Lakes, the Mississippi River, and the Ohio River. The industry also includes manufacturing and other
facilities outside of these shipyards that provide parts or services for the shipbuilding and repairing
industry. Furthermore, the industry includes routine maintenance and repairs conducted from floating
drydocks. As a result, the scope of economic activity directly attributable to the U.S. shipbuilding and
repairing industry 7 is wider than the 29 states with active private shipyards, as displayed in Figure 1,
below.
4
https://www.census.gov/cgi-bin/sssd/naics/naicsrch?chart=2017
5
U.S. Census Bureau, 2017 Economic Census, “All Sectors: Industry by Products for the U.S.: 2017.”
6 See the directory of shipyards at http://shipbuildinghistory.com. Of the 154 private shipyards summarized in Figure 1, 25
are mid-sized to large shipyards capable of building naval ships and submarines, oceangoing cargo ships, drilling rigs and
high-value, high-complexity mid-sized vessels, and 129 are smaller yards capable of building the simpler types of smaller
commercial vessels, such as tugs, towboats, offshore service vessels, fishing vessels, ferries and barges. In addition to
these 154 private shipyards, there are five public shipyards operated by the U.S. Navy or U.S. Coast Guard and eight
shipyards that actively or occasionally produce large yachts. Shipbuildinghistory.com also lists more than 300 shipyards
and boatyards that are classified as inactive.
7
Information on the BLS definition of the scope of activities included in the industry can be found at
https://data.bls.gov/cew/apps/bls_naics/v2/bls_naics_app.htm#tab=search&naics=2017&keyword=336611&searchType=ti
tles&fromHier=true&filter=nothing&sort=text_asc&resultIndex=0
6
This information has been prepared solely for the use and benefit of MARAD and is not intended for reliance by any other person.Figure 1: States with Active Private Shipbuilders and Direct Economic Impact from the Private
Shipbuilding and Repairing Industry
Source: Directory of shipyards at http://shipbuildinghistory.com and data from the U.S. Census Bureau, U.S. Bureau of
Labor Statistics, and U.S. Bureau of Economic Analysis.
1. Private Employment
The U.S. private shipbuilding and repairing industry accounted for an estimated 107,180 jobs in 2019,
including both payroll employees and self-employed workers and both full-time and part-time
workers. The vast majority of these jobs (100,830) were in shipbuilding and repairing (NAICS sector
336611), with the remainder (6,350) accounted for by routine maintenance and repair conducted
outside of a shipyard (NAICS sector 488390). 8
Employment in private shipbuilding and repairing is concentrated in a relatively small number of
states (see Figure 2, below). As shown in Table 1, below, 64 percent of all private direct
employment in the industry is located in just five states: Virginia, Connecticut, Mississippi,
California, and Louisiana.
8
These numbers do not include Federal government employment. According to the U.S. Bureau of Labor Statistics, total
employment at Federal government-operated shipyards was 39,156 in 2019.
7
This information has been prepared solely for the use and benefit of MARAD and is not intended for reliance by any other person.Table 1: Total Direct Employment in the U.S. Private Shipbuilding and Repairing Industry:
Top 10 States, 2019
Percent of
State Private Employmenta
U.S. Total
Virginia 30,270 28.2%
Connecticut 11,820 11.0%
Mississippi 11,190 10.4%
California 8,490 7.9%
Louisiana 6,620 6.2%
Maine 5,700 5.3%
Florida 4,700 4.4%
Alabama 4,290 4.0%
Texas 3,400 3.2%
Rhode Island 2,580 2.4%
All other states combined 18,120 16.9%
U.S. Total 107,180 100%
Source: Estimates based on data from the U.S. Census Bureau, U.S. Bureau of Labor Statistics, and U.S. Bureau of
Economic Analysis.
Note: Details may not add to totals due to rounding.
a
Employment is defined as the number of payroll and self-employed jobs, including part-time jobs.
Figure 2: Direct Employment in the U.S. Private Shipbuilding and Repairing Industry by State,
2019
Source: Estimates based on data from the U.S. Census Bureau, U.S. Bureau of Labor Statistics, and U.S. Bureau of
Economic Analysis.
8
This information has been prepared solely for the use and benefit of MARAD and is not intended for reliance by any other person.Nearly all jobs in the U.S. private shipbuilding and repairing industry are payroll jobs. In 2019,
private payroll employment accounted for 98,650 of the total 100,830 jobs in NAICS sector 336611,
or 98 percent of the total, with self-employed jobs accounting for the remainder. Private sector
payroll employment in NAICS 336611 grew rapidly between 2005 and 2008, from 90,840 to 104,440
(see Figure 3). As a result of the global recession that began in the United States in 2008, the
industry contracted, losing more than 9,000 payroll jobs between 2008 and 2011, before rebounding in
2012. After 2014, private sector payroll employment in NAICS sector 336611 started to decline again,
reaching a low of 94,140 in 2017, before rebounding to 98,650 in 2019. For the first six months of
2020, private sector payroll employment declined by 600 jobs due to the Covid-19 pandemic to
98,050.
Figure 3: Direct Payroll Employment in the U.S. Private Shipbuilding and Repairing Industry,
2005 to 2020*
110,000
104,440
105,000 103,370
101,250 102,390
99,020
Payroll Employment
100,000 99,810 100,590 98,050
96,640
98,650
96,560
95,000
95,130 94,990
93,510 94,140
90,000
90,840
85,000
80,000
Source: Total private sector payroll employment for NAICS sector 336611 from U.S. Bureau of Labor Statistics,
Quarterly Census of Employment and Wages (Downloaded March 1, 2021). Excludes the portion of the industry classified
in NAICS sector 488390.
*Data for 2020 is average for January through June.
2. Labor Income
Total labor income in the U.S. private shipbuilding and repairing industry (including wages and
salaries and benefits as well as proprietors’ income) amounted to $9.9 billion in 2019. As with private
employment, industry labor income is concentrated in a relatively small number of states, with five
states (Virginia, Connecticut, Mississippi, California, and Louisiana) accounting for 67 percent of all
direct labor income for the private U.S. shipbuilding and repairing industry (see Table 2, below).
Average labor income per job was approximately $92,770 in 2019, 49 percent higher than the national
average for the private sector economy ($62,090).
9
This information has been prepared solely for the use and benefit of MARAD and is not intended for reliance by any other person.Table 2: Total Direct Labor Income in the U.S. Private Shipbuilding and Repairing Industry:
Top 10 States, 2019
Private Labor
Percent of
State Incomea
U.S. Total
($ millions)
Virginia $3,101.4 31.2%
Connecticut $1,347.0 13.5%
Mississippi $952.8 9.6%
California $748.0 7.5%
Louisiana $541.2 5.4%
Maine $465.1 4.7%
Alabama $368.0 3.7%
Florida $344.8 3.5%
Texas $280.4 2.8%
Washington $237.1 2.4%
All other states combined $1,324.0 13.3%
U.S. Total $9,943.2 100%
Source: Calculations using the IMPLAN Modeling system (2019 database) and data from the U.S. Census Bureau, U.S.
Bureau of Labor Statistics, and U.S. Bureau of Economic Analysis.
Note: Details may not add to totals due to rounding.
a
Labor income is defined as wages and salaries, benefits, and proprietors’ income.
3. Capital Expenditures
Based on data from the U.S. Census Bureau, it is estimated that the U.S. private shipbuilding and
repairing industry spent a total of $896.3 million on new and used capital assets in 2019. The majority
of capital spending for the industry is spending on new structures and equipment. In 2019, the
industry spent an estimated $873.4 million on new capital assets ($558.5 million on new equipment
and $314.9 million on new structures) and $22.9 million on used structures and equipment (see
Figure 4, below). 9
9 The industry’s spending on used structures and equipment is not taken into account in modeling the industry’s capital
investment impact.
10
This information has been prepared solely for the use and benefit of MARAD and is not intended for reliance by any other person.Figure 4: Capital Expenditures by U.S. Private Shipbuilding and Repairing Industry by Type,
2019
Used Structures and Equipment,
$22.9 milllion
New Structures,
$314.9 million
New Equipment,
$558.5 million
Source: Estimated based on the U.S. Census Bureau’s 2019 Annual Survey of Capital Expenditures and the 2017
Economic Census.
4. Industry Output
U.S. shipbuilders delivered 608 vessels of all types in 2020, up from 577 vessels in 2019 (see Table
3). More than 60 percent of vessels delivered during the last six years have been inland tank and dry
cargo barges. However, deliveries of inland tank barges and dry cargo barges showed the greatest
decrease in terms of vessels delivered between 2015 to 2020.
Table 3: Deliveries by U.S. Shipyards, by Type of Vessel, 2015–2020
Type of Vessel 2015 2016 2017 2018 2019 2020
Deep-Draft Vessels and Structures 18 28 18 20 14 15
Offshore Service Vessels 43 21 11 5 5 1
Tugs and Towboats 122 110 88 85 87 122
Passenger Vessels (>50 feet) 25 32 51 46 47 40
Commercial Fishing Vessels (>50 feet) 7 16 9 7 6 4
Other Self-Propelled Vessels (>50 feet) 8 9 11 3 12 13
Large Oceangoing Barges 7 11 10 7 0 5
Inland Tank Barges 268 117 87 84 182 135
Inland Dry Cargo Barges 940 985 301 229 224 273
Total Delivered 1,438 1,329 586 486 577 608
Source: www.shipbuildinghistory.com
Note: The delivery date for a vessel was determined by the date on which its Certificate of Documentation was issued,
which should be, but may not be, the date on which the shipyard made delivery.
The Federal government, including the U.S. Navy, U.S. Army, and U.S. Coast Guard, remains an
important source of demand for private U.S. shipbuilders. While only 16 of the 608 vessels delivered
11
This information has been prepared solely for the use and benefit of MARAD and is not intended for reliance by any other person.in 2020 were delivered to the U.S. government, nearly all deliveries of large deep-draft vessels (14 of
15) were to U.S. government agencies (seven to the U.S. Navy and seven to the U.S. Coast Guard).
Total revenues for the U.S. shipbuilding and repairing industry are estimated to be $27.9 billion in
2019, up from $26.9 billion in 2018. 10 In 2019, 78.7 percent of these revenues came from military
shipbuilding and repairs, and 21.3 percent from commercial shipbuilding and repairs (see Figure 5).
Figure 5: U.S. Private Shipbuilding and Repairing Industry Revenues by Product Type, 2019
Commercial Shipbuilding and
Repairs, 21.3%
Military Shipbuilding and
Repairs, 78.7%
Source: IBISWorld, “Staying Afloat: Steady Demand from Defense Spending, Oil Production and Freight Transport Will
Likely Drive Growth.” Industry Report 33661a, September 2020.
Figure 6, below, provides a breakdown of industry costs. The largest expense for ship builders is
purchases of raw materials and supplies used in the construction and repair of ships, including paints,
steel plates, copper tubing, aluminum, and iron castings. These purchases account for an estimated
34.1 percent of total industry costs. Other costs (which include research and development, insurance,
security, cleaning costs, equipment repairs, and site maintenance) are the second largest expenditure
for the industry, amounting to approximately 34.0 percent of industry costs. Wages account for 26.9
percent of industry costs. Depreciation, rent, and utilities account for the remaining 5.0 percent of
industry costs.
10
U.S. Census Bureau, Annual Survey of Manufacturers for 2018 and 2019; Service Annual Survey for 2018 and 2019; and
Economic Census for 2017. These data points include the private and public shipbuilding and repairing industry.
12
This information has been prepared solely for the use and benefit of MARAD and is not intended for reliance by any other person.Figure 6: U.S. Private Shipbuilding and Repairing Industry Costs by Type, 2019
100% Utilities, 0.8%
Rent, 1.3%
Depreciation, 2.9%
80% Wages, 26.9%
60%
Other costs, 34.0%
40%
20% Purchases of raw
materials and
supplies, 34.1%
0%
Source: IBISWorld, “Staying Afloat: Steady demand from defense spending, oil production and freight transport will
likely drive growth” Industry Report 33661a, September 2020.
Total GDP in the U.S. private shipbuilding and repairing industry (including routine maintenance and
repairs conducted outside of shipyards) amounted to $12.2 billion in 2019. As with employment, the
majority of the industry’s GDP ($11.6 billion) was related to shipbuilding and repairing tied to
shipyards (NAICS sector 336611), compared to $0.6 billion for routine maintenance and repairs
conducted outside of a shipyard (see Figure 7).
Figure 7: Total Direct GDP in U.S. Private Shipbuilding and Repairing Industry, 2019
Routine maintenance and repairs
outside of shipyards, $626.6 million
Shipbuilding and repairing at
shipyards, $11,559.2 million
Source: Calculations based on the IMPLAN Modeling system (2019 database).
13
This information has been prepared solely for the use and benefit of MARAD and is not intended for reliance by any other person.5. Foreign Trade
The value of imports and exports of ships and repair services varies considerably over time, in part
due to the long lead time associated with manufacturing and delivering finished ships (see Figure 8).
Imports of finished ships, inputs, and repair services amounted to $596 million in 2020, down from
$686 million in 2019. Industry imports are limited by regulation; in particular, the Jones Act (section
27 of the Merchant Marine Act of 1920) requires that all vessels carrying goods between U.S. ports be
manufactured (or rebuilt) in the United States and be owned, operated, and crewed by U.S. citizens.
In addition, imports for U.S. government needs are generally limited because defense contracts
typically require access to sensitive military technology and information.
In contrast, exports by U.S. shipbuilders have remained relatively strong in recent years, reaching $1.8
billion in 2020 and $2.0 billion in 2019 (representing 7.5 percent of industry revenues in 2019). As a
result, the U.S. shipbuilding industry has run a trade surplus in eight out of the last ten years and a
cumulative trade surplus of $7.3 billion over this period.
Figure 8: Imports and Exports for the U.S. Shipbuilding and Repairing Industry, 2011–2020
$3,000
2,746
$2,500
2,180
2,086
1,998
$2,000 1,882
1,785
Value ($ millions)
1,632 1,649 1,577
$1,500 1,436
1,179
1,116
1,003
$1,000
806 812
724 686
568 596
$500
275
$0
2011 2012 2013 2014 2015 2016 2017 2018 2019 2020
Exports Imports
Source: IBISWorld, “Staying Afloat: Steady demand from defense spending, oil production and freight transport will
likely drive growth” Industry Report 33661a, September 2020.
14
This information has been prepared solely for the use and benefit of MARAD and is not intended for reliance by any other person.III. The Economic Impact of the U.S. Private
Shipbuilding and Repairing Industry
In this study, the economic impact of the U.S. private shipbuilding and repairing industry is measured
in terms of its direct, indirect and induced impacts at the national and state levels.
The IMPLAN model, an input-output (I-O) model based on Federal government data, is used to
quantify these linkages. 11 The IMPLAN model does not track capital expenditures (such as spending
on equipment) by industry; consequently, the activity associated with capital spending by the
shipbuilding and repairing industry has been separately calculated. See Appendix B for a more
detailed description of the methodology used for this study.
A. National Impact
In 2019, on a national basis, the U.S. private shipbuilding and repairing industry directly provided
107,180 jobs (see Table 4). Including direct, indirect, and induced impacts, 393,390 jobs were
supported by the industry. Total labor income associated with all direct, indirect, and induced jobs
was $28.1 billion. The industry directly and indirectly contributed $42.4 billion to GDP in 2019.
Table 4: Economic Importance of the U.S. Private Shipbuilding and Repairing Industry, 2019
Indirect & Induced
Impacts
Direct Total Total / Direct
Impacts Capital Impacts (“Multiplier”)c
Operational
Investment
Impacts
Impacts
Employment (jobs)a 107,180 276,100 10,110 393,390 3.67
b
Labor Income ($ billions) $9.9 $17.4 $0.7 $28.1 2.84
GDP ($ billions) $12.2 $29.1 $1.1 $42.4 3.48
Source: Calculations using the IMPLAN Modeling system (2019 database) and data from the U.S. Census Bureau, U.S.
Bureau of Labor Statistics, and U.S. Bureau of Economic Analysis.
Note: Details may not add to totals due to rounding.
a
Employment is defined as the number of payroll and self-employed jobs, including part-time jobs.
b
Labor income is defined as wages and salaries and benefits as well as proprietors’ income.
c
Economic multiplier represents the overall impact (including direct, operational, and capital investment contributions)
relative to the direct impact.
By segment, over 90 percent of the direct economic activity is in the primary industry code,
shipbuilding and repairing (NAICS 336611), which was responsible for 100,830 direct jobs, paid $9.4
billion in labor income, and generated $11.6 billion in GDP in 2019. Routine ship maintenance and
repair activities (part of NAICS 488390) directly accounted for 6,350 jobs, $588 million in labor
income, and $627 million in GDP (see Table 5, below).
11
The IMPLAN model is based on input-output (I-O) tables that map the flow of value along the supply chain for the
different industries in the economy. For example, for the shipbuilding and repairing industry these tables provide the
value of inputs purchased from other industries that supply the shipbuilding and repairing industry. The supplying
industries also purchase inputs from other industries to deliver their products; these impacts are also captured. See
Appendix D for a description of the model.
15
This information has been prepared solely for the use and benefit of MARAD and is not intended for reliance by any other person.Table 5: Direct Economic Impact of the U.S. Private Shipbuilding and Repairing Industry, by
Segment, 2019
Employment a Labor Income b GDP
NAICS Segment Description
(jobs) ($ millions) ($ millions)
336611 Shipbuilding and repairing 100,830 $9,355 $11,559
488390 Routine ship maintenance and repairs 6,350 $588 $627
Total 107,180 $9,943 $12,186
Source: Calculations using the IMPLAN Modeling system (2019 database) and data from the U.S. Census Bureau, U.S.
Bureau of Labor Statistics, and U.S. Bureau of Economic Analysis.
a
Employment is defined as the number of payroll and self-employed jobs, including part-time jobs.
b
Labor income is defined as wages and salaries and benefits as well as proprietors’ income.
Most of the indirect and induced economic impact of the industry is associated with the industry’s
ongoing operations, as its capital expenditures account for less than five percent (see Table 6, below).
The largest amount of indirect and induced economic activity associated with the industry is in the
services sector. 12 Other significant indirect and induced activities occur in wholesale and retail trade;
finance, insurance and real estate; and manufacturing.
Considering the indirect and induced impacts, each direct job in the U.S. private shipbuilding and
repairing industry is associated with another 2.67 jobs in other parts of the national economy; each
dollar of direct labor income and GDP is associated with another $1.82 in labor income and $2.48 in
GDP, respectively, outside of the U.S. private shipbuilding and repairing industry.
12
The services sector, such as management of companies, architectural, engineering, and related services, other
professional services, employment services, and business support services, received nearly half of the indirect impact due
to its importance in the supply chain to the shipbuilding and repairing industry. The services sector further received more
than half of the induced impact from consumer spending attributable to the industry.
16
This information has been prepared solely for the use and benefit of MARAD and is not intended for reliance by any other person.Table 6: Indirect and Induced Activities Attributable to the U.S. Private Shipbuilding and
Repairing Industry, by Industry, 2019
Employment Labor Income GDP
Sector Description
(jobs)a ($ millions)b ($ millions)
Direct Impact 107,180 $9,943 $12,186
Indirect and Induced Impact on Other Industries 286,210 $18,135 $30,184
Operational Impact 276,100 $17,412 $29,083
Agriculture 3,380 $108 $168
Mining 910 $110 $231
Utilities 1,130 $196 $597
Construction 2,430 $160 $205
Manufacturing 27,250 $2,264 $3,972
Wholesale and retail trade 33,960 $2,011 $3,687
Transportation and warehousing 18,680 $1,041 $1,298
Information 5,310 $724 $1,607
Finance, insurance, real estate, rental and leasing 30,300 $2,040 $6,591
Services 148,740 $8,424 $10,296
Other 4,010 $334 $432
Capital Investment Impact 10,110 $723 $1,101
Agriculture 90 $3 $4
Mining 30 $3 $7
Utilities 30 $5 $15
Construction 1,010 $66 $68
Manufacturing 1,850 $160 $249
Wholesale and retail trade 1,220 $78 $141
Transportation and warehousing 530 $30 $37
Information 200 $30 $69
Finance, insurance, real estate, rental and leasing 730 $47 $155
Services 4,390 $299 $350
Other 30 $3 $5
Total Economic Impact 393,390 $28,078 $42,370
Source: Calculations using the IMPLAN Modeling system (2019 database).
Note: Details may not add to totals due to rounding.
a
Employment is defined as the number of payroll and self-employed jobs, including part-time jobs.
b
Labor income is defined as wages and salaries and benefits as well as proprietors’ income.
In 2019 the U.S. private shipbuilding and repairing industry generated a total of $2.4 billion in
Federal, state, and local taxes. Including the additional taxes supported by the industry’s supply chain
and its employees, the industry’s total tax contribution was $8.5 billion in 2019 (see Table 7, below).
17
This information has been prepared solely for the use and benefit of MARAD and is not intended for reliance by any other person.Table 7: Direct, Indirect, and Induced Taxes Supported by the U.S. Private Shipbuilding and
Repairing Industry, 2019
Direct Indirect Induced Total
Tax Level Tax Category
($ millions) ($ millions) ($ millions) ($ millions)
Corporate Income Taxes $47.7 $98.1 $123.7 $269.5
Personal Income Taxes $751.8 $636.7 $692.7 $2,081.3
Excise Taxes $13.5 $57.5 $96.1 $167.1
Customs Duties $6.7 $28.5 $47.6 $82.8
Federal
Social Insurance Contributions $1,138.4 $896.6 $957.0 $2,992.0
Other $1.0 $4.5 $7.4 $12.9
Federal Total $1,959.2 $1,721.8 $1,924.5 $5,605.6
Corporate Income Taxes $18.9 $38.9 $49.0 $106.8
Personal Income Taxes $195.3 $165.4 $180.0 $540.7
Property Taxes $70.4 $300.8 $502.1 $873.2
Sales Taxes $77.2 $329.8 $550.6 $957.6
State & Local
Social Insurance Contributions $19.8 $15.0 $15.9 $50.7
Other $68.9 $104.8 $146.6 $320.3
State & Local Total $450.5 $954.7 $1,444.2 $2,849.3
Federal, State & Local Total $2,409.7 $2,676.5 $3,368.7 $8,454.9
Source: Calculations using the IMPLAN Modeling system (2019 database).
Note: Details may not add to totals due to rounding.
B. State Impacts
State-level IMPLAN models were used to estimate the U.S. private shipbuilding and repairing
industry’s state-by-state impacts. The study also estimates interstate spillover effects (i.e., indirect
and induced impacts in a given state resulting from direct shipbuilding and repair activities in another
state).
The U.S. private shipbuilding and repairing industry directly provided employment in 42 states in
2019. The five states with the largest direct employment impacts are Virginia, Connecticut,
Mississippi, California, and Louisiana (see Table 8, below). Operations in these states represented
approximately 64 percent of total industry operations in 2019.
18
This information has been prepared solely for the use and benefit of MARAD and is not intended for reliance by any other person.Table 8: Direct Impact of the U.S. Private Shipbuilding and Repairing Industry, by State, 2019
Direct Employment a Direct Labor Income b Direct GDP
State % of U.S. % of U.S. % of U.S.
Jobs ($ millions) ($ millions)
Total Total Total
Alabama 4,290 4.0% $368 3.7% $453 3.7%
Alaska 420 0.4% $28 0.3% $29 0.2%
Arizona 120 0.1% $9 0.1% $10 0.1%
Arkansas 40 0.0% $3 0.0% $4 0.0%
California 8,490 7.9% $748 7.5% $906 7.4%
Colorado * 0.0% $1 0.0% $0 0.0%
Connecticut 11,820 11.0% $1,347 13.5% $1,467 12.0%
Delaware 10 0.0% $1 0.0% $1 0.0%
District of Columbia - - - - - -
Florida 4,700 4.4% $345 3.5% $383 3.1%
Georgia 140 0.1% $13 0.1% $14 0.1%
Hawaii 1,110 1.0% $92 0.9% $111 0.9%
Idaho 70 0.1% $3 0.0% $4 0.0%
Illinois 440 0.4% $27 0.3% $31 0.3%
Indiana 1,720 1.6% $156 1.6% $204 1.7%
Iowa 10 0.0% $0 0.0% $0 0.0%
Kansas - - - - - -
Kentucky 470 0.4% $39 0.4% $45 0.4%
Louisiana 6,620 6.2% $541 5.4% $691 5.7%
Maine 5,700 5.3% $465 4.7% $554 4.5%
Maryland 560 0.5% $45 0.5% $61 0.5%
Massachusetts 310 0.3% $22 0.2% $23 0.2%
Michigan 70 0.1% $5 0.1% $6 0.0%
Minnesota 30 0.0% $2 0.0% $3 0.0%
Mississippi 11,190 10.4% $953 9.6% $1,143 9.4%
Missouri 1,410 1.3% $79 0.8% $77 0.6%
Montana - - - - - -
Nebraska - - - - - -
Nevada - - - - - -
New Hampshire 40 0.0% $3 0.0% $3 0.0%
New Jersey 1,620 1.5% $123 1.2% $139 1.1%
New Mexico - - - - - -
New York 970 0.9% $136 1.4% $145 1.2%
North Carolina 60 0.1% $3 0.0% $6 0.0%
North Dakota - - - - - -
Ohio 530 0.5% $46 0.5% $53 0.4%
Oklahoma 40 0.0% $2 0.0% $3 0.0%
Oregon 1,540 1.4% $175 1.8% $182 1.5%
Pennsylvania 750 0.7% $67 0.7% $73 0.6%
Rhode Island 2,580 2.4% $233 2.3% $425 3.5%
South Carolina 490 0.5% $47 0.5% $51 0.4%
South Dakota - - - - - -
Tennessee 210 0.2% $20 0.2% $22 0.2%
Texas 3,400 3.2% $280 2.8% $336 2.8%
Utah 240 0.2% $17 0.2% $21 0.2%
Vermont - - - - - -
Virginia 30,270 28.2% $3,101 31.2% $3,981 32.7%
Washington 2,530 2.4% $237 2.4% $299 2.5%
West Virginia 50 0.0% $5 0.1% $6 0.0%
Wisconsin 2,140 2.0% $156 1.6% $222 1.8%
Wyoming * 0.0% $0 0.0% $0 0.0%
U.S. Total 107,180 100% $9,943 100% $12,186 100%
Source: Calculations using the IMPLAN modeling system (2019 database).
Note: Details may not add to totals due to rounding.
* Indicates less than 5 jobs.
a
Employment is defined as the number of payroll and self-employed jobs, including part-time jobs.
b
Labor income is defined as wages and salaries and benefits as well as proprietors’ income.
19
This information has been prepared solely for the use and benefit of MARAD and is not intended for reliance by any other person.In five states the total (direct, indirect, and induced) economic activity attributable to the shipbuilding
and repairing industry is 1 percent or more of total state employment (see Figure 9).
Figure 9: Private Shipbuilding and Repairing Industry’s Total Employment Impact as a
Percent of Total State Employment: Top Ten States, 2019
2.0%
1.6%
1.5%
1.5% 1.3%
1.2%
1.0%
1.0%
0.6%
0.5% 0.4%
0.3%
0.2% 0.2%
0.0%
Source: Calculations using the IMPLAN modeling system (2019 database).
In terms of the total number of direct, indirect, and induced jobs, employment associated with the
operations of the U.S. private shipbuilding and repairing industry is highest in Virginia, California,
Mississippi, Louisiana, Texas, Connecticut, and Florida (see Figure 10 and Table 9, below).
Additional detail is provided in Appendix A.
Figure 10: Total (Direct, Indirect, and Induced) Employment Impact Attributable to the U.S.
Private Shipbuilding and Repairing Industry: Top Ten States, 2019
80,000
71,710
70,000
60,000
Number of Jobs
50,000
37,880
40,000
28,310
30,000 24,910
21,530 21,380
20,000 16,780
13,860 11,510 11,370
10,000
0
Source: Calculations using the IMPLAN modeling system (2019 database).
20
This information has been prepared solely for the use and benefit of MARAD and is not intended for reliance by any other person.Table 9: Total (Direct, Indirect, and Induced) Economic Activities Attributable to the U.S.
Private Shipbuilding and Repairing Industry, 2019
Total Employment a Total Labor Income b Total GDP
State % of U.S. % of U.S. % of U.S.
Jobs ($ millions) ($ millions)
Total Total Total
Alabama 11,510 2.9% $716 2.5% $1,038 2.4%
Alaska 1,000 0.3% $63 0.2% $93 0.2%
Arizona 3,110 0.8% $192 0.7% $314 0.7%
Arkansas 1,400 0.4% $75 0.3% $128 0.3%
California 37,880 9.6% $2,999 10.7% $4,650 11.0%
Colorado 2,690 0.7% $186 0.7% $293 0.7%
Connecticut 28,310 7.2% $2,539 9.0% $3,421 8.1%
Delaware 420 0.1% $29 0.1% $60 0.1%
District of Columbia 550 0.1% $62 0.2% $84 0.2%
Florida 21,380 5.4% $1,238 4.4% $1,881 4.4%
Georgia 5,060 1.3% $316 1.1% $547 1.3%
Hawaii 2,850 0.7% $188 0.7% $278 0.7%
Idaho 870 0.2% $46 0.2% $73 0.2%
Illinois 7,310 1.9% $530 1.9% $870 2.1%
Indiana 7,570 1.9% $500 1.8% $792 1.9%
Iowa 1,730 0.4% $110 0.4% $191 0.5%
Kansas 1,400 0.4% $84 0.3% $141 0.3%
Kentucky 2,950 0.7% $177 0.6% $273 0.6%
Louisiana 16,780 4.3% $1,043 3.7% $1,546 3.6%
Maine 13,860 3.5% $871 3.1% $1,214 2.9%
Maryland 3,670 0.9% $264 0.9% $424 1.0%
Massachusetts 4,140 1.1% $347 1.2% $525 1.2%
Michigan 4,800 1.2% $317 1.1% $492 1.2%
Minnesota 3,000 0.8% $210 0.7% $333 0.8%
Mississippi 24,910 6.3% $1,491 5.3% $2,081 4.9%
Missouri 6,030 1.5% $347 1.2% $505 1.2%
Montana 450 0.1% $22 0.1% $38 0.1%
Nebraska 980 0.2% $62 0.2% $108 0.3%
Nevada 1,440 0.4% $81 0.3% $143 0.3%
New Hampshire 810 0.2% $61 0.2% $91 0.2%
New Jersey 7,640 1.9% $589 2.1% $864 2.0%
New Mexico 680 0.2% $33 0.1% $64 0.2%
New York 11,370 2.9% $1,072 3.8% $1,718 4.1%
North Carolina 4,580 1.2% $277 1.0% $490 1.2%
North Dakota 390 0.1% $24 0.1% $43 0.1%
Ohio 6,990 1.8% $458 1.6% $746 1.8%
Oklahoma 1,740 0.4% $103 0.4% $161 0.4%
Oregon 5,970 1.5% $443 1.6% $627 1.5%
Pennsylvania 7,870 2.0% $573 2.0% $860 2.0%
Rhode Island 6,440 1.6% $450 1.6% $789 1.9%
South Carolina 3,350 0.9% $200 0.7% $310 0.7%
South Dakota 440 0.1% $25 0.1% $45 0.1%
Tennessee 3,780 1.0% $244 0.9% $374 0.9%
Texas 21,530 5.5% $1,477 5.3% $2,305 5.4%
Utah 2,080 0.5% $121 0.4% $202 0.5%
Vermont 310 0.1% $17 0.1% $26 0.1%
Virginia 71,710 18.2% $5,553 19.8% $8,150 19.2%
Washington 8,560 2.2% $683 2.4% $1,067 2.5%
West Virginia 740 0.2% $44 0.2% $73 0.2%
Wisconsin 8,140 2.1% $509 1.8% $800 1.9%
Wyoming 260 0.1% $16 0.1% $31 0.1%
U.S. Total 393,390 100.0% $28,078 100.0% $42,370 100.0%
Source: Calculations using the IMPLAN modeling system (2019 database).
Note: Details may not add to totals due to rounding.
a
Employment is defined as the number of payroll and self-employed jobs, including part-time jobs.
b
Labor income is defined as wages and salaries and benefits as well as proprietors’ income.
21
This information has been prepared solely for the use and benefit of MARAD and is not intended for reliance by any other person.Appendices
Appendix A: Economic Impact Breakdown: State-Level Detail
Tables A1, A2, and A3 provide the state-by-state breakout of the direct, indirect, and induced impacts
attributable to the U.S. private shipbuilding and repairing industry.
22
This information has been prepared solely for the use and benefit of MARAD and is not intended for reliance by any other person.Table A1: Employment Attributable to the U.S. Private Shipbuilding and Repairing Industry,
2019
Direct Indirect Induced Total Total State
State Contribution Contribution Contribution Contribution Percentage
Alabama 4,290 3,440 3,780 11,510 0.4%
Alaska 420 240 340 1,000 0.2%
Arizona 120 1,170 1,820 3,110 0.1%
Arkansas 40 590 770 1,400 0.1%
California 8,490 12,270 17,120 37,880 0.2%
Colorado * 1,020 1,660 2,690 0.1%
Connecticut 11,820 6,520 9,960 28,310 1.2%
Delaware 10 140 270 420 0.1%
District of Columbia - 170 380 550 0.1%
Florida 4,700 7,070 9,610 21,380 0.2%
Georgia 140 2,020 2,900 5,060 0.1%
Hawaii 1,110 690 1,050 2,850 0.3%
Idaho 70 310 500 870 0.1%
Illinois 440 2,940 3,930 7,310 0.1%
Indiana 1,720 2,660 3,190 7,570 0.2%
Iowa 10 780 940 1,730 0.1%
Kansas - 570 830 1,400 0.1%
Kentucky 470 1,080 1,410 2,950 0.1%
Louisiana 6,620 4,620 5,530 16,780 0.6%
Maine 5,700 3,480 4,680 13,860 1.6%
Maryland 560 1,210 1,900 3,670 0.1%
Massachusetts 310 1,430 2,390 4,140 0.1%
Michigan 70 2,190 2,540 4,800 0.1%
Minnesota 30 1,220 1,740 3,000 0.1%
Mississippi 11,190 6,750 6,970 24,910 1.5%
Missouri 1,410 2,010 2,610 6,030 0.2%
Montana - 150 300 450 0.1%
Nebraska - 370 610 980 0.1%
Nevada - 540 900 1,440 0.1%
New Hampshire 40 360 410 810 0.1%
New Jersey 1,620 2,430 3,590 7,640 0.1%
New Mexico - 220 460 680 0.1%
New York 970 3,650 6,750 11,370 0.1%
North Carolina 60 1,860 2,660 4,580 0.1%
North Dakota - 150 240 390 0.1%
Ohio 530 2,910 3,550 6,990 0.1%
Oklahoma 40 710 990 1,740 0.1%
Oregon 1,540 1,780 2,650 5,970 0.2%
Pennsylvania 750 2,920 4,210 7,870 0.1%
Rhode Island 2,580 1,640 2,220 6,440 1.0%
South Carolina 490 1,280 1,580 3,350 0.1%
South Dakota - 160 280 440 0.1%
Tennessee 210 1,520 2,050 3,780 0.1%
Texas 3,400 7,710 10,410 21,530 0.1%
Utah 240 760 1,070 2,080 0.1%
Vermont - 110 200 310 0.1%
Virginia 30,270 17,970 23,470 71,710 1.3%
Washington 2,530 2,470 3,560 8,560 0.2%
West Virginia 50 280 410 740 0.1%
Wisconsin 2,140 2,860 3,140 8,140 0.2%
Wyoming * 100 160 260 0.1%
U.S. Total 107,180 121,480 164,730 393,390 0.2%
Source: Calculations using the IMPLAN modeling system (2019 database).
Note: Details may not add to totals due to rounding.
* Less than five jobs.
Employment is defined as the number of payroll and self-employed jobs, including part-time jobs.
23
This information has been prepared solely for the use and benefit of MARAD and is not intended for reliance by any other person.Table A2: Labor Income Attributable to the U.S. Private Shipbuilding and Repairing Industry,
2019
Direct Indirect Induced Total
Total State
State Contribution Contribution Contribution Contribution
Percentage
($ millions) ($ millions) ($ millions) ($ millions)
Alabama $368 $184 $164 $716 0.4%
Alaska $28 $16 $19 $63 0.2%
Arizona $9 $85 $98 $192 0.1%
Arkansas $3 $37 $36 $75 0.1%
California $748 $1,091 $1,160 $2,999 0.2%
Colorado $1 $87 $98 $186 0.1%
Connecticut $1,347 $552 $640 $2,539 1.2%
Delaware $1 $11 $17 $29 0.1%
District of Columbia - $23 $40 $62 0.1%
Florida $345 $427 $466 $1,238 0.2%
Georgia $13 $142 $161 $316 0.1%
Hawaii $92 $40 $56 $188 0.3%
Idaho $3 $19 $23 $46 0.1%
Illinois $27 $248 $256 $530 0.1%
Indiana $156 $178 $167 $500 0.2%
Iowa * $60 $49 $110 0.1%
Kansas - $40 $44 $84 0.1%
Kentucky $39 $70 $69 $177 0.1%
Louisiana $541 $260 $242 $1,043 0.6%
Maine $465 $190 $215 $871 1.6%
Maryland $45 $102 $117 $264 0.1%
Massachusetts $22 $147 $179 $347 0.1%
Michigan $5 $170 $141 $317 0.1%
Minnesota $2 $101 $107 $210 0.1%
Mississippi $953 $276 $262 $1,491 1.5%
Missouri $79 $135 $133 $347 0.2%
Montana - $9 $13 $22 0.1%
Nebraska - $27 $35 $62 0.1%
Nevada - $35 $46 $81 0.1%
New Hampshire $3 $32 $26 $61 0.1%
New Jersey $123 $220 $246 $589 0.1%
New Mexico - $13 $20 $33 0.1%
New York $136 $386 $550 $1,072 0.1%
North Carolina $3 $131 $143 $277 0.1%
North Dakota - $11 $13 $24 0.1%
Ohio $46 $218 $194 $458 0.1%
Oklahoma $2 $51 $50 $103 0.1%
Oregon $175 $129 $140 $443 0.2%
Pennsylvania $67 $240 $266 $573 0.1%
Rhode Island $233 $104 $113 $450 1.0%
South Carolina $47 $80 $73 $200 0.1%
South Dakota - $11 $15 $25 0.1%
Tennessee $20 $105 $118 $244 0.1%
Texas $280 $599 $597 $1,477 0.1%
Utah $17 $50 $54 $121 0.1%
Vermont - $7 $10 $17 0.1%
Virginia $3,101 $1,266 $1,185 $5,553 1.3%
Washington $237 $206 $240 $683 0.2%
West Virginia $5 $19 $20 $44 0.1%
Wisconsin $156 $192 $162 $509 0.2%
Wyoming * $8 $8 $16 0.1%
U.S. Total $9,943 $8,839 $9,297 $28,078 0.2%
Source: Calculations using the IMPLAN modeling system (2019 database).
Note: Details may not add to totals due to rounding.
* Less than $0.5 million.
Labor income is defined as wages and salaries and benefits as well as proprietors’ income.
24
This information has been prepared solely for the use and benefit of MARAD and is not intended for reliance by any other person.You can also read