Thwarting the Second Wave: Rapid Vaccination should be the primary tool and not Lockdown - State Bank of India - SBI

 
CONTINUE READING
Thwarting the Second Wave: Rapid Vaccination should be the primary tool and not Lockdown - State Bank of India - SBI
Thwarting the Second Wave: Rapid Vaccination
 should be the primary tool and not Lockdown

               State Bank of India
                   23 April 2021
Thwarting the Second Wave: Rapid Vaccination should be the primary tool and not Lockdown - State Bank of India - SBI
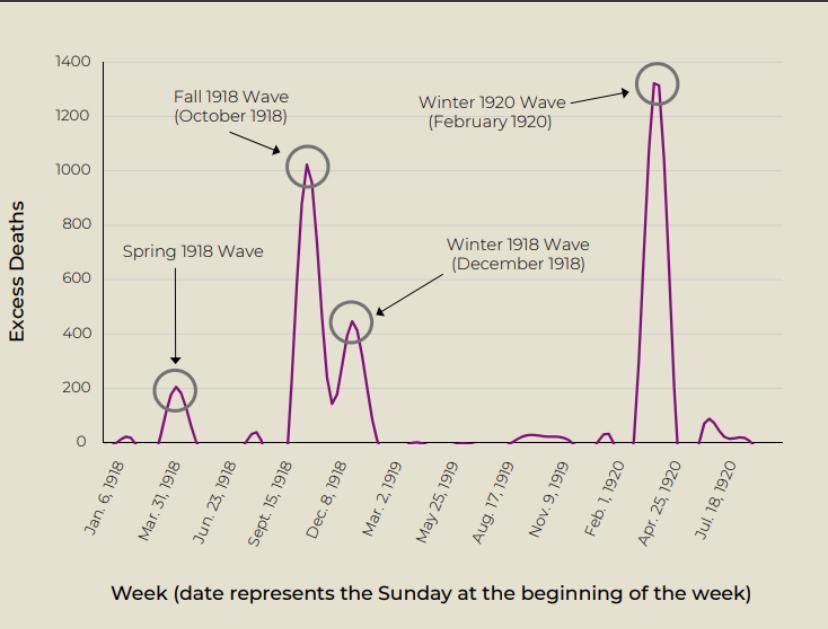
“Let all of us take a collective pledge
today of insulating our country from
    COVID-19 through large scale
              vaccination:
  Its imperative for us to avert any
             further wave”

               State Bank of India   2
Real GDP revised downwards from 11% to 10.4% in FY22

 ❑   Current SBI FY22 projection at 11%              Probable Monetary Impact of Current Lockdowns in Various States

     real GDP (RBI: 10.5%) and 15%                            FY22 Nominal
                                                                                                                       Probable Impact
                                           States             GSDP (Rs lakh   Type of Restrictions
                                                                                                                          (Rs crore)
     nominal   GDP     growth (Union                             crore)
                                           Bihar                   7.6        Night Curfew/Partial Lockdown                 6222
     Budget: 14.4%) for FY22 on the
                                           Chhattisgarh            3.8        Lockdown in 20 districts till 26 April        7347
     back of low base effect and
                                           Gujarat                18.8        Night Curfew                                   -
     renewed economic momentum             Haryana                8.9         Night Curfew                                   -
                                           Jharkhand              3.6         Lockdown for 8 days                          2768
 ❑   However,       given  the   current
                                           Karnataka              17.0        Night Curfew                                   -
     circumstances                    of   Kerala                 8.8         Night Curfew                                   -
     partial/local/weekend lockdowns in    Madhya Pradesh         11.3        Lockdown in 15 districts                     21712
                                           Maharashtra            29.8        Lockdown till 30 April                       81672
     almost all states, our growth
                                           Odisha                  5.9        Weekend lockdown in Urban areas               1927
     forecast is now revised downwards     Punjab                  6.1        Night Curfew/Partial Lockdown                 4994
 ❑   Revised SBI FY22 projection now       Rajasthan               12.0       Lockdown till 03 May                         17237
                                           Telangana               11.5       Night Curfew                                    -
     at 10.4% real GDP and 14.3%           Uttar Pradesh           21.7       Night Curfew                                    -
     nominal GDP                           West Bengal             15.1       No Restrictions                                 -
                                           Himachal Pradesh        1.7        No Restrictions                                 -
 ❑   Total loss estimated at Rs 1.5 lakh   Uttarakhand             2.8        Weekend lockdown in 12 districts               914
     crores, of which Maharashtra,         Delhi                   9.0        Lockdown for 6 days                           5178
                                           India                  222.9       -                                           1,49,970
     Madhya Pradesh and Rajasthan
                                           Source: SBI Research
     account for 80%. Maharashtra
     alone at 54%

                                       State Bank of India                                                                         3
Impact of Maharashtra Lockdown & Reverse Migration of Labour

 ❑   Maharashtra has put up a stringent lockdown among all states. Being the economically
     biggest and most industrialised state in India, this lockdown will have huge impact on growth
 ❑   Currently we estimate loss of around Rs 82,000 crore for Maharashtra which will definitely
     increase if restrictions are further tightened
 ❑   Given that R(0) is quite low for Maharashtra, it may be pertinent to ask that how much
     lockdown will slowdown the speed of infections, but for beefing up health infrastructure
 ❑   Migration of labour is continuing unabated. According to the data provided by Western
     Railways (for the period of 01-12 April), almost 4.32 lakh people have returned to the states
     like UP, WB, Bihar, Assam and Odisha from Maharashtra. Of 4.32 lakh, around 3.23 lakh
     reverse migrated to UP and Bihar alone. From Central Railways our estimate indicates that
     around 4.7 lakh reverse migrated to northern and eastern states from Maharashtra
                 Maharashtra’s Share in                       Migration of Labour from Maharashtra (1-12 April)
India’s GDP                               13.9%
                                                                                       Western Railway        Central Railway
Number of workers                         10.3%
Industrial projects approved              17.9%                                              Actual                  Estimate
Electricity consumption                   12.9%     Total trains*                              196                     336
Vehicles sold                              10%          of which, only UP & Bihar              150                       -
Electronic and Home Appliances sales      18-20%
                                                    Total Passengers                       4.32 lakh                 4.70 lakh
Smartphones                                10%
Deposits                                  19.7%         of which, only UP & Bihar          3.23 lakh                     -
Credit                                    26.1%     Source: SBI Res ea rch; * to UP, WB, Biha r, As s a m, Odis ha

                                                   State Bank of India                                                           4
SBI Business Activity Index is now at 5 month low in Apr’21:Supply side disruptions
evident with low arrival of Vegetables at Mandis
                                                                                                     Leading Indicators MoM%
 ❑       Various indicators show improvement in economic                               Indicators                 Dec-20   Jan-21   Feb-21   Mar-21
         activity in Mar’21                                        Google Mobility Index #
                                                                                          Retail and Recreation     -1       3        2        1
 ❑       However, SBI        business activity index shows                               Grocery and Pharmacy       0        -6       13       4

         decline in activity in Apr’21 with the latest reading                                  Transit stations    9
                                                                                                                    16
                                                                                                                            -10
                                                                                                                            -32
                                                                                                                                      15
                                                                                                                                      39
                                                                                                                                               -1
                                                                                                                                               -5
                                                                                                    Workplaces
         for the week ended 19 Apr’21 of 86.3. This is the                                          Residential     0        5        -9       2

         lowest in 5 months (16 Nov’21 when the value              Apple Mobility Index#
                                                                   PMI Manufacturing#
                                                                                                                    8
                                                                                                                    0
                                                                                                                             29
                                                                                                                             1
                                                                                                                                      -8
                                                                                                                                      0
                                                                                                                                              -36
                                                                                                                                               -2
         declined to 85.7)                                         PMI Service#                                     -1       1        3        -1
                                                                   SBI Yearly Index#                                0        0        1        1
 ❑       All the indicators have shown a dip with maximum          SBI Monthly Index#                               -3       0        -5       -3
         decline in Apple mobility, weekly food arrival at         AQI (7 City Average)                            15.4     1.0     -10.6     -13.0
                                                                   No of Transactions at RTO                        0.4     -0.8     -1.4     11.1
         Mandis and RTO revenue collection                         Revenue Collections at RTO                      -12.5    9.0      -2.3     26.3
                                                                   No of GST E way Bills Generated                 11.2     -2.1     1.5      11.6

                         Business Activity Index                                                                    7.4     3.9      -5.1     18.2
                                                                   Electricity Demand

 110.0                                                             Revenue Earning Freight Traffic of Major        10.5     0.3     -10.5     21.7
                                                                   Commoditie(Rs Cr)
 100.0
                                                                   Port Cargo Traffic                               6.7     1.5      -9.2     23.1
  90.0                                                             Tractor Sale Domestic                           -25.6    27.9     -3.4     12.5
                                                            86.3   Domestic Passenger Vehicle Sale                 -4.5     9.3      1.7      3.4
  80.0
                                                                   Domestic Two Wheelers Sale                      -29.5    26.8     -0.2     4.9
  70.0                                                             Fertilizer Retail                               12.5    -18.1    -24.4     -9.7
  60.0                                                             Weekly Food arrival in Tonnes-Average
                                                                                                        Cereals    -5.5     5.3      9.7      88.4
  50.0
                                                                                                         Pulses    60.7    168.3     39.7     -53.4
  40.0                                                                                                    Fruits   -18.2   -17.9     13.7     23.9
         11-05-2020

         12-10-2020

         01-03-2021
         15-03-2021
         17-02-2020
         02-03-2020
         16-03-2020
         30-03-2020
         13-04-2020
         27-04-2020

         25-05-2020
         08-06-2020
         22-06-2020
         06-07-2020
         20-07-2020
         03-08-2020
         17-08-2020
         31-08-2020
         14-09-2020
         28-09-2020

         26-10-2020
         09-11-2020
         23-11-2020
         07-12-2020
         21-12-2020
         04-01-2021
         18-01-2021
         01-02-2021
         15-02-2021

         29-03-2021
         12-04-2021

                                                                                                     Vegetables    21.9     13.5     9.7      2.7
                                                                   Petrol Consumption                               1.5     -3.5     -5.7     11.2
                                                                   Diesel Consumption                               2.0     -5.2     -3.7     10.1
                                                                   Source: SBI Research, #Difference

                                                   State Bank of India                                                                                5
Banking Deposits have probably surged in April with people having
no option to spend
❑   The banking sector has been affected with the tepid
    demand for credit in the H1FY21. However,
    thereafter credit offtake improved in H2, with the
    momentum picking up beginning October and
    registering a growth since November
❑   ASCBs credit growth has declined to a 59-year low of
    5.6% in 2020-21, compared to 6.1% growth in 2019-
    20. On the other hand, deposits have increased to
    11.4% in FY21, compared to 7.9% growth in FY20
❑   In FY21 Apr-May, huge monthly incremental increase
    in deposits was observed (particularly time deposits)
    as people had less options to spend due to nation-
    wide lockdown. This time also we expect large
    traction in time deposits as most of the states
    imposed partial lockdowns
                                           Deposits and Advances - Monthly Variation (Rs Bn)
             Products                                Apr-20    Dec-20      Jan-21      Feb-21   Mar-21   Apr-21 (P)
             Aggregate deposits                      1471       1350        797        1358      1796      1743
                    of which, Demand Deposits        -1408      1065         87        1243      1581      1316
                                 Time Deposits       2879       285         710         116       215       427
             Bank Credit                              -330      1986         83         702      1768      -755
             Source: SBI Res earch; P: SBI Projections

                                                   State Bank of India                                                6
Corporates results - Early trend suggests better numbers for Q4FY21

❑   Early trend of around 45 listed
                                                                 Growth in Key parameters Q4FY21 vis-à-vis Q4FY20
    entities suggests 10% growth in                                                                         Employee
                                                             Description                         Net Sales                               EBIDTA        PAT
    top line for listed entities while                                                                      Expenses
                                         Companies with turnover less than Rs 100 crore            6%         -10%                       NTP      Negative
    EBIDTA and PAT too grew by           Companies with turnover of > Rs 100 cr and < Rs 500 cr    41%         9%                        829%      1217%
    16% and 26% in Q4FY21 as             Companies with turnover of > Rs 500 cr and < Rs 1000 cr   34%        -11%                       90%        123%
                                         Companies with turnover above Rs 1000 crore               10%         5%                        14%        23%
    compared to Q4FY20                                                                  Overall    10%         5%                        16%        26%
                                         Source: Cline; listed entities; SBI Research; NTP - negative to positive
❑   Entities with less than Rs 100
    crore reported 6% growth in net                     6.00
                                                                                 Declining Weighted Average Yield of CP
    sales and negative PAT despite                      5.50         5.39
                                                                            5.23
    cut in employee expenses by
                                                        5.00
    10%                                                                            4.47
                                                        4.50
                                                                                                                                         4.35
❑   In Commercial paper market                                                                        4.26                 4.14
                                                        4.00                              3.99
    yield continue to be below 4%                                                                            3.77                 3.82
                                                                                                                                                3.71
                                                                                                                    3.62
                                                        3.50
    and decreased to 3.71% in
                                                        3.00
    Apr’21 against 4.35% in Mar’21

                                                                                                  Effective WAY

                                                 State Bank of India                                                                                    7
Summary                   …. 1/3

VACCINE UPDATE
❑   Spanish Flu in 1918 shows more deaths in later waves, thus vaccination is must to avoid larger fatalities later
❑   Injection to infection ratio shows that India made rapid improvement this year but it is still below Israel, Chile and UK
❑   Almost 900 million people atleast have received one dose of Covid-19 vaccine world-wide. However, top 15 countries
    accounted for 84% of total vaccination indicating huge unevenness
❑   Only 2.6% of population is fully vaccinated in the world, and in India only 1.2% of population is fully vaccinated till now
❑   Certain States like Rajasthan, Jammu & Kashmir, Haryana, Madhya Pradesh have lower percentage of their population above
    45 years and have already given vaccine shots to larger percentage of population above 45 years. However, Tamil Nadu,
    Punjab, Andhra Pradesh and West Bengal have higher percentage of population above 45 years and have inoculated less
    proportion of those above 45 years
❑   Also, the state-wise performance in case of vaccination is quite uneven. Our “Vaccine Hesitancy Index” calculated as doses
    administered per 100 available shows that all N-E states and in states like Goa, Jharkhand, Assam, Delhi, Uttarakhand,
    Chhattisgarh there is a vaccine hesitancy
❑   Serum institute is expected to increase its production capacity to 110 mn doses per month by Jul’21, Bharat Biotech is expected
    to increase its production capacity to 12 mn doses per month by Jul’21. Also, Sputnik vaccine will be imported from May
    onwards. Taking these into account we believe a total of 1132 million doses can be given by Dec’21 in which 15% of the
    population can be fully vaccinated and 84% can get their first shot
❑   Experience of other countries show infections stabilise after 15% of population receive second dose
❑   Now that states are free to buy vaccine from manufacturers from 1 May, our estimate for 13 states shows that the cost of
    vaccine to inoculate is almost 15-20% of states’ health expenditure budget (assuming half of the population in these states will
    get vaccinated by Central Government), still it will be only 0.1% of GDP. This is significantly lower than the economic loss in
    GDP due to lockdown which is already at 0.7% of GDP
IMPACT ON GDP
❑   Given the current circumstances of partial/local/weekend lockdowns in almost all states, SBI growth forecast is revised
    downwards. Revised SBI FY22 projection now at 10.4% real GDP and 14.3% nominal GDP

                                                     State Bank of India                                                          8
Summary                …. 2/3

COVID UPDATE
❑   Recovery rate across countries continues to improve in different peaks. But in India recovery rate increased to
    97.3 till mid-Feb’21 but it has started declining thereafter and moved to 85 recently. Based on our model if we
    consider second wave peak is reached when recovery rate is around 78%-79%, then the peak could be further
    away in May
❑   Our model suggests that the estimated peak time is 96 days from 15-Feb, indicating the peak happening in the
    3rd week of May. It may ne noted that we are incrementally adding around 15000 more cases over peak of
    previous day as of today, though such numbers are difficult to predict
❑   UP and Maharashtra achieved peak before national peak in first wave. Now new cases in Maharashtra seems
    to be stabilising but share of cases in total of various other states (Chhattisgarh, MP, Gujarat) has increased in
    the current second wave and these are showing increase in daily new cases. So, if other states also
    implement strict actions and control the spread, then national peak may come within 2 weeks after
    Maharashtra peak
❑   Our statistical model indicates that India did remarkably well in containing COVID first wave, but as like in most
    other countries that faced unprecedented 2nd waves might have managed the 2nd wave better. States
    Contribution to the India’s Estimated surge (as per our model) 31 Lakh cases after Jan’21, Maharashtra alone
    contributed 52% and 5 states contributed 75%
❑   7-days moving average of fatality rate in the current second wave is higher than fatality rate at the time of first
    wave peak in case of Chhattisgarh, HP, Uttarakhand and Odisha
❑   In the current second wave, Maharashtra, Goa, Chhattisgarh, Delhi, Haryana are simultaneously having test
    positivity and high number of infections
❑   In the current second wave, Mobility & Cases both increased in UP & Karnataka in April, but conversely
    Mobility declined & and Cases increased in Chhattisgarh, Delhi and Maharashtra

                                               State Bank of India                                                 9
Summary                  …. 3/3
District wise
❑   Share of top 15 districts in new cases have declined; but rural penetration has increased. Amongst the top 15 districts worst
    affected (mostly urban and only 2 are rural), 6 are from Maharashtra. Overall, these districts contribute around 25% to the
    National GDP. If we look at the rural districts worst affected, 9 are from Maharashtra followed by 3 from Chhattisgarh. These
    account for around 3.3% of the National GDP
❑   Also, if we see various districts where congregation was held (Kumbh, Election bound states and farmer protests) recently, have
    seen uptick in daily new cases in April, though of smaller magnitude
ECONOMIC INDICATORS
❑   SBI business activity index shows decline in activity in Apr’21 with the latest reading for the week ended 19 Apr’21 of 86.3. This
    is the lowest in 5 months (16 Nov’21 when the value declined to 85.7). All the indicators have shown a dip with maximum
    decline in Apple mobility, weekly food arrival at Mandis and RTO revenue collection
❑   ASCBs credit has declined to a 59-year low of 5.6% in 2020-21, compared to 6.1% growth in 2019-20. On the other hand,
    deposits have increased to 11.4% in FY21, compared to 7.9% growth in FY20
❑   In FY21 Apr-May, huge monthly incremental increase in deposits was observed (particularly time deposits) as people had less
    options to spend due to nation-wide lockdown. This time also we expect large traction in time deposits as most of the states
    imposed partial lockdowns
❑   Meanwhile, early trend of around 45 listed entities suggests 10% growth in top line for listed entities while EBIDTA and PAT too
    grew by 16% and 26% in Q4FY21 as compared to Q4FY20. Entities with turnover of less than Rs 100 crore reported 6% growth
    in net sales and negative PAT despite cut in employee expenses by 10%
❑   In Commercial Paper market yield continue to be below 4% and decreased to 3.71% in Apr’21 against 4.35% in Mar21
OXYGEN UPDATE
❑   All states should allow ambulance status to tankers so that they move faster, which will certainly help and reduce the transit
    time
❑   Government of India should analyse the oxygen data on a daily basis and direct supply. This is purely a supply chain
    optimization problem.

                                                    State Bank of India                                                        10
Vaccination Update

     State Bank of India   11
Spanish flu (1918): Deaths had increased progressively in later waves

 ❑   Spanish Flu in 1918 had clearly shown more deaths in later waves thus vaccination is must
     to avoid larger fatalities later
 ❑   India must vaccinate its population with the single minded focus to achieve herd immunity
     and avoid any further waves as other countries are facing

                                      State Bank of India                                  12
India: Vaccination is witnessing slowing momentum…..

 ❑   India has been witnessing steep increase in daily cases which has exceeded daily recoveries
     since mid-March
 ❑   The number of beneficiaries vaccinated daily 34.1 lakh on 13 Apr’21 but has much declined
     since then

                                           Infection and Injection (7 Day MA)
              3,09,000                                                                                              36,50,000

              2,59,000                                                                                              31,50,000

                                                                                                                    26,50,000
              2,09,000
                                                                                                                    21,50,000
              1,59,000
                                                                                                                    16,50,000
              1,09,000
                                                                                                                    11,50,000

               59,000                                                                                               6,50,000

                9,000                                                                                               1,50,000

                         Daily new cases   Daily Recoverd cases    Number of Beneficiaries daily Vaccinated (RHS)

                                            State Bank of India                                                                 13
….. Though Injection to Infection ratio shows India made rapid strides

 ❑   Injection to infection ratio shows that India has made improvement this year but it is still
     below Israel, Chile and UK

                                               Global Injection to Infection Ratio
                   14

                   12

                   10

                    8

                    6

                    4

                    2

                    0
                        Brazil   Chile   France Germany   India    Israel   Russia    United United Hungary Serbia
                                                                                     Kingdom States

                                                 Jan-21   Feb-21     Mar-21     20-Apr-21

                                                   State Bank of India                                               14
Initial Vaccine Hesitancy has not helped

 ❑   Though India has vaccinated almost 12.7 crore people, the state-wise performance is quite
     uneven
 ❑   Our “Vaccine Hesitancy Index” calculated as doses administered per 100 available show that
     all N-E states and in states like Goa, Jharkhand, Assam, Delhi, Uttarakhand, Chhattisgarh
     there is a vaccine hesitancy

                                      State Bank of India                                  15
Current Status of Country-wise Vaccination

                                                                   Country-wise Vaccination Status
 ❑   Almost 900 million people at least received
                                                                      Total           Fully          Doses
     one dose of Covid-19 vaccine world-wide        Country      Vaccination (in Vaccinated (% administered
                                                                    Million)     of population) per 100 people

 ❑   Top 15 countries has accounted for 84% of      US                209.4          25.2%           62.6
     total   vaccination    indicating    huge      China             192.1             -            13.4
                                                    India             123.9           1.2%            9.0
     unevenness
                                                    UK                 42.8          14.6%           63.0
                                                    Brazil             33.0           4.0%           15.5
 ❑   Only 2.6% of global population is fully        Germany            22.0           6.6%           26.2
     vaccinated in the world, though some of the    Turkey             20.0           9.2%           23.7
     countries have fully vaccinated more than      France             17.0           6.6%           25.0
     25% of the population                          Indonesia          16.7           2.1%            6.1
                                                    Russia             16.2           4.2%           11.0
                                                    Italy              15.2           7.4%           25.2
 ❑   In India only 1.2% of population is fully      Mexico             14.2           3.0%           11.0
     vaccinated till now                            Chile              13.2          28.4%           68.8
                                                    Spain              12.3           7.1%           26.4
                                                    Israel             10.3          57.5%           119.3
                                                    Top 15            758.2             -              -
                                                    World             904.9           2.6%           11.6
                                                    Source: SBI Res ea rch

                                       State Bank of India                                                  16
Rajasthan, Gujarat, HP, Chhattisgarh have already given
single dose of vaccine to a large %age of population above 45 years

❑   Certain States like Rajasthan, Jammu & Kashmir,                         Age-wise population & vaccine doses
                                                                                         45-59*                           Above 60
    Haryana, Madhya Pradesh though have lower
                                                                              % share of % share of % share of % share of
                                                              State
    percentage of their population above 45 years                               State's  population    Total   population
                                                                              Population vaccinated Population vaccinated
    have already given vaccine shots to larger                                    18.0             31.5            16.2              50.0
                                                      KERALA
    percentage of population above 45 years           TAMIL NADU                  16.0             16.7            13.3              15.2
                                                      HIMACHAL PRADESH            14.5             56.4            12.2              61.8
                                                      WEST BENGAL                 14.1             25.9            11.1              31.3
                                                      PUNJAB                      13.7             27.3            12.3              25.6
❑   Even Himachal Pradesh, Gujarat and Uttarakhand    KARNATAKA                   13.7             34.1            11.1              42.6
    have performed well                               ODISHA                      13.5             33.0            10.8              43.5
                                                      GUJARAT                     13.3             48.4             9.9              56.5
                                                      ANDHRA PRADESH              13.3             26.9            12.0              25.2
                                                      MAHARASHTRA                 13.2             33.3            11.5              35.0
❑   However, Tamil Nadu, Punjab, Andhra Pradesh       DELHI                       12.6             47.8             9.7              45.0
                                                      CHHATTISGARH                12.2             74.8             8.9              62.9
    West Bengal, Haryana and Maharashtra have                                     11.9             46.4             9.7              56.9
                                                      UTTARAKHAND
    higher percentage of population above 45 years    ASSAM                       11.7             17.9             7.9              17.6
                                                      HARYANA                     11.7             37.0             9.5              52.2
    and have inoculated less proportion of those      MADHYA PRADESH              11.4             35.5             8.3              41.9
    above 45 years: These states need to pick up      JHARKHAND                   11.2             26.6             8.4              34.4
                                                      JAMMU & KASHMIR             11.2             48.6             9.1              44.9
    pace                                              RAJASTHAN                   11.0             49.1             8.2              75.8
                                                      UTTAR PRADESH               10.3             18.5             7.9              22.0
                                                      BIHAR                       10.0             17.1             7.7              27.8
                                                      INDIA                       12.4             30.3             9.7              36.4
                                                      *Peopl e va cci na ted i n 45-59 group a l s o i ncl udes s ome frontli ne a nd
                                                      hea l thca re workers i n 40-44 a ge group who ha ve recei ved va cci na tion

                                     State Bank of India                                                                                    17
66% of population to receive first dose by Oct’21: 15% of population would be fully
vaccinated by Dec’21

❑   The Government has now announced people above 18 years are now eligible to take vaccine
    from 1 May’21. This is a good move and certainly will help in combatting the rising infection in
    2nd wave. However, India needs to increase its vaccination production
❑   Serum institute is expected to increase its production capacity to 110 mn doses per month by
    Jul’21, Bharat Biotech is expected to increase its production capacity to 12 mn doses per month
    by Jul’21. Also Sputnik vaccine will be imported from May onwards. Taking these into account
    we believe a total of 1132 million doses can be given by Dec’21 in which 15% of the population
    can be fully vaccinated and 84% can get their first shot
❑   Experience of other countries show infections stabilise after 15% of population receive second
    dose
                                         Vaccine doses required to achieve stabilisation based on production capacity (in Million)
                         Daily    Doses Administered Doses Administered Single Dose             Single Dose      Fully        Fully Vaccinated (as   Production
                        Average      (Per Month)           (Cumulative)       Administered (as % of GDP) Vaccinated             % of Population)      Capacity
          Till 20 Apr      -               -                   127                  110             8%           17.4                 1.3%               -
          Apr             3.2             96                    223                 193             14%           30.1               2.2%               75
          May             3.5             109                   332                 286             21%           45.4               3.4%               85
          Jun             3.7             111                   443                 381             28%           62.0               4.6%               105
          Jul             4.5             140                   582                 501             37%           81.5               6.1%               150
          Aug             4.5             140                   722                 621             46%           101.0              7.5%               150
          Sep             5.0             150                   872                 745             56%           126.4              9.4%               150
          Oct             5.0             155                   1027                878             66%           148.9              11.1%              150
          Nov             5.0             150                   1177               1000             75%           176.5              13.2%              150
          Dec             5.0             155                   1332               1132             84%           199.7              14.9%              150
          Serum 70 mn per month in April and expected to increase to 90 from July, Bharat 5 mn per month in April and expected to increase to 8 by July,
          Sputnik vaccine to be available from May

                                                                  State Bank of India                                                                             18
Herd Immunity and uneven access of vaccine

 ❑   Herd immunity is a community protection that is created when a high percentage of the
     population is vaccinated. It provides a protective barrier, especially also for those who cannot
     be vaccinated. These include vulnerable groups such as babies too young to be vaccinated
     or immune-compromised children
 ❑   Herd immunity threshold for Covid-19 is expected at 60-70% but majority of scientists believe
     that herd immunity may take longer than expected as there is uneven access of vaccine
 ❑   33% of the Covid-19 vaccines administered globally have gone to people in 25 wealthy
     nations that represent 11% of the global population. Countries making up the least-wealthy
     11% have gotten just 1.6% of Covid-19 vaccines administered so far

                                     Herd Immunity                                Vaccine Share %   Population Share%
 Disease          Transmission
                                      Threshold
 Measles              Airborne          92–95%       Most Wealthy 25 countries        33.2%              10.9%
 Pertussis        Airborne droplet      92–94%
 Diphtheria            Saliva           83–86%       Most Wealthy 50 countries        46.2%              16.7%
 Rubella          Airborne droplet      83–86%
 Smallpox         Airborne droplet      80–86%       Least Wealthy 25 countries        1.6%              11.8%
 Polio            Fecal-oral route      80–86%
 Mumps            Airborne droplet      75–86%       Least Wealthy 50 countries       17.0%              41.2%
 SARS             Airborne droplet      50–80%
 Ebola               Bodily fluids      33–60%
 Influenza        Airborne droplet      33–44%
 Covid-19         Airborne/Contact      60–70%
 Source: SBI Research

                                                     State Bank of India                                           19
Vaccine cost to push up States’ Health Expenditure, but it is worth it

 ❑    From 01 May, states are free to buy vaccine from manufacturers
 ❑    As per our estimate for 13 states, the cost of vaccine is almost 15-20% of states’ health
      expenditure budget (assuming half of the population in these states will get vaccinated by
      Central Government)

                                                               Expenditure of Vaccination for States
                          2021-22     Growth (FY22   Va cci na te Va cci na te       18+       Rema i ni ng popul a tion   Expected Va cci ne cos t a s % of
     State                  (BE)      BE/ FY21 RE)   d til l Now by 30 Apr        Popul a tion    to be i njected            Cos t    total Hea l th Exp
                          Rs crore         %           crore           crore         crore               crore             Rs crore             %
     Bi ha r                  13012       16.5           0.6            0.7           7.0                 6.2                2492              19%
     Chha tti s ga rh         5902        -9.5           0.5            0.6           1.8                 1.3                 504              9%
     Guja ra t                11304       0.6            1.1            1.3           4.5                 3.2                1292              11%
     Jha rkha nd              4445        2.5            0.3            0.4           2.3                 2.0                 780              18%
     Ka rna taka              11157       13.3           0.8            1.0           4.6                 3.6                1448              13%
     Kera l a                 8782        10.2           0.6            0.8           2.6                 1.8                 700              8%
     Ma dhya Pra des h        11619       22.7           0.8            0.8           5.1                 4.3                1736              15%
     Ma ha ra s htra          26432       22.1           1.3            1.6           8.5                 6.9                2768              10%
     Odi s ha                 9340        6.4            0.5            0.6           3.1                 2.4                 968              10%
     Ra ja s tha n            16269       21.5           1.2            1.4           4.9                 3.5                1380              8%
     Utta r Pra des h         32009       55.5           1.1            1.3           13.9                12.6               5036              16%
     Wes t Benga l            12756       0.2            0.9            1.2           6.9                 5.8                2312              18%
     Utta ra kha nd           3189        49.9           0.2            0.2           0.7                 0.5                209.6             7%
     Total of 13 States   166216          6.5            9.9            11.8          65.9                54.1              21626              13%
     Source: SBI Res ea rch

                                                               State Bank of India                                                                     20
Ideal vaccine strategy India can adopt

 ❑   The latest vaccine strategy divides the population into two buckets: 18- 44 and
     45 & above
 ❑   Public immunisation will be confined to second bucket but is liberalised for all
     from 1-May
 ❑   The rapid immunisation will require augmenting production capacity
      •   Current strategy incentivise production and FDI

 ❑   Present strategy excludes young, pregnant women and lactating mothers

 ❑   Adopting a cluster based approach for immunisation is advisable in initial stages

 ❑   Giving priority to vaccine that offers protection against multiple strain is
     advisable

 ❑   Good opportunity to incentivise local production of vaccine intermediate inputs /
     API under Production Linked Incentive Scheme

                                      State Bank of India                               21
COVID-19 Update

    State Bank of India   22
India handled COVID19 in first wave remarkably well with states with poor health infrastructure
coming out on top :Second Wave, as globally, India also could have done better, but ….

 ❑   To see statistically the state-wise infections, we tested a two
     stage least square (2-SLS) panel model with 20-major
     states considering the monthly data from April 2020 to April
     2021. First, we regressed the state-wise test data on
     population to gauge the exact number of tests that should
     have been done given the population difference across
     states. Then the cases were regressed on such estimated
     test numbers arrived from equation 1
               T = α + βP µ …..(1)
               C = σ + ρT + £ …..(2)
        Where, T = Number of Test, P= Population, C =
        Confirmed Cases
 ❑   Both the estimated models are significant at 5% level and
     results indicate that for India the estimated confirmed cases
     number is 1.2 crore which is in fact 30 lakh lower than the
     actual confirmed cases of 1.5 crore. However, as of end-
     Jan’21, the estimated cases were just 81,620 more . In 2 ½
     months, it has increased by 31 lakh new cases.
     Maharashtra has alone contributed 51% of the rise in
     numbers, followed by Chhattisgarh, Kerala, MP etc.
 ❑   Meanwhile, Uttar Pradesh, Bihar, Gujarat, Odisha and
     Jharkhand among others have managed the situation quite
     well with estimated model cases more than actual cases

                                                  State Bank of India                             23
States Contribution to the India’s Estimated surge (as per our model) 31 Lakh cases
after Jan’21, Maharashtra alone contributed 52% and 5 states contribute 75%

                                                State's Share (%) in India's Surge after Jan'2021
       60.0
                                                                                                                                                                                    51.8
       50.0

       40.0

       30.0

       20.0
                                                7.4                                                                                                       6.3 5.3
       10.0                                                                                                                                                                                                                                                   3.9
        0.0

       -10.0

       -20.0

       -30.0

                                                                                                                                                                   Madhya Pradesh

                                                                                                                                                                                                   Odisha

                                                                                                                                                                                                                                 Tamil Nadu
                                                                                                                                              Karnataka

                                                                                                                                                          Kerala

                                                                                                                                                                                     Maharashtra
               Andhra Pradesh

                                                                       Gujarat

                                                                                                              Jammu and Kashmir
                                Assam

                                                               Delhi
                                                Chhattisgarh

                                                                                 Haryana

                                                                                           Himachal Pradesh

                                                                                                                                                                                                                                                                            Rest
                                        Bihar

                                                                                                                                  Jharkhand

                                                                                                                                                                                                                     Rajasthan
                                                                                                                                                                                                            Punjab

                                                                                                                                                                                                                                                              West Bengal
                                                                                                                                                                                                                                              Uttar Pradesh
                                                                                           State Bank of India                                                                                                                                                                     24
Stringency and lockdowns not related to infection spread

 ❑   Contrary to popular belief in many countries stringency declined post vaccination and cases
     declined (Israel, Russia, Spain, Serbia)

                                                    Stringency Index
                    90

                    80

                    70

                    60

                    50

                    40

                    30

                         Average stingency index Pre Vaccination   Average stingency index Post vaccination

                                                      State Bank of India                                     25
Indian Recovery Rate is faltering

 ❑       Recovery rate across countries continues to improve in different peaks
 ❑       But in India recovery rate increased to 97.3 till mid-Feb’21 but it has started declining
         thereafter and moved to 85 recently. Based on our model if we consider second wave peak is
         reached when recovery rate is around 78%-79%, then active cases would be around 45
         lakhs
 ❑       Also, the second wave daily peak cases are higher than the first peak daily cases. Further, in
         3rd wave peak cases are also higher than 2nd wave peak cases. It is more severe than 2nd
         wave only in USA and Japan
 ❑       We as a country cannot afford any 3rd wave
                              Recovery Rate in Different waves                                                                             Second peak and Third peak cases

 120                                                                                                                                                                                          14.8

 100
                                                                                                    11.7

  80

  60

                                                                                                                                                                     6.3
  40
                                                                                                                                                                                  4.6
                                                                                                                                                         4.3
                                                                                                                                   3.9             3.9
  20
                                                                                                                             2.7                                                                           2.5
                                                                                                                 2.2                         2.1               2.0
     0                                                                                                                 1.5
                                                                                                                                                                                        1.0
                                                                                                                                                                                                                    1.4
                                                                                                           0.7                                                             0.7                       0.9
          Spain   Japan      USA       UK    Italy    Germany Israel    South    Pakistan   India
                                                                        Korea
                                                                                                    France       Spain       Japan            USA          UK         Italy      Germany      Israel       Russia   Brazil
                          First wave    Second wave      Third wave    Current
                                                                                                                                         Peak 2 as X times Peak 1     Peak 3 as X times Peak 2

                                                                                 State Bank of India                                                                                                                 26
Days to reach 2nd peak much higher than taken to reach 1st peak

 ❑   India took maximum days to reach the first peak when compared to other countries. The daily
     new cases at peak was also much higher in India
 ❑   The number of days to reach 2nd peak in different countries was much higher compared to
     days to reach 1st peak

                                                Days taken to reach different Peaks
                              No of Days required             No of Days
                                                                                             No of Days
                               to reach first Peak Peak 1  required to reach   Peak 2                         Peak 3
                    Country                                                               required to reach
                                from above 100 Daily cases   Peak 2 from     Daily cases                    Daily cases
                                                                                         Peak 3 from Peak 2
                                     cases                      Peak 1
                  Fra nce            27             7578           220          88790           150            57799
                  Spa i n            22            10401           221          22766            80            34232
                  Ja pa n            28              743           114          1998            159            7855
                  USA                47            38509           95           79543           163           307581
                  UK                 30             7860           216          33409            57            67928
                  Ital y             27             6554           237          41195           119            26793
                  Germa ny           22             6824           265          31555           118            30634
                  Is ra el           20              765           174          11316           119            10213
                  Rus s i a          47            11656           166          29258             -              -
                  Bra zi l           127           67860           244          97586             -              -
                  Indi a             187           96793            -             -               -              -

                                                   State Bank of India                                                    27
COVID-19 Second Wave Trends: Reproduction Number (R0)

  Pan-India 2nd Wave began around from Feb, and time dependent R0 is more than 2.0

                                 State Bank of India                                 28
COVID-19 Second Wave Trends

     •   High uncertainty in estimating final size on account of spatial/temporal variability,
         different staring points of second wave and virus attack rate across states

     •   Our model suggests that the estimated peak time is 96 days from 15-Feb,
         indicating the peak happening in the 3rd week of May?

                                      State Bank of India                                        29
State-wise R-Factor shows surprisingly Maharashtra at lowest:
Higher base could be the reason, but will lockdown also help?

 ❑   R-naught (R0), also called the R-factor, stands for the ability of one infected person passing on
     the disease, on average, to the number of healthy people
 ❑   The situation is precarious for the states like Assam, Bihar and UP where R0 is more than or
     equal to 2.5
 ❑   All India current average R0 value is 1.6; R0 at the beginning of Lockdown in India was 1.83
     between March 27 and April 6. It came down to 1.55 on April 11. However, between April 13
     and May 10 it further came down to 1.23 following stringent Lockdown measures

                                         State Bank of India                                     30
Maharashtra seems closer to its peak, but other states have to control the spread to
achieve national peak!

❑   UP and Maharashtra had achieved peak before national peak in first wave
❑   Now new cases in Maharashtra seems to be stabilising but share of cases in total of various
    other states (Chhattisgarh, MP, Gujarat) has increased in the current second wave and these
    are showing significant increase in daily new cases. So if other states also implement strict
    actions and control the spread, then national peak may come within 1-2 weeks after
    Maharashtra peak
❑   Our earlier projection of a peak in second fortnight of April may now be pushed back into beyond
    mid –May as vaccination speed has lost its momentum
                             National Peak and States Peak
                                                                                                     Second wave as X times of First wave
                                     Gap from
                    First Peak    National Peak(- Peak 1 daily new New cases as
         States                                                                          7.8
                       date      indicates before        cases     on 21.04.2021
                                  national peak)
    Delhi          11-11-2020           56               8593          24638
    Gujarat        27-11-2020         72              1607            12553
                                                                                                        5.0                                             4.8
    Karnataka      09-10-2020         23             10913            23558                                                                       4.4
    MP             19-09-2020          3              2607            13107                                                     3.8
    Maharashtra    11-09-2020         -5             24886            67468        2.9                        2.7                           2.6
    Punjab         17-09-2020          1              2848            4953                     2.2                        2.1
                                                                                                                    1.7               1.9
    Tamilnadu      16-09-2020          0              5652            11681
    Chhattisgarh   18-09-2020          2              3842            14519
    Kerala         10-10-2020         24             11755            22414
    West Bengal    24-10-2020         38              4148            10784
    Rajasthan      24-11-2020         69              3314            14622
    UP             15-09-2020         -1              6841            33106

                                                                  State Bank of India                                                                         31
Daily new cases rising at higher rate in Delhi, Chhattisgarh, Maharashtra, UP
but at the same time injection to infection ratio is also lower

❑   7-days moving average (MA) of post-vaccination cases are much higher than 7 Days MA of pre-
    vaccination cases in certain States (Delhi, Chhattisgarh, Maharashtra, UP, AP) and their 7-days
    average of injection to infection ratio is also lower

                     50
                     45
                     40
                     35
                     30
                     25
                     20
                     15
                     10
                      5
                      0
                                                           Chhattisgarh

                                                                                            Haryana
                                                                                  Gujarat

                                                                                                                                                       Karnataka
                                                                                                                                                                   Kerala

                                                                                                                                                                                                                                                                                                              India
                                                                                                                                                                                                                                         Tamil Nadu
                                                                                                                                                                                             Maharashtra
                                                                                                                                                                            Madhya Pradesh
                          Andhra Pradesh
                                           Assam

                                                                          Delhi

                                                                                                                         Jammu & Kashmir

                                                                                                                                                                                                           Odisha

                                                                                                                                                                                                                                                      Telangana
                                                                                                      Himachal Pradesh
                                                   Bihar

                                                                                                                                           Jharkhand

                                                                                                                                                                                                                             Rajasthan

                                                                                                                                                                                                                                                                                  Uttarakhand
                                                                                                                                                                                                                    Punjab

                                                                                                                                                                                                                                                                                                West Bengal
                                                                                                                                                                                                                                                                  Uttar Pradesh
                                                                          Post vaccination Vs Pre Vaccination (X times)                                                                                                                  I-I Ratio

                                                                                                  State Bank of India                                                                                                                                                                                                 32
Fatality rate in Chhattisgarh, HP, Uttarakhand and Odisha higher in
current 2nd wave than in 1st wave

❑   7-days moving average (MA) of fatality rate in the           State wise Cumulative Fatality Rate %(7 Days MA)
                                                                                      1st Peak      Current Fatality
    current second wave is higher than fatality rate at the           States
                                                                                    Fatality Rate        Rate
    time of first wave peak in case of Chhattisgarh, HP,        Punjab                    3.0             2.6
                                                                West Bengal               1.9             1.6
    Uttarakhand and Odisha                                      Maharashtra               2.8             1.6
                                                                Himachal Pradesh         0.8              1.5
                                                                Uttarakhand               1.3             1.5
❑   All India fatality rate is now around 1.2 and is much       Delhi                    2.2              1.4
                                                                Gujarat                  2.8              1.3
    lower than fatality rate of 1.6 at the time of first wave   Tamilnadu                 1.7             1.3
                                                                India                     1.6             1.2
    peak
                                                                Uttar Pradesh             1.4             1.2
                                                                Karnataka                1.6              1.2
                                                                Madhya Pradesh            2.0             1.1
                                                                Chhattisgarh             0.9              1.1
                                                                Haryana                  1.0              1.0
                                                                Jharkhand                0.9              0.9
                                                                Andhra Pradesh           0.9              0.8
                                                                Rajastan                  1.2             0.8
                                                                Bihar                    0.5              0.5
                                                                Odisha                    0.4             0.5
                                                                Telangana                 0.6             0.5
                                                                Kerala                   0.4              0.4

                                        State Bank of India                                                      33
During 1st wave peak, maximum states had high tests/million and higher test positivity

❑   During the first wave around the national peak, a number of states were in quadrant I where number of tests
    as well as test/million were both high
❑   Interestingly, states that were testing less even as more infections like Maharashtra, Chhattisgarh, and
    Madhya Pradesh are now witnessing a larger wave of infections

                                                                                                                                 Andhra Pradesh     AP
                                                Test /Million vs Test Positivity in First Wave (7 Days Average)                  Assam              AS
                                     35.0                                                                                        Bihar              BR
                                                                               GA
                                                                                                                                 Chhattisgarh       CT
                                     30.0                                                                                        Delhi              DL
                                                II                MH                                        I I                  Goa                GA
                                     25.0                                                                                        Gujarat            GJ
                Test positivity(%)

                                                                                                                                 Haryana            HR
                                     20.0
                                                                 CT                                                              Himachal Pradesh   HP
                                                      HP                KA          AP                                           Jharkhand          JH
                                     15.0                              UT
                                                MP                                                                               Karnataka          KA
                                                                        PB                                                       Kerala             KL
                                     10.0                              AS HRKL                                           DL
                                                                              OR                                                 Madhya Pradesh     MP
                                                                 UP      JH TN           TG
                                      5.0        RJ WB                                                                           Maharashtra        MH
                                                                       BR GJ
                                                     III                                                     IV                  Odisha             OR
                                      0.0                                                                                        Punjab             PB
                                            0              500          1000          1500           2000         2500    3000   Rajasthan          RJ
                                                                                     Test /Million                               Tamil Nadu         TN
                                                                                                                                 Telangana          TG
                                                                                                                                 Uttar Pradesh      UP
                                                                                                                                 Uttarakhand        UT
               Quadrant 1: High number of tests, High Test Positivity %
                                                                                                                                 West Bengal        WB
               Quadrant II: Low number of tests, High Test Positivity %
               Quadrant III: Low number of tests, Low Test Positivity %
               Quadrant IV: High number of tests, Low Test Positivity %

                                                                                    State Bank of India                                                  34
In current wave, High number of tests & High test positivity in Maharashtra, Goa,
Chhattisgarh, Delhi, Haryana
❑   In the current second wave the number of states in 1st quadrant have reduced. Maharashtra, Goa,
    Chhattisgarh, Delhi, Haryana now belong to this category
❑   Larger number of states in III quadrant now (Uttar Pradesh, Odisha, Bihar, Jharkhand, Andhra Pradesh) where
    low test/million is accompanied by lower test positivity
❑   States like West Bengal and Madhya Pradesh have high infections, but are testing not adequately
                                                                                                                                                 Andhra Pradesh     AP
                                                 Test /Million vs Test Positivity in Second Wave (7 Days Average)
                                                                                 CT                                                              Assam              AS
                                      30.0                                                                                                       Bihar              BR
                                                                                                                                                 Chhattisgarh       CT
                                                                                       MH
                                                                                 GA                                          I                   Delhi              DL
                                      25.0
                                                 II MP                                                                                           Goa                GA
                                                                                                                                         DL      Gujarat            GJ
                                      20.0
                 Test positivity(%)

                                                                                                                                                 Haryana            HR
                                                 WB                  HR                                                                          Himachal Pradesh   HP
                                      15.0            RJ       HP
                                                    AP                                     KL                                                    Jharkhand          JH
                                                            UP                        KA                                                         Karnataka          KA
                                                                PB
                                      10.0               OR JH TN                                                                                Kerala             KL
                                                          BR                                                          UT                         Madhya Pradesh     MP
                                                                                                GJ
                                                                                                         TG                                      Maharashtra        MH
                                       5.0
                                                        III          AS                                                     IV                   Odisha             OR
                                                                                                                                                 Punjab             PB
                                       0.0                                                                                                       Rajasthan          RJ
                                             0    500         1000        1500        2000        2500      3000   3500    4000   4500    5000
                                                                                                                                                 Tamil Nadu         TN
                                                                                                Test /Million
                                                                                                                                                 Telangana          TG
                                                                                                                                                 Uttar Pradesh      UP
                Quadrant 1: High number of tests, High Test Positivity %                                                                         Uttarakhand        UT
                Quadrant II: Low number of tests, High Test Positivity %                                                                         West Bengal        WB
                Quadrant III: Low number of tests, Low Test Positivity %
                Quadrant IV: High number of tests, Low Test Positivity %

                                                                                  State Bank of India                                                                    35
Mobility & Cases both increased in UP & Karnataka in April, but conversely
Mobility & Cases are inversely related in Chhattisgarh, Delhi and Maharashtra

❑                  In Feb’21, only Kerala was associated with high infection and high mobility, however, in April, UP
                   and Karnataka are witnessing similar trends
❑                  Quadrant IV which is associated with high infection and low mobility has new entrants, Delhi and
                   Chhattisgarh while in Feb’21 only Maharashtra was there
❑                  Many states are still in quadrant II where high mobility and low infection are coexistent

                               Google mobility Vs Daily infection on End Feb'21                                                  Google mobility Vs Daily infection on Apr'21 till date
                    II                                                     I
                                                                                                                          II UT BR KL                                                   I
                          BR                                                                                                     AP TN                                                                        2
                                                                            I                                               JH                          UP                          I
                                                                                                                               PBHR    KA                                                                     -8
                        UT                                                                        8                               WB
 Google Mobility

                                                                                                                            TG

                                                                                                        Google Mobility
                          OR                                                                                                     OR GJ                                                                        -18
                      UP CT                              KL                                       3
                    AP JH     TN                                                                                                                                                                              -28
                                                                                                                                      MP                                                          MH
                     WB RJ MP                                                                     -2                                RJ
                                                                                                                                                                                                              -38
                       TG                                                                                                                  CT
                                                                                                                                                 DL                                                           -48
                         DLGJKA                                                                MH -7
                     HR                                                                                                                                                                                       -58
                                                                                                  -12                                                                                                        -68
                          40    PB1040    2040    3040        4040   5040       6040    7040                              2200       12200      22200        32200   42200        52200          62200   72200
                    III                          Daily Infection (7D MA)        IV                                                                      Daily Infection (7D MA)
                                                                                                                           III
                                                                                                                                                                                            IV

 Quadrant I: High infection, High mobility
 Quadrant II: Less infection, High mobility
 Quadrant III: Less infection, Less mobility
 Quadrant IV: High infection, Less mobility

                                                                                     State Bank of India                                                                                                 36
Share of top 15 districts in new cases declined; but rural penetration has increased

❑   New cases in top 15 districts, which are mostly urban has declined in April so far

❑   Fatality rate in top 15 districts has also dropped after rising in Feb’21

❑   However, the share of rural districts in new cases has risen again in April indicating the spread of infection to
    rural areas has already occurred

                                  Share of Top 15 districts in New cases                                                                         Share of Rural districts in New cases
      60                                                   56.2                           55.0                         2.5
                                                                                                                             43.4
      50                                                                                                               2.0
                     2.0                                                                                                                                                                              41.9
                                                                                                      39.0
      40                                                                            1.7
                                                                                                                       1.5                                    39.9
           29.5                                                      1.4                                                               39.0                                       39.1
      30                                                                                                        1.25                                38.6
                                                                                                                                                                                            37.9
                                                                                                                       1.0
      20
                                                                                                                       0.5                                              34.6
      10

      0                                                                                                                0.0
                                        Nov-20

                                                  Dec-20

                                                                                                       Apr-21
            Sep-20

                             Oct-20

                                                            Jan-21

                                                                           Feb-21

                                                                                           Mar-21

                                                                                                                                                                                                       Apr-21
                                                                                                                                        Oct-20

                                                                                                                                                     Nov-12

                                                                                                                                                                                   Feb-21

                                                                                                                                                                                             Mar-21
                                                                                                                              Sep-20

                                                                                                                                                               Dec-12

                                                                                                                                                                         Jan-21
                           Top 15 Districts % Share to New cases                    Fatality Rate (RHS)

                                                                                                    State Bank of India                                                                                         37
Worst affected districts mostly from Maharashtra: Top 15 districts contribute 25% of GDP

❑   Amongst the top 15 districts worst affected (mostly urban and only 2 Ahmednagar and Raipur rural), 6 are
    from Maharashtra. Overall these districts contribute around 25% to the National GDP
❑   If we look at the rural districts worst affected, 9 are from Maharashtra followed by 3 from Chhattisgarh. These
    account for around 3.3% of the National GDP
❑   Also, if we see various districts where congregation was held (Kumbh, Election and farmer protests) recently
    has seen uptick in daily new cases in April, though still over a low base

        Top 15 districts in new cases     Top 15 rural districts in new cases     Dsitricts where congregation was held and COVID-19 new cases (month-end)
          District             State             District         State             Dsitrcits           State         Jan      Feb        Mar         Apr
     Delhi               Delhi           Ahmednagar         Maharashtra         Haridwar         Uttar Pradesh       12       10         70          572
     Bengaluru Urban     Karnataka       Raipur             Chhattisgarh        Jind             Haryana             3         5         98          230
     Pune                Maharashtra     Latur              Maharashtra         Rohtak           Haryana             4         1         11          145
     Mumbai              Maharashtra     Aurangabad         Maharashtra         Sonipat          Haryana             9         4          6          573
     Nagpur              Maharashtra     Chandrapur         Maharashtra         Jhajjar          Haryana             3         1          9          117
     Thane               Maharashtra     Raigad             Maharashtra         Ghazipur         Haryana             1         1          6          814
     Lucknow             Uttar Pradesh   Kottayam           Kerala              Bhiwani          Haryana             0         1         10          180
     Nashik              Maharashtra     Prayagraj          Uttar Pradesh       Ambala           Haryana             3        21         105         221
     Ahmedabad           Gujarat         Jodhpur            Rajasthan           Fatehabad        Haryana             1         2          1          126
     Ahmednagar          Maharashtra     Jalgaon            Maharashtra         Muzaffarnagar    Uttar Pradesh       6         0         24          381
     Chennai             Tamil Nadu      Solapur            Maharashtra         Mathura          Uttar Pradesh       0         1          3          355
     Ernakulam           Kerala          Satara             Maharashtra         Birbhum          West Bengal         3         3         30          471
     Kozhikode           Kerala          Durg               Chhattisgarh        Malda            West Bengal         2         4         12          388
     Raipur              Chhattisgarh    Nanded             Maharashtra         North 24 Parganas West Bengal        58       47         212        1860
     Surat               Gujarat         Bilaspur           Chhattisgarh

                                                              State Bank of India                                                                       38
Age-wise distribution shows maximum cases in 21-30 age group & deaths in 60-69
age group

                     Age wise distribution of cases in India                                               Age wise covid deaths in Mumbai
                                                                                      30.0
 30

                                                                                      25.0
 25

 20                                                                                   20.0

 15                                                                                   15.0

 10                                                                                   10.0

  5                                                                                    5.0

  0                                                                                    0.0
      0-10   11-20   21-30   31-40   41-50   51-60   61-70   71-80   81-90   91-100          0-9   10-19   20-29   30-39   40-49   50-59   60-69   70-79   80-89 Above 90

                                                                 State Bank of India                                                                               39
Oxygen crisis in India

 ❑   India’s Daily Production Capacity (7287 MT) and Stock (~50,000 MT) comfortably more than
     Daily Consumption (below 5000 MT)
 ❑   The maximum consumption of medical oxygen in the country is by states of Maharashtra,
     Gujarat, Madhya Pradesh, Uttar Pradesh, Karnataka, Tamil Nadu, Delhi, followed by
     Chhattisgarh, Punjab, Rajasthan. While the excess oxygen is available in other Easter
     regions like Andhra Pradesh, Jharkhand and Odisha. So, the challenge is logistics (storage
     and distribution system)
 ❑   To meet the demand & ease of transportation, Government has taken a number of steps like
     increase production capacity, import of oxygen, PSA plants in hospitals for self sufficiency,
     utilization of surplus available with steel plants & ramp up transportation through train etc.
 ❑   However, we believe if the cases continue increase and cross 4-5 lakh per day, then
     undoubtedly, it is difficult, (assuming 10% needs oxygen support)
 ❑   Further to address the transportation issues, we believe all the states should allow
     ambulance status to the tankers so that they move faster, which will certainly help and
     reduce the transit time

                                        State Bank of India                                       40
Disclaimer:                                                   Contact Details:
This Report is not a priced publication of the Bank. The      Dr. Soumya Kanti Ghosh
opinion expressed is of Research Team and not necessarily     Group Chief Economic Adviser
reflect those of the Bank or its subsidiaries. The contents   State Bank of India, Corporate Centre
can be reproduced with proper acknowledgement. The write-     Nariman Point, Mumbai - 400021
up on Economic & Financial Developments is based on           Email: soumya.ghosh@sbi.co.in
information & data procured from various sources and no              gcea.erd@sbi.co.in
responsibility is accepted for the accuracy of facts and      Phone:022-22742440
figures. The Bank or the Research Team assumes no liability    :@kantisoumya
if any person or entity relies on views, opinion or facts &
figures finding in this Report.

                                                 State Bank of India                                  41
You can also read