Will travel activity post COVID-19 return to pre-COVID-19 levels? The WFH experience thus far - aitpm
←
→
Page content transcription
If your browser does not render page correctly, please read the page content below
Will travel activity post COVID-19
    return to pre-COVID-19 levels? The
    WFH experience thus far
      David A. Hensher, PhD, FASSA
      Founder and Director of the Institute of Transport
      and Logistics Studies (ITLS)
      The University of Sydney Business School
      The University of Sydney NSW 2006 Australia
      http://sydney.edu.au/business/itls

      With contributions by Matthew Beck, PhD

      “WFH –Remarkably smooth, effective and productive”

      “An unintended positive consequence of COVID-19”

      I acknowledge the partnership with TMR Qld through iMove
      and that any data material post Wave 2 is associated with
      the iMove research Program with permission. All comments
      are the views of the author alone.

The University of Sydney                                          Page 1
Some Context Setting Statements

                           – The Future (SR, MR, LR) is very uncertain, volatile and changing as we speak.

                           – Trend projections are not informative at present.

                           – The ‘New Normal’ is not known.

                           – Key Q: Whatever the ‘new normal’ will be, when will it display stable (travel) properties
                             going forward?
                               –   We speculate, on our own research, that this will be no earlier than the first or second quarter of 2021 if
                                   there are no more spikes like Victoria (July-September 2020)!
                               –   We will be tracking this with multiple was of data over the next 18 months (at least) (iMove CRC projects)

                           – We know that ‘Working from Home’ (WFH) has a new meaning, and

                               –   As a value proposition, has garnered increasing support from BOTH employees and employers.
                               –   While we recognise that WFH or teleworking or telecommuting is not new, the circumstances are.

The University of Sydney                                                                                                                         Page 2
Some Context Setting Statements continued

                           –   A lot of people have set themselves up to WFH,
                                –   and that investment suggests some commitment to a preference to WFH.

                           –   We speculate that WFH or elsewhere is unlikely to return totally to pre-COVID-19 levels
                                –   preferences have changed and the real world experiment has confirmed this.

                           –   The big question however is – when and by how much is WFH likely to return to pre-COVID-19
                               levels?
                                 – and to what extent possibly (not) return to the bad old ways of road traffic congestion and
                                    crowding on PT, especially in urban areas?
                                 – This has important implications for the way governments and consultants do future strategic
                                    transport modelling and applications
                                      • e.g., the way expansion factors are used from a typical day to a week to a year etc.

                           – Looking ahead snapshot: Our research (national), preliminary, suggests that we
                             could have as much as 10-25% of pre-COVID19 commuters WFH at least 1 if not
                             2 days a week
                                – But it will vary by occupation, location and household set up.
                                – If we take 10% of traffic out of each days peak in metro areas, we have Pre-COVID-19 school
                                  holiday traffic or better.
                                – We speculate that staggered working hours will gain momentum.

                           –   We have a real opportunity to not turn the clock back: let us not whittle it away!

The University of Sydney                                                                                                         Page 3
Evidence on WFH is Accumulating - Some examples
– A survey of 6,000 Australian workers in the public sector and Universities (essentially white collar) has
found 39 per cent of those surveyed would be happy to continue working from home some of the time -
even when the coronavirus pandemic ends. (Community and Public Sector Union, August 2020).
– Only 11 per cent of those surveyed wanted to WFH all the time, 39 per cent some of the
time, 30 per cent most of the time, and 14 per cent only on occasion
– A University of Sydney staff survey (10 June 2020, unpublished) found:
– The following positives in ranked order for staff:
No commute
Less distractions
Balance work/life - access to family/exercise
Flexible hours (staggered working hours)
• The Greatest challenges:
not switching off/working longer hours
loss of collaboration/social connections
reduced workstation quality
reduced physical activity
– Committee for Sydney 2020 Sydney Leadership Survey (August) 106/344 organisations
replied and:
– 83% expect to have more of their employees working from home in the post-COVID world.
The University of Sydney Page 4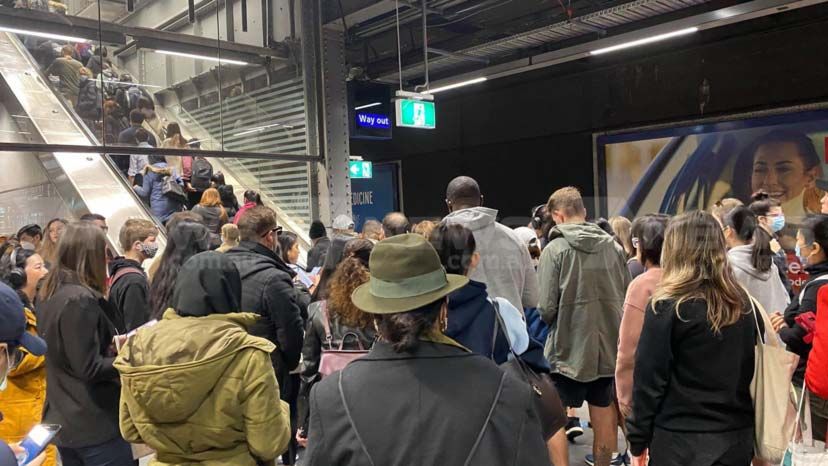
Evidence is Accumulating - Some more examples

                       –   UK: The Business for Clean Air Taskforce
                            –   a UK consortium that includes electronics giant Philips, ride sharing platform Uber and French utility firm Engie, with the backing
                                of the U.K. govt., concluded that
                            – In UK, some 87% of those currently working from home said they would like to continue to do so
                              “to some degree”
                            – Should they get their wish, “some 17 million people will continue flexible, remote work - an increase of
                              some 58% over the pre-lockdown figure of 10.8 million who worked from home.” June 2020

                       –   Singapore is working to ensure that WFH works to support a more efficient transport network and not turn the
                           clock back (but to flatten the peak)
                            –   Jeremey Yan, Deputy LTA in a talk to ‘Calibrate Demand and Supply to better optimise the transport network’ says:
                            –   ‘We are working on a plan with employers to try and get the peak 20-25% lower that pre-COVID-19 including staggered
                                working hours, WFH and incentives to support this’.
                            –   ‘We want a good % to WFH.’

                       –   Canada 49% and Norway 37% like, and prefer, to WFH
                            –   Transdev Survey August 2020 reported at ITS Australia Mobility Summit Sept 2.

                       –   BIS Oxford Economics (Australia)
                            – Reducing office space
                            – Plan to work at home at least 1 to 2 days per week

The University of Sydney                                                                                                                                Page 5
ITLS Covid-19 National Travel Survey
                              Waves 1 to 3 March/April, May/June, August/September 2020
                           Paper #1: Beck, M. and Hensher, D.A. (2020) Insights into the Impact of Covid-19 on Household Travel, Work,
                           Activities and Shopping in Australia – the early days under restrictions, Transport Policy, 96, 76-93.
                           https://doi.org/10.1016/j.tranpol.2020.07.00(Wave 1)

                           Paper #2: Hensher, D.A., Beck, M. and Wei, E. (2020) Working from home and its implications for strategic transport
                           modelling given the changing quantum of commuting trips by car and public transport in the early days of the COVID-
                           19 pandemic, submitted to Transportation Research Part A, 1 June, revised 14 September (Wave 1)

                           Paper #3: Beck, M., Hensher, D.A. and Wei, E. (2020) Slowly coming out of COVID-19 restrictions in Australia:
                           implications for working from home and commuting trips by car and public transport, Journal of Transport Geography,
                           88. (Waves 1 and 2)
                           https://doi.org/10.1016/j.jtrangeo.2020.102846
                           Paper #4: Beck, M. and Hensher, D.A. (2020) Insights into the impact of COVID-19 on household travel and activities
                           in Australia – the early days of easing restrictions, Transport Policy, 99,95-119. (Waves 1 and 2),
                           https://doi.org/10.1016/j.tranpol.2020.08.004
                           Paper #5: Hensher, D.A., Wei, E., Beck, M.J. and Balbontin, C. (2020) The impact of COVID-19 on the time and
                           monetary cost outlays for commuting - the case of the Greater Sydney Metropolitan Area after three months of
                           restrictions (Wave 2), submitted to Transport Policy, 14 September.

The University of Sydney                                                                                                                         Page 6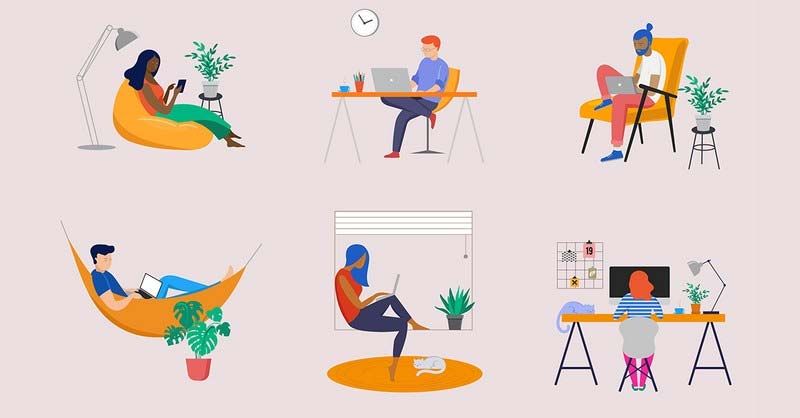
Tracking COVID-19, WFH and travel: When did we
                               undertake the first 3 surveys?
                           –    COVID-19 has been impacting on work
                                for a long period of time now:

                                 –   Where WFH is possible individuals
                                     and business have made investments
                                     into being able to WFH which they
                                     will likely want a return on.

                                 –   Organisations may be already
                                     thinking about how to rationalise
                                     office space as a savings measure on
                                     high commercial rents in CBD
                                     locations (more prone to being able
                                     to WFH too).

                                 –   Acquisition of new habits around
                                     travel and work, along with processes   Wave 1   Wave 2   Wave 3
                                     and mechanisms to WFH more
                                     effectively. Families adjusting to
                                     change.

The University of Sydney                                                                                Page 7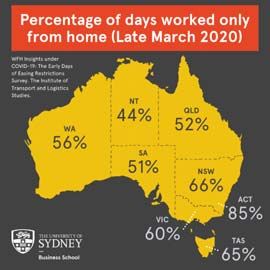
Statewide: Comparing Pre-COVID-19, Waves 1 to 3 on WFH
                   Pre-COVID19 Late March       Late May      Early Sept

The University of Sydney                                                   Page 8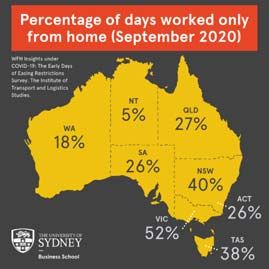
*******Work From Home Easier for Some******
                         Strong evidence of WFH preference
                                                            WFH as a Proportion of Days Worked
                           80%

                           70%

                           60%

                           50%

                           40%

                           30%

                           20%

                           10%

                           0%
                                 Manager   Professional   Technicians and Community and        Clerical and     Sales    Machine      Labourers
                                                              Trade       Personal Services   Administration            Operators /
                                                                                                                          Drivers
                                                                     Before COVID-19      Wave 2       Wave 3

The University of Sydney                                                                                                                          Page 9
Work From Home Easier for Some – there are barriers

                                                                   Barriers to Working from Home

                           Disruption from children/family               36%                    23%                   41%

                                   Effective collaboration           29%                  24%                        47%

                                    Ability to concentrate         24%                        37%                      39%

                           Dealing with email and comms      10%         16%                                   74%

                                                                    1st Ranked   2nd Ranked     Lower Ranked

                                                                                                                           * Wave 2 – Late
                                                                                                                                      May

The University of Sydney                                                                                                                     Page 10
But There Are Benefits Too: we like…..
Benefits of Working from Home
No commute 39% 25% 36%
Flexible work schedule 32% 33% 35%
More time with family 16% 16% 68%
Better able to complete work 13% 26% 61%
1st Ranked 2nd Ranked Lower Ranked
* Wave 2 – Late
May
The University of Sydney Page 11Overall WFH has been a Positive Experience (Late May vs Late
August)
Working from Home has been a Positive Experience
31%
29%
26%
20% 21% 20%
17%
14%
4% 3% 6%
3% 3% 3%
Strongly 2 3 4 5 6 Strongly Agree
Disagee
Wave 2 Wave 3
Would like to Work from Home more often in the Future
30%
25% 25%
20% 19% 20%
14% 14%
8% 9%
4% 4% 5%
3%
Strongly Disagee 2 3 4 5 6 Strongly Agree
Wave 2 Wave 3
The University of Sydney Page 12Relative (“Average”) Productivity is Stable (Late May vs Late
August)
Productivity relative to before COVID-19 (Employees)
37% 40%
27%
21% 23%
16%
12% 12%
6% 4%
A lot less productive A little less productive About the same A little more A lot more productive
productive
Wave 2 Wave 3
Productivity relative to before COVID-19 (Employers)
53% 50%
17% 15% 17%
8% 12% 12% 11%
5%
A lot less productive A little less productive About the same A little more A lot more productive
productive
Wave 2 Wave 3
The University of Sydney Page 13While Employment is Slowly Returning (All Locations)
Days Worked per Week
70%
60%
50%
40%
30%
20%
10%
0%
0 1 2 3 4 5 6 7
Before COVID-19 Wave 1 Wave 2 Wave 3
The University of Sydney Page 14And People are slowly returning to Workplaces (outside of home)
Days Worked from Home per Week
80%
70%
60%
50%
40%
30%
20%
10%
0%
0 1 2 3 4 5 6 7
Before COVID-19 Wave 1 Wave 2 Wave 3
The University of Sydney Page 15Many would Like to WFH More Moving Forward
80%
Number of Days Would Like to Work from Home in the Future
70%
60%
50%
40%
30%
20%
10%
0%
0 1 2 3 4 5 6 7
Before COVID-19 Wave 2 Wave 3
The University of Sydney Page 16Supporting WFH as a greater mix of # of Work days
– Days employee would like to WFH as a proportion of how many days they work
– WFH is currently a significantly changed proposition
– Especially contrasting Before COVID-19 with the Desired WFH Future
Before
Proportion of Days WFH Wave 1 Wave 2 Future
COVID-19
Zero percent of work days at home 71% 39% 45% 38%
Up to 20% of work days completed at home 7% 1% 2% 4%
21-40% of work days completed at home 4% 3% 2% 10%
41-60% of work days completed at home 3% 4% 4% 11%
61-80% of work days completed at home 2% 3% 4% 8%
100% of work days completed at home 14% 50% 43% 29%
The University of Sydney Page 17Incidence of WFH by DoW and State, Wave 3 (Sept), prelim
Overall DoW (weekday) is flat. If true, then it might not matter
whether we distinguish DoW overall in transport planning and
modelling.
The University of Sydney Page 18Staggered Work Hours (ToD): Leaving Earlier and Later
Leave Earlier Which of the following would Leave Later
you prefer?
72% Leave
Leave 48 mins
later
41mins
earlier 28%
Travel earlier than normal Travel later than normal
The University of Sydney Page 19What is the Financial Story for Commuters? Commuting time and money cost reductions GSMA (Late May 2020, Wave 2) The University of Sydney Page 20
What does reduced commuting translate into – Money & Time and GC reductions for the
                  Greater Sydney Metropolitan Area (GSMA)?

                Headline Finding: Wave 2 of ITLS Program (Late May 2020)
                – 3 months after COVID-19 resulted in restrictions in Australia, we saw an annual travel time reduction
                   for all commuters in the GSMA of $5.58 billion.
                     – This represents a 54.02% reduction in the Pre-COVID-19 total time costs of $10.3 billion,
                     – much of which we would suggest can be associated with reductions in congestions costs.

                –      Adjusting further for reduced employment volumes relative to pre-COVID-19 levels,
                        – the annual time cost reduction for all commuters who still have regular pre-COVID-19 levels of
                           employment are estimated as $4.4 billion.

                –      Hence there is $1.17 billion worth of reduced time costs associated with significantly reduced
                       employment hours, including a loss of employment.

                –      The implications for road investment linked to congestion in particular is profound, and
                        – shows how much of an increase in benefit to society, through congestion busting, can be obtained
                           by more flexible work arrangements, even allowing for some switching into car out of public
                           transport.

                           Paper #5: Hensher, D.A., Wei, E., Beck, M.J. and Balbontin, C. (2020) The impact of COVID-19 on the time and
                           monetary cost outlays for commuting - the case of the Greater Sydney Metropolitan Area after three months of
                           restrictions (Wave 2), submitted to Transport Policy, 14 September.

The University of Sydney                                                                                                                  Page 21
Annual cost savings for car and public transport
commuting trips per passenger late May 2020 (GSMA)
Weighted average for
Base: average per passenger before COVID-19 Car Public Transport
both modes
Annual monetary costs before COVID-19 $1,950 $2,482 $2,105
Annual monetary costs during COVID-19 $376 $668 $461
Annual monetary costs reduction 80.70% 73.09% 78.08%
Annual time costs before COVID-19 $5,601.76 $6,421.93 $5,841
Annual time costs during COVID-19 $3,289.93 $1,219.24 $2,686
Annual time costs reduction 41.27% 81.01% 54.02%
Annual generalised costs before COVID-19 $7,551.70 $8,903.54 $7,946
Annual generalised costs during COVID-19 $3,666.36 $1,886.94 $3,147
Annual generalised costs reduction 51.45% 78.81% 60.40%
Note: The values shown consider all the car and public transport passengers before COVID-19. The cost
savings reflect the decrease in the number of trips. Monetary costs include only running costs
The average annual reduction in time costs for car travel is $2,312 equivalent to $48.16 per week or $9.63 per weekday.
The average annual reduction in time costs for public transport is $5,203, equivalent to $108.39 per week, based on 48
annual working weeks, or $21.68 per weekday. This is substantial reduction in commuting costs, with the overall average
monetary cost of $34.24 per week being of particular interest in terms of additional gross income available for spending
on other items and activities.
The University of Sydney Page 22Going Forward The University of Sydney Page 23
What do we Conclude?
                       THE POTENTIAL BENEFITS ARE HUGE

                           – WFH promises to be the biggest ‘transport’ lever for policy makers to
                             reduce congestion and crowding,
                              – especially in CBD type locations, and should continue to encourage ongoing WFH
                              – We know this may have localised supply chain risks with less business supporting
                                office workers etc. (Structural change will be required)

                           – The key difference with COVID-19 has been the duration and the
                             extent to which disruption has occurred
                              –   Broken the back of significant business resistance
                              –   Much work is still being done, and done more or less as well as before
                              –   Potential cost savings for CBD employers could drive ongoing WFH
                              –   Positive benefits for staff re more flexible work, less time commuting
                              –   Biggest “hurdles” to work from home mentioned in surveys are issues around:
                                    • Team work, collaboration, social connectedness, spontaneity

                           – WFH can be used by big corporates to deliver on the sustainability
                             charter which has generally alluded them to date.

The University of Sydney                                                                                           Page 24
The Big Take Aways: Back to the Past – No Thank You!
– A new balance with support from both employees and employers
– 1 or 2 days a week WFH
– Flexible work times even if commute to the office
– It is about deliverables and not presenteeism.
– Saving in office rental costs (location choice – office)
– Challenger for property owners, especially in the CBD of large cities
– Rethink suburban office space
– Rethink the meaning of sprawl (location choice – home)
– It is a relative construct
– Local suburbanisation takes on a new and appealing meaning
– Revitalisation of suburbia
• Impressively this aligns well with the desire for a 30 min city!
– Rethink where infrastructure funding should go (or deferring major infrastructure spend) (IA Cap of $100m a
concern)
– Businesses may need to relocate as well.
• But CBD businesses that serve CBD workers can still survive with 80% of commuters present at any one time
– Less long distance business travel (esp. the one day trips to a 1 hour meeting Syd-Mel)
– Government and employers working with employees can, and should, take advantage of the unintended positive
consequences of COVID-19
– If they do, we might be able to reduce road congestion and PT crowding by (at least) 10-15% in metro areas
– We are truly in Liminal (“Threshold”) Time – the gateway between two stages in life!
– See David on Channel 9 ( last week: 29 September, 2020) talking about WFH http://www.mediaportal.com/mp/playnow.aspx?u=155818&p=1562087859&key=1407211021915419920338235156712481136139163
The University of Sydney Page 25We have a lot more to say, but that is for another day
THANK YOU
David Hensher
Institute of Transport and Logistics Studies (ITLS)
The University of Sydney Business School
THE UNIVERSITY OF SYDNEY
E david.hensher@sydney.edu.au W http://sydney.edu.au/business/itls
The University of Sydney Page 26Additional Material not in online presentation The University of Sydney Page 27
Work and Work from Home; by State
                                                Average Days Worked per Week
                           6.0
                           5.0
                           4.0
                           3.0
                           2.0
                           1.0
                           0.0
                                  NSW    VIC      QLD         SA        WA        TAS*    NT*    ACT*

                                                   Before COVID-19   Wave 2   Wave 3

                                           Average Days Work from Home per Week
                            3.0

                            2.0

                            1.0

                            0.0
                                   NSW    VIC     QLD         SA        WA        TAS*   NT*    ACT*

                                                   Before COVID-19   Wave 2   Wave 3

                                                                                                  * Small Sample
                                                                                                            Sizes

The University of Sydney                                                                                            Page 28
Work and Work from Home; by Occupation
Average Days Worked per Week
6.0
4.0
2.0
0.0
Before COVID-19 Wave 2 Wave 3
Average Days Work from Home per Week
4.0
3.0
2.0
1.0
0.0
Before COVID-19 Wave 2 Wave 3
The University of Sydney Page 29Peak Spreading is Part of the Mix
– Looking at commute trips
– Monday ToD by Day of Week
– 52% of working respondents left home for work
– Tuesday
– 54% of working respondents left home for work
– Wednesday
– 57% of working respondents left home for work
– Thursday
– 54% of working respondents left home for work
10:00
11:00
12:00
13:00
14:00
15:00
16:00
17:00
18:00
19:00
20:00
21:00
22:00
23:00
2:00
3:00
4:00
5:00
6:00
7:00
8:00
9:00
0:00
1:00
– Friday
– 51% of working respondents left home for work Monday Tuesday Wednesday Thursday Friday
The University of Sydney Page 30Peak Spreading is Part of the Mix
Staggering of Working Hours
34%
23% 23%
20%
I cannot stagger my My work hours are I do not want to I would be happy to
work hours already staggered stagger my work hours stagger my work hours
Preferred Staggering of Hours
50%
21% 20%
10%
ew set of starting
Rolling
andset
finishing
of starting
timesand
Rollingthat
setfinishing
stay thetimes
same
of starting andthat
until
are
thevaried
finishingCOVID-19
times across
restrictions
employees
are varied end
across on
Other a daily b
employees
The University of Sydney Page 31Small Changes can make a Difference
– M1 Sydney Harbour Tunnel (daily traffic counts by month, 2019)
– Jan/Dec = Summer Holidays ~ 6% less traffic than peak months
– April/July = Easter and School holidays ~ 4% less daily traffic
– Traffic congestion is noticeably lower
100000
90000
80000
70000
60000
50000
40000
30000
20000
10000
0
The University of Sydney Page 32Comparing Early April with Late May 2020: Overall annual reductions after
adjusting for changes in volume of work hours (GSMA)
Early April
Total reduction Car Public Transport Total Reduction
Annual monetary costs $985,560,275.00 $854,991,925.35 $1,840,552,200.35
reduction
Annual time costs reduction $3,408,934,354.42 $2,092,664,414.11 $5,501,598,768.52
Annual generalised costs $4,394,494,629.41 $2,947,656,339.46 $7,342,150,968.87
reduction
Late May
Total reduction Car Public Transport Total Reduction
Annual monetary $1,556,329,552 $739,418,692 $2,295,748,245
costs reduction
Annual time costs $2,286,583,569 $2,120,825,524 $4,407,409,093
reduction
Annual generalised $3,842,913,121 $2,860,244,216 $6,703,157,338
costs reduction
Late September? Less but we speculate:
definitely very positive reductions
The University of Sydney Page 33What does the Data Tell us?
– It shows clearly that things are very slowly sliding away from the "peak
WFH" of just after the first wave, but there is a desire to continue some
increased level of WFH in the future.
– There appear to be two "negative" forces at play
– People missing the work environment (travelling to work will now be novel for many; may
look forward to it, but maybe short lived pleasure!)
– Businesses either deliberately or subconsciously just drifting back to "business as usual"
– We have a circuit breaker here and we can all see the benefit of that
– Increased levels of WFH (perhaps 20-30% of work that can be done from home, being
done from home) will have HUGE benefits in the future
• and it really needs the ongoing support of business and workers to do so.
– Indeed, the peak is unrealistic and it is not what we are saying,
• but to allow the system to drift back to the pre-COVID levels would be an epic lost
opportunity.
The University of Sydney Page 34Caveats, Views,……
– Of course humans are social animals and right now the desire to interact with
staff is strong.
– Naturally, WFH will not continue in the volume that it does now
– But there is a “better” middle ground where people can enjoy the social aspect of work,
– better term connection and social credits,
– but also enjoy the benefits of WHF.
– We have now seen and experienced how it could work, we can show significant
cost savings, and reduced need for new transport infrastructure (heretical) which
could free funding for:
– Better freight and logistics infrastructure
– Schools and Hospitals
– Even a future for koalas
The University of Sydney Page 35Summary: What might all this mean going forward?
Two main scenarios as alternative futures on the spectrum.
– Scenario 1: Travel will return to the pre-Covid-19 normal within a few months
– with PT, ride share and private car use showing very similar levels of use as before =
crowding and congestion.
– Working from home (WFH) will return to ‘normal’ & have little impact.
– Scenario 2: One of the most important policy levers now available, in contrast to
pre-Covid-19,
– is the effectiveness and growing acceptance of WFH.
– Hence reduced number of weekly commutes
– And many other positive outcomes
Hensher, D.A. (2020) What might Covid-19 mean for mobility as a service (MaaS)? Transport Reviews, 40 (5).
The University of Sydney Page 36Beyond commuting to Non-commuting and Workplaces
Our 4th paper identified a situation as restrictions have been eased (except in
Victoria) where large increases in activity were planned for shopping and
social and recreation purposes,
with people feeling most comfortable about meeting with friends, going to the shops and
also relatively comfortable visiting restaurants.
Letting one's guard down could be disastrous given that COVID‐19 only travels when we
travel
And a greater focus of local suburban activity.
Workplaces will also recognise that having staff WFH is one way to mitigate
risk and
governments and businesses more broadly will recognise the importance of lowering the
chance of further waves.
Additionally, having staff WFH and/or ready to WFH quickly is also beneficial in risk
management for future disruption.
The University of Sydney Page 37Post Covid-19 – what Does the Future Hold?
Implications for Public Transport (PT) and more generally, including active modes
The University of Sydney Page 38How PT patronage in Sydney in coming back (‘very’) slowly
August 2020 is 55% down on August 2019
The University of Sydney Page 39What does Post Covid-19 look like for PT?
Flattening of the curve is now replaced with the challenge to find ways to maintain flattening of the peak now that COVID-19
has done the hard work for us.
‘The camel has died’ and now we want to preserve ‘the low back horse’.
Short term more generally (How long is Short Term?) – Some realities
– Public transport risk and prolonged distancing and crowd avoidance to feel safe.
• Limit standing
• Masks and temperature check on entry to PT
• Automatic entry/exit etc. to avoid touching (Apps available already)
– There will be a slow recovery of patronage (Sydney minimum of ~30% down by end of year)
– Growing popularity of the car with bio-security becoming the new attribute in mode choice
• The bio-security mobility physical space challenge
• Encourage car pooling for known persons : ‘familiar sharing’
• Not seeing the claimed growth in traffic congestion yet. CARMAGEDDON effect!
– Traffic congestion may worsen under current pricing, although few signs to date, and especially with low cost
electric cars unless increased WFH
• Government to ensure parking stations and kerbside parking pricing does not become gauging
– New local community spirit (ANZAC day this year - get to know your neighbours)
– Social distancing at the office – may ‘force’ employers to stagger attendance given available space
• Happening already.
The University of Sydney Page 40What does Post Covid-19 look like for PT?
Longer term more generally
– Employers asked to support staggered working hours and days to WFH
• Some businesses open longer hours with fewer persons working per hour but still possibly increased
hours overall to reduce crowding
– Might assist in flattening the peaks?
– Late starts, early finishes?
– Infrastructure needs must be reviewed,
• Scale down large projects and focus on small investments such as
– Improved bicycle lanes in suburbia (huge B/C ratio)
– Improved pedestrian precincts and walking facilities (huge B/C ratio)
– Freight distribution capacity improvements for deliveries
– Important Policy Message
• With big infrastructure projects on the agenda again, I would much prefer people were looking at ways of making our
neighbourhoods work better and improve access to the suburban clusters and affordable housing in the clusters. That is
where the $ should be going but they mainly miss the IA $100m hurdle!
– Redesign of residential dwellings and workplaces to accommodate efficient and effective office space
• Will there be employer subsidy support for a home office fit out?
• Convert CBD office space to socio-recreational space as a tourism precinct (lower rents maybe)
– Decentralisation
• Suburbanisation? Regionalisation?
The University of Sydney Page 41You can also read