The Anatomy of a Large Mobile Massively Multiplayer Online Game
←
→
Page content transcription
If your browser does not render page correctly, please read the page content below
The Anatomy of a Large Mobile Massively Multiplayer
                           Online Game

             Ashish Patro, Shravan Rayanchu, Michael Griepentrog, Yadi Ma, Suman Banerjee
                                    Department of Computer Sciences, University of Wisconsin Madison

ABSTRACT                                                                             more than 100 countries. Parallel Kingdom (PK) is a multiplayer
We describe a large-scale and long-term measurement study of a                       role playing and strategy game which places a player’s character in
popular mobile Massively Multiplayer Online Role Playing Game                        a virtual game world that is superimposed on top of the real world.
(MMORPG), called Parallel Kingdom, which has over 600,000                            More specifically, the typical location of the a player’s character is
unique users distributed across more than 100 countries. Our study                   in the actual physical location of the mobile device, as reported by
covers important aspects of the game including (i) characteristics                   its GPS receiver or its wireless (WiFi or cellular-based) positioning
of its population, (ii) players’ game usage behavior, and (iii) cor-                 system. In short, it is a real location-based, real-time, mobile Mas-
relation between players’ interest and the money spent by them in                    sively Multiplayer Online Role Playing Game (MMORPG). Each
the game. Our measurement study spans almost the entire life of                      player can interact with other players and monsters, find treasures
the game staring from its inception on October 31, 2008 to Novem-                    and trade items, often in their physical vicinity. The game client soft-
ber 10, 2011 (1104 days in total). To perform this study, we instru-                 ware has been written for Apple’s iOS platform as well as Google’s
mented the game’s client software (iOS and Android) to interact                      Android platform (such as the G1, DROID, and Nexus One phones).
with our measurement server. The rich dataset gathered allowed                          To the best of our knowledge, this is the first large scale and long-
us to analyze various characteristics of this highly popular mobile                  term measurement study of a mobile based MMORPG game with
MMORPG.                                                                              a large and diverse user base. The data analyzed in this paper starts
                                                                                     from the first day when the game was released on October 31, 2008
                                                                                     until November 10, 2011 (1104 days in total). To perform these
Categories and Subject Descriptors                                                   measurements, we developed a measurement library (for Android
C.2.0 [Computer-Communication Networks]: General; K.8.0                              and iOS platforms) that was integrated and deployed with the game.
[Personal Computing]: Games                                                          We worked closely with the game developers to instrument some
                                                                                     of the game code while ensuring that the overhead was minimal in
General Terms                                                                        terms of code instrumentation and additional resource usage (CPU,
                                                                                     memory and network). Pushing each update into the game took
Measurement                                                                          time as we had to coordinate with the update schedule of the game
                                                                                     on when the updates were actually pushed into Apple App Store/
Keywords                                                                             Android Market. We also had to test each update thoroughly before
                                                                                     deployment to ensure that the game developers were comfortable
Mobile games, MMORPG, Parallel Kingdom, Mobile applications,
                                                                                     with our code running within the game.
Characterization
                                                                                        This paper covers important aspects of the game and its con-
                                                                                     stituents including: (i) characteristics of the player population, (ii)
1. INTRODUCTION                                                                      players’ application usage behavior, and (iii) impact of player inter-
   With the rapid growth of smartphones and Internet enabled hand-                   est on game revenues. Some of the key observations from our study
held devices, an increasing number of third-party applications are                   of PK are as follows:
being developed for them and their usage is increasing rapidly [3].
Games constitute a significant portion of these applications in the                   1. The players of this MMORPG game played multiple short and
terms of popularity. For instance, recent research on mobile appli-                      closely spaced sessions. Almost half of the new user sessions
cation usage showed that users spent more time on gaming applica-                        were started within 5 minutes since the end of the previous ses-
tions compared to any other category [8].                                                sion. Caching data across consecutive sessions can provide sav-
   Motivated by these observations, we study one specific mobile                         ings in network usage due to such behavior.
game called Parallel Kingdom [11], available on both Android and                      2. The device model and platform impacts the application usage.
iPhone platforms, with over 600,000 unique users distributed across                      For example, amongst the Android devices, phones with slide-
                                                                                         out keyboards had more user interactions (involving both text
Permission to make digital or hard copies of all or part of this work for                and touch based interactions).
personal or classroom use is granted without fee provided that copies are
not made or distributed for profit or commercial advantage and that copies            3. We find that the generation of game revenues is highly corre-
bear this notice and the full citation on the first page. To copy otherwise, to          lated with the “active period” (the number of days that a player
republish, to post on servers or to redistribute to lists, requires prior specific       says in the game) and interactivity. For example, the daily rev-
permission and/or a fee.                                                                 enues from old players was more than 2.5 times the revenues
MobiGames’12, August 13, 2012, Helsinki, Finland.
Copyright 2012 ACM 978-1-4503-1487-9/12/08 ...$15.00.
                                                                                         generated from newer players.
Platforms covered Android, iOS
Total Unique Players >600,000
Total Sessions 47,469,725
No. of unique IP addresses 2,676,718
No. of countries 118
Distinct device models 780
No. of ISPs observed >1,000
Table 2: Summary of Parallel Kingdom game statistics for data
collected until November 10, 2011.
14000
12000
10000 Age 2 Age 3 Age 4
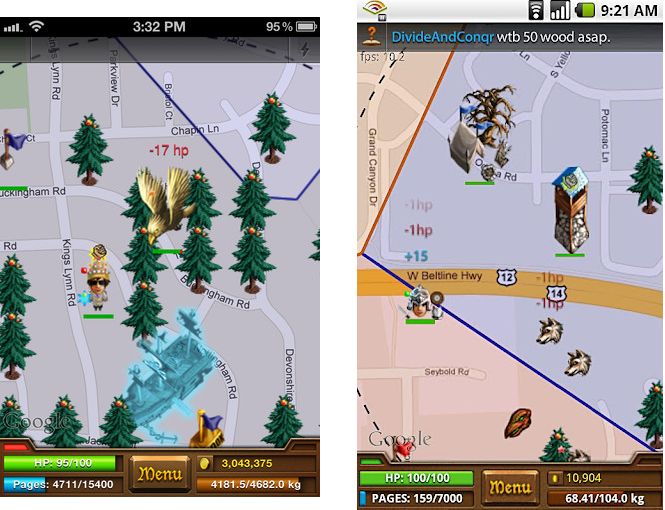
Figure 1: Screen-shots of the Parallel Kingdom game for the 8000
iOS (left) and Android (right) platforms.
6000
4000
2. THE PARALLEL KINGDOM GAME 2000
In this section, we first present a brief description of the game- 0
play in Parallel Kingdom (PK) [11] and then briefly discuss the 0 200 400 600 800 1000 1200
game data analyzed in this paper.
Figure 2: The daily active users for the game starting from Oc-
tober 31, 2008 to November 10, 2011.
2.1 Game Overview
As mentioned in Section 1, PK is a Massively Multiplayer Online
Role Playing Game (MMORPG) that places the character (user in
3. ANALYZING USER POPULATION AND
the virtual gaming world) on a virtual map according to their real BEHAVIOR
world location. The game uses the device’s GPS/WiFi capabilities In this section, we discuss trends related to the PK’s user popu-
of the mobile device for tracking the real world user location. In the lation (daily active users and its usage characteristics in terms of
game, each player picks up, trades or upgrades various items, fights session lengths and long term variations in playing durations.
monsters and interacts with other players on the map or through
chats and messages. Players can spend real money to buy the virtual What are the long term trends in daily active usage?
currency in the game (Food). The game (starting with Age 1) was
officially launched on October 31, 2008 and has since then gained Figure 2 shows the number of daily active users since the start
a lot of popularity. The game is a free third party application and of the game in October 2008 till November 10, 2011. As shown in
is available for the iOS (Apple) and Android platforms. The game the figure, the number is either steadily increasing or decreasing for
uses a centralized server architecture and its servers are located in most of the time except for a few days when there are sudden spikes.
Madison, Wisconsin USA. The sudden spike in days 149, 387, 729 correspond to the major
Over time, the game has added numerous features and pushed releases of the game (called Age 2, Age 3 and Age 4 respectively).
out updates through a few major releases of new “Ages” and several Other big spikes in the number of daily active users occurred around
minor updates. Since the First Age, there have been three major June 28 2010 (day 603) when the game was released on the iPad
releases (Age 2, Age 3 and Age 4). Recently, the game crossed over and iOS 4 platform and on day 886 due to a major update to the
a million unique players worldwide, and was ranked amongst one game. Thus, new releases and updates positively impact the num-
of the most popular mobile based MMORPGs [14]. Figure 1 shows ber of daily active users of the game. Also, starting from Age 3,
screen shots of the game for the Android and iOS platforms. there is more consistent increase in the game’s daily active usage.
Some important factors causing this behavior are the improvements
in gameplay, increase in the game’s popularity in its category and
2.2 Data Collection increase in developers’ efforts to advertise the game to attract new
The data collection methodology involves a client-side library de- players.
veloped by us which has been integrated with the game and a mea-
surement server that collects data from the clients that play the game. What properties are exhibited by user sessions?
The goal of the data collection process is to capture different met-
rics that convey the end-users’ experience and interactions when Figure 3 (left) shows the duration of the session lengths in the
they play the game. game. We find that a large fraction of sessions are short lived. For
Table 1 describes the different metrics captured by the our system. example, 55% sessions are less than 10 minutes long. Further, only
We initially started by just capturing session length information but 9% of sessions are more than 60 mins. Figure 3 (right) shows the
over time we have added new capabilities to our system. We ensured CDF of the number of daily sessions per user. Around 26% of users
that the overhead of our library on the client’s device is minimal. play a single session per day while 27% of users play more than 10
Table 2 shows a summary of the game related statistics used for sessions. Figure 4 shows the distribution of the time gaps between
analysis in this paper. consecutive user game sessions per day (the difference between start
time of a session and end time of the previous session for the sameMetric Description
Session length The duration for which a user plays the game before disconnecting from the server.
Platform Device specific information (e.g., model, OS related information).
Location The player’s location during a session (e.g., country and state).
Game related activities such as gathering resources, fighting other players and monsters,
Actions
trading items, sending messages and chats to other players etc.
Food serves as the virtual currency in the game. Players can purchase Food with real
Food consumption
money or through different in-game activities (e.g., selling items).
Table 1: The description of different game related metrics used for our analysis.
0.6
Fraction of sessions
1
0.5
0.8
0.4
0.6
CDF
0.3
Avg. time spent (mins)
0.4 160
0.2
140
0.1 0.2 120
0 0 100
0-10
10-20
20-30
30-40
40-50
50-60
60-70
70-80
80-90
90-100
>100
0 5 10 15 20 25 30 35 40 45 50 80
60 Age 2 Age 3 Age 4
User Sessions per day
40
Session Length (in Minutes)
20
0
Figure 3: (left) Distribution of session lengths, (right) CDF of 0 200 400 600 800 1000 1200
the number of sessions played by a user per day (Oct 20 - Nov Days elapsed
10 2011). 14
Avg. sessions/user
12
1 10 Age 2 Age 3 Age 4
8
0.8 6
0.6
4
CDF
2
0.4 0
0.2 0 200 400 600 800 1000 1200
Days elapsed
0
1 10 100 1000
Time between consecutive sessions (in minutes)
Figure 5: (top) Average time spent daily by players on the game,
(bottom) Average number of daily sessions per player.
Figure 4: Distribution of time periods between consecutive user in the game’s features in Age 2. We see similar increases in average
sessions per day (Oct 20 - Nov 10 2011). The X-axis is shown in play times when Age 3 and Age 4 were released on November 17,
logscale. 2009 (day 380) and October 31st, 2010 (day 728) respectively. Thus,
user). It is interesting to note that 47% of new user sessions tend to as the game becomes more popular and usable (more features and
be within 5 minutes of the end of the previous session. bug fixes, better UI and gameplay), it increases the average time
Such short and closely spaced multiple sessions are partly char- users spend playing the game.
acteristic of application usage on smartphones as has been observed Figure 5 (bottom) shows the average number of daily sessions
before [7]. It is normal user behavior to get distracted and close per user over a period of 1104 days. It can be seen that users usually
the game to use another application such as an email client or stop play more sessions with the release of new upgrades to the game
the game to attend a phone call and then return back to the game. and play fewer sessions when time passes on after the update. For
Also such behavior is partly game specific as observed in desktop example, PK’s players played an average of 9 sessions after the
based MMORPGs [5]. For example, it is common for PK users to release of Age 2 and this decreased to 6 sessions towards the end
login, play for a short while (e.g., feed the dogs) and logoff. Ap- of Age 2. Another example is day 950 (10th June, 2011) when the
plication developers can implement optimizations based on such average sessions per player increase from around 8 to 10 due to ad-
user behavior. For example, instead of discarding a player’s state ditions of new skill levels to the game. It is interesting to note that
(maps, inventory information etc.) from the phone at the end of variations in average user sessions and playtimes have decreased
a session, it is more efficient to save and reuse it during the next over time (Age 2 vs Age 4). One of the important reasons for this
session because almost half of the consecutive user sessions occur behavior is the increase in frequency of game updates during the
within 5 minutes of the previous session. recent months. These updates provide new features and activities to
maintain the game’s appeal and keep players interested in the game.
How does the players’ game sessions and total playtime vary over
time? 4. PLATFORM USAGE CHARACTERIS-
Figure 5 (top) shows daily average time players spent on the game TICS
per day. For the first 150 days, players spent an average of 20 min- In this section, we discuss trends for PK such as its adoption
utes per day. On day 149 (March 28, 2009), when Age 2 of the across different platforms over time and the impact of the form
game was released, we observe a sudden increase in playing time to factor of different devices on the players’ game usage behavior.
around 80 minutes per day. This was because of a significant updateScreen
IPhone + IPod size (in.): 9.7" 3.5" 4.1" 3.4" 3.7" 3.7" 4.3" 4" 3.2" 3.2"
10000
Android 1 Slide out keyboard
IPad
Players per day
8000 0.8
Actions/sec
0.6
6000
0.4
Age 3 Age 4
4000 0.2
2000 0
iPad iPhone Droid MyTouch Droid HTC HTC SGH HTC SGH
Xtreme 3G 2 Vision EVO Captivate Hero Moment
0
Device Model
200 400 600 800 1000 1200
Days elapsed
Figure 8: Normalized number of actions per unit time for tablet
Figure 6: Platforms used by players starting from Age 2 (plat- (iPad), and different phone models. Usability in terms of screen
form info was not recorded for Age 1). size and slide out keyboards are shown (May 2011).
as exploring places on the map, moving the character and attacking
monsters in the vicinity of the player, the user has to perform touch
1
related activities. In these cases, a larger touchscreen allows the
user to perform these activities better and improves his/her experi-
0.8
ence. For example, players can visualize a larger area on the map
0.6 on tablets compared to smartphones and interact with more objects
CDF
0.4 simultaneously on the map.
0.2 Tablet We also analyzed the effect on “user interaction” by measuring
0
Phones the average number of user actions/sec on popular device models
1 10 100 over a period of one week. We chose devices having diverse form
Session Length (in minutes) factors (screen sizes and slide out keyboards) from amongst the
top 20 devices at the time. Figure 8 shows some interesting re-
Figure 7: Session lengths for the tablet (e.g., iPad) and phone sults. We find that tablet (iPad) users perform the highest number
(e.g., iPhone) platforms. The X-axis is shown in logscale. of actions/sec, owing to a larger screen size (9.7" for iPad). We
What are the long term trends in the platform usage for PK? also find that iPhone comes a close second (despite a screen size of
3.5"), possibly indicating the superior quality of iOS user interface.
Figure 6 shows the platforms used by the players on each day Amongst Android device models, we find an interesting trend —
starting from March 28, 2009 (the beginning of Age 2) to Nov 10 devices with smaller screen sizes (e.g., 3.2" for Samsung Moment)
2011, for a total of 954 days. Starting from Age 2, we see a spike experienced less user interactions compared to those with a larger
in the number of iPhone players and they were consistently more screen size (e.g., 4.3" for HTC EVO). However, devices with slide
than Android players (almost double) throughout this age. How- out keyboards (e.g., Droid 2) exhibit higher user interaction com-
ever, starting from Age 3, we find an increasing trend in Android pared to some of the devices with larger screen size (e.g., EVO),
players, who eventually exceed the iPhone players. We talked to the despite small screen sizes (3.4" – 3.7"). These Android devices
developers about this behavior and they told us that one of the main have similar capabilities in terms of CPU and memory. This shows
reasons was more targeted advertising and promotion of the game that a platform’s ease of use can impact application usage.
on the Android platform. Another reason for this trend was due to
the game being ranked the best amongst Android applications in its
category in December 2009.
Besides the releases for new Ages, releases for more platforms
5. IMPACT OF USER INTEREST ON
also positively impacted the game’s daily active usage. On June 28 GAME REVENUES
2010 (day 603), the game was released for iOS 4 and iPad leading In Table 1, we discussed that “Food“ serves as the virtual cur-
to more player attention towards the game. Interestingly, the release rency in the game. Food can be used to buy items from other users
of iOS4 and iPad versions also caused a spike in the game’s usage or merchants, upgrade buildings, train hunting dogs etc. New users
amongst the Android players. are given some initial Food to allow encourage them to explore
the game. The users can obtain more Food by selling items, invit-
How does usability (display screen size, availability of slide out ing friends to start playing the game and by purchasing it using real
keyboards) affect playing time and user interaction? money. Food transactions, therefore, are the main source of revenue
for the developers of Parallel Kingdom. In this section, we analyze
The game UI for both Android and iPhone platforms are very how user interest in the game translates into food consumption. We
similar to each other (Figure 1). We analyzed how “usability” of measure user interest in terms of: (i) the number of actions per-
different platforms may affect the application usage. In particular, formed by the user in the game (Table 1), (ii) session lengths and
we analyzed the effect of (i) size of the display screen and (ii) avail- (iii) ‘user retention‘ which represents the number of days during
ability of slide out QWERTY keyboards. We studied the impact of which the players are active in the game.
using tablets (e.g., iPad) vs smartphones (e.g., iPhone, Droid) on
the users’ session lengths. Figure 7 shows that session lengths are How interactive are the different players in the game? How is user
higher for tablets (a median of 10 minutes for tablets vs 7 minutes interactivity correlated with game revenues?
for smartphones) which typically have larger screen sizes and higher
screen resolution compared to smartphones. This shows that users’ In the game, players perform various kinds of activities such as
attention span towards an application can be sensitive to the form attacking monsters and buildings, buying/selling items and learning
factor of the device that they use. For many actions in PK, such new skills. We recorded these different types of actions performed1
Actions per character
1
0.8
0.8
0.6
CDF
CDF
0.6
0.4
0.4
0.2 0.2 Food burn800 sessions
0 0
1 10 100 1000 10000 0 10 20 30 40 50 60 70 80
Number of actions performed Session length (in minutes)
Figure 9: The CDF of the number of actions performed by dif- Figure 11: The CDF of the session lengths based on the food
ferent players in the game during a week in November 2011. The consumption behavior.
X-axis is shown in logscale.
1
1
Avg. food burnt/player
(Normalized to max.)
0.8
0.8
0.6
CDF
0.6
0.4 0.4
0.2 0.2
0 0
=
0-
0-
0-
00
00
0 50 100 150 200 250
20
30
70
12
-2
00
Retention Period (days)
0
0
00
0
00
Number of actions performed Figure 12: CDF of the player retention periods during Age 2 of
the game.
Figure 10: The average food consumed per player (normalized spending. We divided sessions into two roughly equal sized groups:
to maximum) depending on their interactivity. session that burned more than 800 Food and those that burned less
by the players during each game session. Figure 9 shows the CDF than 800. We find that sessions during with more Food spent tend
of the total number of actions performed by players who played the to be longer than those during which less Food is spent. Thus, it
game during a week in Nov 2011. This graph shows a skewed be- is in the interest of the developers to keep the users involved in the
havior with a few players who are highly active in the game. For game so that the users are enticed to use more virtual currency in
example, around 40% of the players who played the game during the game.
this week performed less than 100 actions while 6% of the players
performed more than 4000 actions during the same period. How long do users stay involved in the game, i.e., what is the distri-
Interactivity is a important indicator of player interest in the bution of retention period of the users?
game. It is in the interest of the game developers if the players
are more interactive as the more interactive players tend to spend To study how many days users continue to play the game, we
more money in the game as shown in Figure 10. This is because compute the number of users joining and leaving the game during
players can spend money to buy resources to expedite their progress Age 2 (March 27, 2009 to November 16, 2009, a total of 235 days).
in the game (e.g., to learn new skills, buy virtual goods etc.). In If a user first played the game on day d1, and if we do not find the
this figure, the players are grouped based on the number of actions player playing the game after day d2, we define d2 − d1 as the
performed by them during a week in Nov 2011 and the average “retention period” of the player, i.e., the total number of days the
amount food consumed (normalized to maximum) by the players player stays in the game. In Age 2, a total of 55,637 users down-
in each bin during this period is shown. The most interactive play- loaded the game and played it at least once. However, we found
ers (the rightmost bin) spent around 25 times the food compared that most users only play for a short number of days before quitting.
to the least interactive players (the leftmost bin). Thus, develop- Figure 12 shows the CDF of retention period. We observe that
ers should continuously monitor players to measure the changes in around 48% of users stay in the game for only for a single day i.e.,
their interactivity over time. To increase the interest of the “passive“ these users download the game, play for a day and never play again.
players (characterized by decreasing interactivity) in the game, the Many popular sites like AppBrain [2] use downloads to indicate
developers should provide incentives to them. For example, they an application’s popularity in an app store. However, we observe
can provide some free virtual currency to these passive players so that downloads alone might not accurately reflect the popularity or
that they can perform more activities in the game. As these players’ user base of an application. For example, only 11,125 users (20%
interest in the game increases, they will be willing to spend more of the downloads) were retained for more than one month during
money in the game. Age 2 in PK. Thus, it is neccessary to keep attracting new players
to maintain and increase the daily active usage of these games.
Do longer session lengths imply more food consumption?
How does the active user period affect application revenues?
We now discuss the impact of player interest in terms of sessions
durations and the amount of food burnt by the players. Figure 11 For this analysis, we analyzed all Food transactions in the game
shows the CDF of session lengths for sessions with non-zero Food for a total of 183 days, from November 2, 2009 to May 3, 2010.Norm. daily food/user 1 7. CONCLUSION
0.8 We presented a study of Parallel Kingdom, a popular mobile
MMORPG by collecting long term data from its player population.
0.6
We used this data to understand the characteristics of such games
0.4 and how different factors affect the usage of this game. We observed
0.2 that the players played multiple consecutive sessions and were also
influenced by the device’s form factor in terms of their attention
0
span and interactions with the game. Further, the players’ interest
0-
20
40
60
80
10
12
14
16
>=
20
in the game (determined by sessions lengths, active periods and in-
-4
-6
-8
-1
0-
0-
0-
0-
18
0
0
0
00
12
14
16
18
0
0
0
0
0
Active Period (days)
teractivity) can be closely correlated to their virtual currency con-
sumption within the game which has a direct impact on the game
Figure 13: (left) CDF of the player retention periods. (right) revenues for the developers.
Active period versus normalized average Food expenditure per
player per day. 8. ACKNOWLEDGMENTS
We define an “active period” of a user as the total number of days We would like to thank the anonymous reviewers whose com-
during which a player plays the game. For example, if a player plays ments helped bring the paper into its final form. All authors are sup-
on day 1 and again on day 5, the active period for the player is two ported in part by the following grants of the US NSF: CNS-1040648,
days. We group active period into bins of 20 days. Figure 13 shows CNS-0916955, CNS-0855201, CNS-0747177, CNS-1064944, and
the relationship between active period and normalized daily average CNS-1059306.
food spent per user. We observe an increasing trend of “food spent
per day” as users play more days in the game i.e., the longer a user 9. REFERENCES
stays in the game, the larger is the amount of Food (and therefore,
[1] Android devlopers. http://developer.android.com/index.html.
money) spent per day. This is especially evident amongst users
[2] Appbrain. http://www.appbrain.com/.
who played the game for more than 180 days. These users spend
2.5× more than users who have played less than 150 days. For [3] Apple hits 25 billion app store downloads.
users with active period less than 20 days, the average Food spent http://www.usatoday.com/tech/news/story/2012-03-05/apple-
is slightly more than some users with longer active periods. This app-downloads/53372352/1.
is because new users are given some initial Food, and many users [4] Apple. iPhone Developer Center.
with short active periods use up their initial allotment of Food and http://developer.apple.com/iphone/.
never buy more. The above data shows that it is crucial to retain [5] C. Chambers, W. chang Feng, S. Sahu, D. Saha, and
old players as they generate more daily revenue per player for the D. Brandt. Characterizing online games. IEEE TON’10.
game. [6] C. Chambers, W.-c. Feng, S. Sahu, and D. Saha.
Measurement-based characterization of a collection of
on-line games. In IMC ’05.
[7] H. Falaki, R. Mahajan, S. Kandula, D. Lymberopoulos,
R. Govindan, and D. Estrin. Diversity in smartphone usage.
6. RELATED WORK In MobiSys ’10.
Chambers et al [6, 5] analyzed some popular online game work- [8] Flurry. Flurry blog.
loads by concentrating on FPS genre of games (Counter-Strike) http://www.theappside.com/2012/01/10/flurry-stats-social-
meant for a different set of users (mainly desktop and laptop users). games/.
In [9], the focus is on the analysis of third party applications for [9] A. Nazir, S. Raza, and C.-N. Chuah. Unveiling facebook: a
OSNs (Online Social networks), one of which is a game. This measurement study of social network based applications. In
study concentrates on the underlying social networking aspects of IMC ’08.
the third party applications. In [10] the authors further studied how [10] A. Nazir, S. Raza, D. Gupta, C.-N. Chuah, and
Facebook forward/process the requests/response from third-party B. Krishnamurthy. Network level footprints of facebook
OSN applications, and its impact on the overall delay performance applications. In IMC ’09.
perceived by end-users. Our study is focused on the a popular
[11] PerBlue. Parallel kingdom.
MMORPG game available for smartphones and handheld platforms
http://www.parallelkingdom.com/.
(Apple’s iOS [4] and the Google’s Android Platform [1]).
Prior research [12, 16, 15] has studied popular MMORPGs such [12] D. Pittman and C. GauthierDickey. A measurement study of
as World of Warcraft and EVE Online to analyze and predict the virtual populations in massively multiplayer online games. In
trends in player populations, distributions and game usage. [16] NetGames ’07.
does a long term study of the game EVE Online but it only focuses [13] D. Pittman and C. GauthierDickey. Characterizing virtual
on the issues of general MMORPG game usage predictability and populations in massively multiplayer online role-playing
player population predictability. The studies [12, 15] based on the games. In Advances in Multimedia Modeling, 2010.
World of Warcraft game are limited to a single realm and do not [14] PocketGamer.biz. Pocketgamer.biz announces its top 10
provide a snapshot of the entire game and about the different play- mobile game developers to watch in 2012.
ers spread across the globe. In [13], Pittman et al. continue their http://www.pocketgamer.biz/r/PG.Biz
work on a larger dataset using two MMORPGs to create a model for /PG.Biz+Top+50+Developers+2012/feature.asp?c=38352.
analysis and simulation of the virtual world and player populations. [15] P.-Y. Tarng, K.-T. Chen, and P. Huang. An analysis of wow
In our study, we analyze properties such as player interactivity and players’ game hours. In NetGames ’08.
factors impacting game revenues in a popular MMORPG meant for [16] W. Feng et al. A long-term study of a popular MMORPG. In
mobile devices. NetGames ’07.You can also read