Predicting Asset Value Through Twitter Buzz
←
→
Page content transcription
If your browser does not render page correctly, please read the page content below
Predicting Asset Value Through Twitter Buzz

                    Xue Zhanga,b, Hauke Fuehresb, Peter A. Gloorb
        a
            Department of Mathematic and Systems Science, National University of Defense
                             Technology, Changsha, Hunan, P.R.China
                    b
                        MIT Center for Collective Intelligence, Cambridge MA, USA

Abstract This paper describes early work trying to predict financial market
movement such as gold price, crude oil price, currency exchange rates and stock
market indicators by analyzing Twitter posts. We collected Twitter feeds for 5
months obtaining a large set of emotional retweets originating from within the US,
from which six public opinion time series containing the keywords “ dollar%t ”,
“ $%t ”, “ gold%t ”, “ oil%t ”, “ job%t ” and “ economy%t ” were extracted. Our
results show that these variables are correlated to and even predictive of the finan-
cial market movement. Except “ $%t ”, all other five public opinion time series are
identified by a Granger-causal relationship with certain market movements. It is
demonstrated that daily changes in the volume of economic topic retweeting seem
to match the value shift occurring in the corresponding market next day.

1 Introduction

             “Prediction is difficult, especially when its about the future” – Niels Bohr

We human beings are always curious about the future. For thousands of years,
people have been trying their best to predict what would happen next. Although
most of these predictions turn out to be wrong, people never give up predicting,
and are continuously trying to improve it. Weather forecasts, earthquake early
warnings, stock market predictions etc. – predictions are an important part in eve-
ryday life. With the popularization of Internet and online social networking, this
time-honored activity enters a new era.
   Recently, a lot of research has been done on prediction with data from social
networks and web searches. Gayo-Avello et al. [1] clearly pointed out that follow-
ing what people are blogging about or what they are searching about can give us
some intuition on the collective psyche and lead us to understand what is currently
happening in society before it is actually happening. Sometimes people refer to
this phenomenon as the “wisdom of the crowd”, that is, taking into account the
opinion of the society as a whole, instead of the opinion of the expert.
   A group of researchers is applying this novel methodology to stock market pre-
diction. Antweiler and Frank [2] determined correlation between activity in Inter-
2 net message boards and stock volatility. Gilbert and Karahalios [3] used over 20 million posts from the LiveJournal website to create an index of the US national mood, which they call the Anxiety Index. They found that when this index rose sharply, the S&P 500 ended the day marginally lower than is expected. Choudhury et al. [4] modeled contextual properties of posts in SVMs (support vector machines) and trained it with stock movement. The result shows about 87% accuracy in predicting the direction of the movement. As one of the most popular social networking websites, Twitter is drawing more and more attention from researchers from different disciplines. There are several streams of research investigating the role of Twitter. One stream of re- search focuses on understanding its usage and community structure [5,6,7,8]. Oth- er researchers are more interested in its prediction power and potential application in other areas. It has been demonstrated that by tracking tweet numbers related to certain topics, both box-office revenues of movies and political elections could be successfully forecasted [9,10]. Also, Twitter has been used in tracking the spread of epidemic disease [11]. Twitter buzz was also employed in predicting the stock market movement. By analyzing the sentiment of a random sample of tweets, Bollen et al. [12] found that public mood can be used to predict the stock market. Furthermore, stock-related tweets with a specific hashtag “$” were collected and studied in detail in [13], where it was found that these tweets contain valuable information that is not fully incorporated in current market indicators. In previous work [14], we also present- ed very preliminary results that the number of emotional tweets, which contain words such as “hope”, “fear” or “worry” correlated with stock market indicators. In this paper, further tests and analysis to predict valuation of tradable assets will be described. The rest of the paper is organized as follows. In section 2, we present our Twit- ter dataset and financial market dataset, laying out how we constructed the public opinion time series. Section 3 discusses the method of determining correlation be- tween Twitter buzz and market movement and presents the results, which are fol- lowed by discussion and future work in section 4. 2 Data Twitter is a worldwide popular website, which offers a social networking and mi- croblogging service, enabling its users to update their status in tweets, follow the people they are interested in, retweet others’ posts and even communicate with them directly. Since it launched in 2006, its user base has been growing exponen- tially. As of June 2011, it is estimated to have 200 million users, generating 190 million tweets a day and handling over 1.6 billion search queries per day. The ris- ing popularity of twitter gives us a novel way of capturing the collective mind up to the last minute. In this section, we introduce the datasets that form the basis of the work described in this paper.
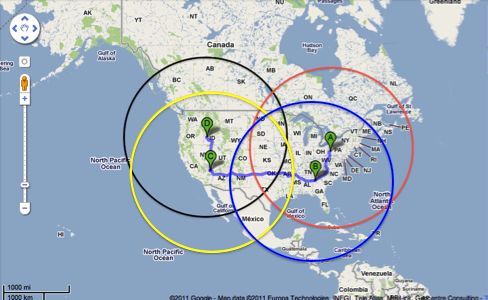
3

2.1 Twitter Data Collection

We collected a large set of tweets submitted to Twitter in the period from Novem-
ber 15, 2010 to April 20, 2011. In order to get a better picture of the opinion and
emotional state of the US investors, we only filter for emotional retweets that
come from the United States. In other words, all the data we collected meets the
following conditions:
   Retweets only. Structurally, retweeting is the Twitter-equivalent of email for-
warding where users post messages originally posted by others. As an integral part
of the Twitter experience, the retweeting phenomenon has been explicitly studied
in prior research [7]. It is generally believed that the more a topic is being picked
up and retweeted by others, the more it is relevant and widely recognized. Alt-
hough there is no universally agreed-upon syntax for retweeting, “RT @user mes-
sage” is the prototypical formulation where the referenced user is the original au-
thor and message is the original tweet’s content, therefore we choose “RT @” as
our indicator of retweets.
   Containing the emotion words “hope”, “fear” or “worry”. Emotional state
greatly influences human decisions, which obviously include the appropriate
choice of an investment strategy [15,16,17,18,19]. When people are pessimistic or
uncertain about their future, they will be more cautious to invest and trade. There-
fore capturing the collective mind – especially people’s mood – becomes one pos-
sible way to predict the future. To be consistent with and further test previous
work, we only take into account the retweets that contain the words “hope”,
“fear” or “worry”, because we had found in earlier work [14] that these words are
excellent indicators of emotion-laden tweets.
   Originating from the US. The goal of this paper is to analyze whether Twitter
buzz can be helpful in forecasting selected economic indicators of the US econo-
my. For the purpose of better capturing the opinion and emotional state of the US
population, we intentionally limit the targeted tweets to the ones originating from
within the continental United States without Alaska. Tweets were collected within
four 2000-kilometers circles with centers in Pittsburg, Atlanta, Las Vegas and
Boise respectively. As Figure 1 shows, these circles cover the contiguous United
States and parts of Canada and Mexico.
   Over the duration of five months, 3,809,437 retweets posted by approximately
961,000 users were collected and each tweet has a unique identifier, time of sub-
mission and the textual content. Table 1 summarizes the daily number of retweets
related to each emotional word. As we can see, the daily retweet rate of each emo-
tion word is highly variable, for example, the hope-retweets range from 6453 to
34805 per day. Even more interestingly, the number of hope-retweets is much
higher than the fear or worry ones, almost six times on average, which might sug-
gest that people prefer using optimistic words when they express their feelings,
even when they are worrying or in fear.
4

Fig. 1 Geographical origin of Twitter data: A is Pittsburg, B is Atlanta, C is Las Vegas and D is Boise

                            Table 1 Daily number of emotional retweets

                                    Average per day Min per day Max per day

                 Hope-retweet#      20613               6453           34805
                 Fear-retweet#      3710                853            7555
                 Worry-retweet# 3653                    1071           7397
                 Total#             27977               11395          46209

2.2 Generating public opinion time series

In this section, we further discuss how to extract posts in regard to economic top-
ics from our emotional retweets dataset. As twitter users can share only short tex-
tual messages with no more than 140 characters per post, there is always only one
topic in one tweet. No matter if it is a piece of news announcing the death of Osa-
ma bin Laden or a conversation between two friends talking about the wonderful
birthday party, owing to the length limitation, the tweet stays on the same topic.
Thus the main theme of the whole tweet can usually be subsumed by one or two
keywords.
   Inspired by this property, a list of words related to economy was selected as a
clue for economic tweets. This list of keywords includes “dollar”, “$”, “gold”
“oil”, “job” and “economy”. Then we measured collective opinion on each day
by simply counting how many retweets contain these words. As the total number
of retweets varies highly from day to day, a normalized number was chosen as a
measurement of public opinion on day t. For example, we counted the number of
retweets containing the word “dollar” and normalized it by the total retweet num-
ber on the same day t, this normalized retweet number is listed as “ dollar%t ”.
Figure 2 below illustrates all 6 public opinion time series.
5
(a) dollar%t (b) $%t
(c) gold%t (d) oil%t
(e) job%t (f) economy%t
Fig. 2 Public opinion time series
2.3 Market Data
In this section, we look at different categories of assets including the gold price,
crude oil price, currency exchange rates and stock market indicators. For our anal-
ysis we have taken the daily price of gold (dollars per ounce), WTI Cushing crude
oil price (dollars per barrel), currency exchange rates (USD/CHF), Dow Jones In-
dustrial Average (DJIA), NASDAQ and S&P 500 all collected during the same
period as the Twitter data.6
(a) DJIA (b) NASDAQ
(c) S&P 500 (d) oil price (dollars per barrel)
(e) gold price (dollars per ounce) (f) currency exchange rates (USD/CHF)
Fig. 3 Market time series
From Figure 3, we can see that although there is much fluctuation, the overall
trend in this period of stock market, crude oil and gold price is all up. However, in
contrast, the exchange rate of USD to CHF declined almost 10% at the same time.
Obviously, all these market time series are non-stationary. To meet the require-
ment of stationarity in time series analysis, data are processed in the following
way. Taking DJIA as an example, the stock movement at a day t is defined as the
normalized change in stock close price from the past day, which can be expressed
as
DJIAt ! DJIAt!1
Dt = , (1)
DJIAt!1
where DJIAt is the close price of day t. Similarly, we determine the other inde-
pendent variables. Using these new relative variables, we not only can tell the7
change direction of the market which is indicated by the sign of the number, but
alsoalso measure how much it changed compared to the previous day.
NASDAQt ! NASDAQt!1 S & Pt ! S & Pt!1
Nt = (2) St = (3)
NASDAQt!1 S & Pt!1
Oilt ! Oilt!1 Goldt ! Goldt!1
Ot = (4) Gt = (5)
Oilt!1 Goldt!1
USDt ! USDt!1
Ut = (6)
USDt!1
3 Methods and Results
3.1 Correlation between public opinion and market time series
To obtain a first indication whether the Twitter information might help forecast
the asset value, we analyzed the correlation between the two time series. Tables 2
to 4 illustrate correlation coefficients between market movement on day t and
Twitter buzz of day t-i (i=1,2,3) separately.
In Table 2, we observe a relatively strong correlation between stock market re-
turn and “ dollar%t!1 ” (r = 0.308**, 0.203 and 0.259*, p-value = 0.004, 0.058 and
0.015). In addition, not only “ oil%t!1 ” but also “ economy%t!1 ” is strongly corre-
lated with oil price changes of day t (r = 0.295** and 0.214*, p-value = 0.006 and
0.046). Even more interestingly, we found that the correlation between “ gold%t!1
” and Gt is weak, but “ gold%t!1 ” is significantly correlated with Ut (r = 0.213*,
p-value = 0.016), indicating a relationship between the gold price and the strength
of the US dollar. Furthermore, it is worth noticing that all the correlation coeffi-
cients mentioned above are positive, which implies that an increase in economic
topic retweeting seems to indicate an increase in the value of the corresponding
asset on the next market day.
In contrast, the relationships between market movement and time series “ $% ”
and “ job% ” are not that significant in this period. Additionally, the Twitter buzz
of two or three days before seems to have less influence on the market movement
of day t (see Tables 3 and 4).8
Table 2 Correlation coefficient between market movement and Twitter buzz 1 day before
Dt Nt St Ot Gt Ut
dollar%t!1 .308** .203 .259* .012 -.112 -.055
$%t!1 .108 .062 .116 .004 -.080 -.122
gold%t!1 .122 .055 .088 -.034 -.053 .213*
oil%t!1 .022 .018 .054 .295** .108 .072
job%t!1 -.035 .000 -.013 -.165 -.203 .167
economy%t!1 -.142 -.186 -.147 .214 *
-.011 -.021
Table 3 Correlation coefficient between market movement and Twitter buzz 2 day before
Dt Nt St Ot Gt Ut
dollar%t!2 .106 .040 .065 -.148 -.078 .122
$%t!2 .040 .025 .033 -.099 .077 -.131
gold%t!2 -.032 -.013 -.041 .020 .089 .064
oil%t!2 .004 -.039 -.019 .201 -.004 -.123
job%t!2 .094 .101 .108 -.151 -.116 .081
economy%t!2 -.073 -.068 -.030 .121 .020 -.039
Table 4 Correlation coefficient between market movement and Twitter buzz 3 day before
Dt Nt St Ot Gt Ut
dollar%t!3 .018 .010 .026 -.013 -.273* -.088
$%t!3 -.198 -.179 -.176 -.109 -.048 -.142
gold%t!3 .020 .024 .007 -.033 .030 .133
oil%t!3 .033 .077 .069 .039 -.039 -.017
job%t!3 .126 .156 .130 -.132 -.141 .093
economy%t!3 -.086 -.025 -.029 .031 .152 -.1189
3.2 Granger-causality Analysis
In this section we apply Granger causality analysis to the daily time series of pub-
lic opinion vs. financial market movement. Granger causality is a statistical con-
cept of causality that is based on prediction. According to Granger causality, if a
signal X “Granger-causes” (or “G-causes”) a signal Y, then past values of X
should contain information that helps predict Y above and beyond the information
contained in past values of Y alone. Its mathematical formulation is based on line-
ar regression modeling of stochastic processes (Granger 1969). It is noteworthy
that in spite of its name, Granger causality is not sufficient to imply true causality.
If both X and Y are driven by a common third process with different lags, X might
erroneously be believed to “Granger-cause” Y. However, in our project, we are not
testing the actual causation but simply whether one variable provides predictive
information about the other one or not.
Granger causality requires that the time series have to be covariance stationary,
so an Augmented Dickey-Fuller test has been done first, in which the null hypoth-
esis H0 of non-stationarity was rejected at the 0.05 confidence level. Again, all
Twitter buzz and market movement time series were verified to be stationary.
To test whether public opinion time series “Granger-cause” the changes in fi-
nancial market valuation, two linear regression models were applied as shown in
equations 7 and 8. The first model ( M1 ) uses only n lagged values of market data
to predict Yt , while the second model ( M 2 ) also includes the lagged value of pub-
lic opinion time series, which are denoted by Xt!1 , ... , Xt!n . In order to find an
appropriate number of lags, we set the lag parameter n equal to 1, 2 and 3 sepa-
rately.
n
M1 : Yt = ! + " "iYt!i + # t (7)
i=1
n n
M 2 : Yt = ! + " "iYt!i + " # j Xt! j + $ t (8)
i=1 j=1
After establishing the linear regression equations, a statistics f is defined as
" SSR1 ! SSR2 %
$# '&
n
f = (9)
" SSR2 %
$# '
m ! 2n !1&
where SSR1 and SSR2 are the two sum of squares residuals of equations 7 and 8; m
is the number of observations. Theoretically, f ~ F(n, m ! 2n !1) . Thus, the ques-10
tion whether X “Granger-causes” Y could be solved by simply checking the p-
values.
From Table 5 we can easily draw the conclusion that Twitter buzz indeed has
some information that can be used in predicting financial market movement. We
observe that “ dollar%t ” has the highest Granger causality relation with stock
market return, especially with the DJIA return (p-value < 0.01 when n=1 and re-
mains significant when n=2 and 3). Also, the “ oil%t ” time series “Granger-
causes” the changes in oil price (p-value is always less than 0.05 when lag varies
from 1 to 3 days). The other two predictive variables are “ gold%t ” and “ job%t ”,
which have Granger causality relation with Ut and Gt separately. However, the
most interesting aspect is that the “ gold%t ” time series failed in explaining the
price change in the gold market, but could help predict the currency exchange
rates (USD/CHF). We speculate that currency fluctuation, and the underlying lack
in confidence in the national economy influence the eagerness of buyers to invest
into the “safe haven” gold.
Table 5 Statistical significance (p-value) of bivariate Granger causality correlation between
Twitter buzz and financial market movement (p-value < 0.05: *, p-value < 0.01: **)
Lag Dt Nt St Ot Gt Ut
n =1 .0039** .0494* .0165* .9588 .2877 .3131
dollar%t n=2 .0203* .2405 .124 .3174 .3301 .1014
n=3 .0272* .3869 .1803 .4251 .0527 .0802
n =1 .3309 .5538 .2966 .9033 .4887 .2315
$%t n=2 .9919 .9864 .9849 .7672 .6766 .357
n=3 .2369 .3818 .3967 .8694 .7855 .3395
n =1 .286 .5908 .4459 .7685 .5943 .0053*
gold%t n=2 .3047 .7991 .572 .8669 .7787 .0306*
n=3 .3267 .8883 .7072 .9317 .9964 .0518
n =1 .9036 .7989 .6828 .0164* .2359 .6347
oil%t n=2 .8657 .4439 .7809 .0096** .3672 .6156
n=3 .9102 .5801 .864 .0225* .3668 .3782
n =1 .7542 .9812 .9222 .1668 .0413* .1167
job%t n=2 .2322 .3358 .204 .3986 .194 .3919
n=3 .4879 .5408 .4544 .3697 .0896 .627111
n =1 .1978 .0819 .183 .0558 .8752 .591
economy%t n=2 .6916 .297 .5575 .1293 .9446 .7235
n=3 .6592 .4267 .6904 .1896 .4743 .3417
4 Discussions
In this paper, we investigated the relationship between Twitter buzz and financial
market movement. Our results statistically show that public opinion measured
from large-scale collection of emotional retweets is correlated to and even predic-
tive of the financial market movement. Except “ $%t ”, all other five public opin-
ion time series are identified in a Granger-causal relationship with selected asset
valuation movements. The changes in the volume of economic topic retweeting
seems to match the value shift occurring in corresponding next market day.
However, there are still a number of important factors not acknowledged in our
analysis to be studied in future work. First, unlike the prior work of [12] and [13],
when we extracted the public opinion from Twitter, we neither constrained our da-
ta to those stock-related tweets which have a specific hashtag nor use sentiment
analysis tools to measure the public mood from a random sample of tweets. We
chose a few keywords to identify the emotional retweets talking about economic
activity, then use volume change to track the public opinion. This method is sim-
ple and useful. It however does not linguistically analyze the content of tweets,
which might offer additional valuable information. Advanced sentiment analysis
could be employed in future work to improve our results. Second, the analyzing
methods we used in this paper, both the correlation and Granger causality analysis,
are based on the assumption that the relation between variables is linear, which is
hardly satisfied for financial market movement. More advanced tools that can bet-
ter characterize the non-linear relationship between variables, such as Neural
Networks and Support Vector Machines, should also be explored in future work.
Reference
1. Gayo-Avello, D., Metaxas, P.T. & Mustafaraj. E. (2011). On the Unpredictability of Elections
using Social Media Data. Interdisciplinary Workshop on Information and Decision in Social
Networks, MIT.
2. Antweiler, W., & Frank, M.Z. (2004). Is All That Talk Just Noise? The Information Content
of Internet Stock Message Boards. Journal of Finance, 59(3), 1259-1294.
3. Gilbert, E., & Karahalios, K. (2010). Widespread Worry and the Stock Market. In Proceed-
ings of the 4th International AAAI Conference on Weblogs and Social Media (ICWSM).12
4. Choudhury, M.D., Sundaram, H., John, A., & Seligmann, D.D. (2010). Can Blog Communi-
cation Dynamics be Correlated with Stock Market Activity? In Proceedings of the 9th ACM
Conference on Hypertext and Hypermedia. doi:10.1145/1379092.1379106.
5. Java, A., Song, X., Finin, T., & Tseng, B. (2007) Why We Twitter: Understanding Mi-
croblogging Usage and Communities. In Proceeding of 9th WebKDD and 1st SNA-KDD work-
shop on web mining and social network analysis. doi:10.1145/1348549.1348556.
6. Huberman, B.A., Romero, D.M., & Wu F. (2009). Social networks that matter: Twitter under
the microscope. First Monday, 14(1).
7. Boyd, D., Golder, S., & Lotan, G. (2010). Tweet, Tweet, Retweet: Conversational Aspects of
Retweeting on Twitter. In Proceeding of 43rd Hawaii International Conference on System
Sciences (HICSS). doi: 10.1109/HICSS.2010.412.
8. Wu, S., Hofman, J.M., Mason, W.A., & Watts, D.J. (2011). Who says What to Whom on
Twitter. In Proceedings of the 20th International Conference on World Wide Web.
doi:10.1145/1963405.1963504.
9. Asur, S., & Huberman, B.A. Predicting the Future With Social Media. (2010). In Proceedings
of the 2010 IEEE/WIC/ACM International Conference on Web Intelligence and Intelligent
Agent Technology. doi: 10.1109/WI-IAT.2010.63.
10. Tumasjan, A., Sprenger, T.O., Sandner P.G., & Welpe I.M. (2010). Predicting Elections with
Twitter: What 140 Characters Reveal about Political Sentiment. In Proceedings of the 4th In-
ternational AAAI Conference on Weblogs and Social Media (ICWSM).
11. Lampos, V., & Cristianini, N. (2010). Tracking the flu pandemic by monitoring the Social
Web. IAPR 2nd Workshop on Cognitive Information Processing. doi:
10.1109/CIP.2010.5604088.
12. Bollen, J., Mao, H., & Zheng, X.J. (2011). Twitter mood predicts the stock market. Journal
of Computational Science, 2(1), 1-8.
13. Sprenger, T.O., Welpe, I.M. (2010). Tweets and Trades – The Information Content of Stock
Microblogs. Available at SSRN: http://ssrn.com/abstract=1702854.
14 Zhang, X., Fuehres, H., & Gloor, P. (2010). Predicting Stock Market Indicators Through
Twitter: “I hope it is not as bad as I fear”. Available at:
http://www.ickn.org/documents/COINs2010_Twitter4.pdf
15. Loewenstein,G.F., Weber, E.U., Hsee, C.K., & Welch, N. (2001). Risk as Feeling. Psycho-
logical Bulletin, 127(2), 267-286.
16. Lerner, J., & Keltner, D. (2001). Fear,Anger, and Risk. Journal of Personality and Social
Psychology, 81(1), 146-159.
17. Dolan, R.J. (2002). Emotion, cognition, and behavior. Science, 298(5596), 1191-1194.
18. Lener, J.S., Small, D.A. & Loewenstein, G. (2004). Heart strings and Purse Strings: Carryo-
ver Effects of Emotions on Economic Decisions. Psychological Science, 15, 337-341.
19. Shiv, B., Loewenstein, G., Bechara, A., Damasio, H., & Damasio, A.R. (2005). Investment
Behavior and the Negative Side of Emotion. Psychological Science, 16, 435-439.You can also read