ANNUAL REVIEW 2014 OUTLOOK 2015 - Residential Property Market - DNG
←
→
Page content transcription
If your browser does not render page correctly, please read the page content below
ANNUAL
REVIEW 2014
OUTLOOK 2015

Residential Property Market
Outlook 2015

                                                                             KEITH LOWE
                                                                             CHIEF EXECUTIVE DNG

BEFORE LOOKING FORWARD AT 2015 A BETTER STARTING POINT IS TO                                                 mortgages were extremely difficult to secure, schemes were left half built and housing needs were ignored.
BRIEFLY REVIEW WHAT HAS HAPPENED IN THE RECENT PAST AS IT IS THIS                                            The majority of people believed articles in the media which referred to multiple tens of thousands of vacant
                                                                                                             houses all over the country and hence assumed that there was no need for construction. In reality, the real
THAT WILL SHAPE THE MARKET IN THE YEAR AHEAD.
                                                                                                             number of vacant property was vastly overstated and as the population increased, any completed vacant
The residential property market in Dublin performed better last year than it has in any of the preceding     stock in Dublin and other large cities was either let or sold. There has also been a natural gravitation of the
seven years since the property market took a turn for the worst in Q3, of 2006 onwards. It was the second    population towards Dublin and other key employment areas.
half of 2012 before an upturn was reached and recovery has continued since then.
                                                                                                             Add to this lack of building, the fact that NAMA and many financial institutions are now selling off
As is normal, recovery started in the capital and it has rippled its way across the suburbs and out to the   swathes of loans and properties in large portfolios. This is exacerbating the lack of supply of properties in
environs of the city. Now improvements are also notable in the majority of the satellite towns surrounding   most urban areas. NAMA, as an example, are selling full apartment schemes in singular lots rather than
Dublin. Large urban areas with high employment levels outside of Dublin such as Galway, Cork, Sligo          individually which was what they used to do. A number of financial institutions have recently bundled
and Kilkenny have also shown signs of improvement and one will soon see the ripple effect of these           hundreds of properties into single portfolios to sell unencumbered by their loans. Again, up to recently,
improvements in the large urban centres spreading outwards. However, there are some areas of the             these houses and apartments would have been made available to individual first time buyers and people
country that have still not recovered due to oversupply and local economic factors.                          trading up, down-sizers and single investors through estate agents up and down the country. Time will
                                                                                                             tell whether this wholesale form of selling property to international hedge funds and investment vehicles
Following the strong price growth more or less over a ten year period the market practically stalled in      has been a wise move for all concerned or whether it would have been better for the banks to sell these
2006. There was no building as developers were, in the main, insolvent, house and site prices collapsed,     properties over a period of time to reap the rewards of a recovering market.

 Annual Review 2014 | Outlook 2015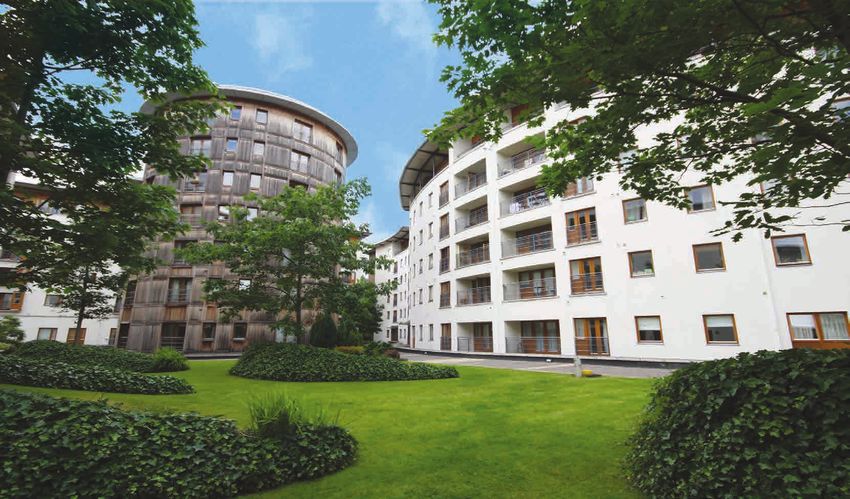
AT A GLANCE
As a result of little or no building and wholesale portfolio sales to foreign investors plus a growing
population, both rents and house prices have increased strongly over 2014.                                                 1         Transactions per population in Q4 2014 - indicating that
                                                                                                                                     the market in Ireland is still not operating normally.
Unfortunately the prospect for any significant level of new home building in Dublin is still somewhat bleak
as there is essentially no bank funding available for construction and many leading builders have now
become reliant on high interest funding from investment funds. Last year there were around 11,000 new
homes completed in the country but most of these units are one-off houses or part built schemes which
have been completed out. The situation is predicted to be similar this year.

It is clear that whilst the property market in Ireland is showing signs of recovery, it is still not operating normally.
Transactions per population were estimated by DNG Research at 2.9% in Q4 2014 (latest data available).
Comparing this to Northern Ireland where the figure is at 3.5% and England, Scotland and Wales Scotland
which are 4.4%-5.1% for the same period, it is clear that the market in Ireland is still not operating normally.

Property prices rose by an average of 1.9% per month last year but the main burst of house price inflation
was in the first 6 months of the year. The reason for this sharp rise, which was inevitable, was that property
prices had fallen too far and too quickly and had essentially overshot. It is also fair to say that the advent
of wholesaling mass property portfolios and apartment buildings sustained this price inflation.

Taking everything into account it is likely that this level of price growth will moderate to in or around                       IRELAND 2.9%                                  Wales 4.4%
5%-10% this year with some areas of the market performing better than others. It should be noted that
                                                                                                                                NORTHEN IRELAND 3.5%                          SCOTLAND 4.7%
property prices still remain on average 49% below peak in the capital.
                                                                                                                                                                              ENGLAND 5.1%
The number of house sales in Dublin rose by 34% in the first 9 months of 2014 according to the Property
Price Register (final 2014 figures not available until February 2015). However, when you look behind the
                                                                                                                           2
headline figures one can now see that this level of increased transaction levels includes a number of very                                       2014                                            2015
large asset sales such as multi hundred apartment block sales and bank portfolio sales. This means that
recovery has been probably somewhat overstated. We estimate that transaction levels will rise by around
15% this year for normal house sales as the market continues its current recovery.                                                       1.9%                                         0.66%
Finally, the Central Bank of Ireland are currently considering mortgage restrictions both in terms of                          Property prices In DUBLIN rose by an           Expected average property price rise
capping multiples of salary to 3.5 and mortgages to 80% of their value for homes and 60% for buy to                            average of 1.9% per month in 2014.             In Dublin of 0.66% per month in 2015.
let property. It is difficult to work out exactly what effect this will have on the market until clarity on the
new rules is achieved.
                                                                                                                           3           2014
                                                                                                                                                     34%
                                                                                                                                                                      House sales in Dublin
                                                                                                                                                                      rose by 34% in the first
                                                                                                                                                                      nine months of 2014.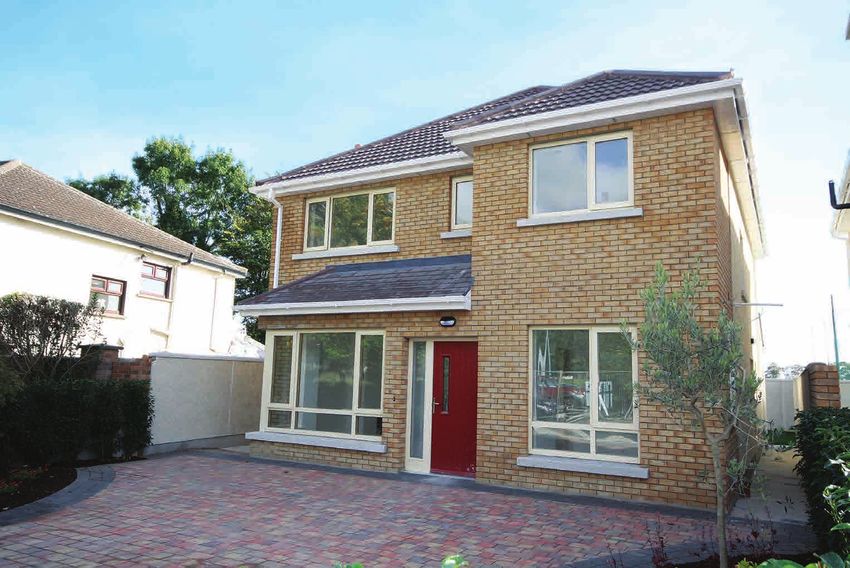
DNG House Price Gauge Q4 2014
                               KEY FINDINGS                                         HEADLINE RESULTS
                     23.5%                                                         Average Dublin Second Hand Price
                                       Dublin Residential property prices
                                       increase by 23.5% on average in 2014.               €373,981

                                                                                      Percentage Change Q4 2014
                                       Price inflation eased in final quarter
                                2.2%   of year, recorded at 2.2%                              2.2%

                                       The average price of a residential             Annual Percentage Change
                                       property in the capital now stands
                                       at €373,981 .                                         23.5%

                                       Supply constraints remain the primary
                                                                                     % Change Since Low (Q2 2012)
                                       driver of price inflation in the capital.
                                                                                             54.4%

                                       Prices now 47% below their peak              % Change From Peak (Q3 2006)
 47%                         54%       value but 54% higher than at the
 below                       HIGHER    bottom of the market.                                -47.8%

Annual Review 2014 | Outlook 2015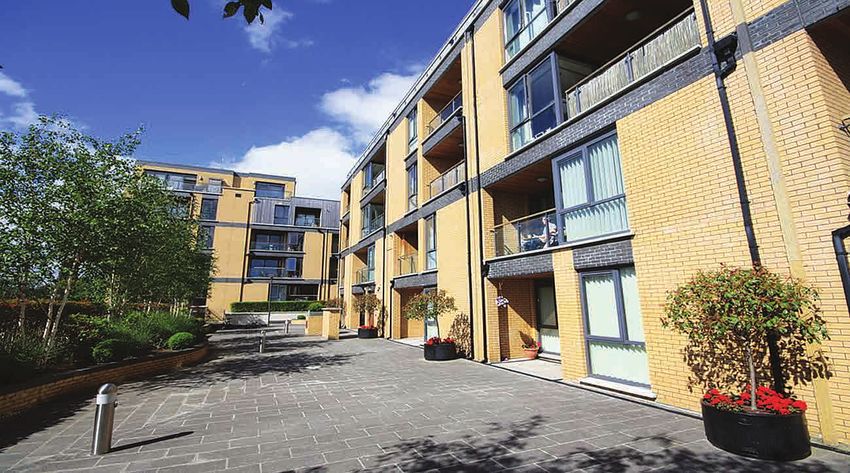
QUARTERLY RESULTS ANNUAL PERCENTAGE CHANGE
The latest results from the DNG House Price Gauge (HPG) recorded a further increase in Figure 2 below shows the annual rate of property price inflation as record by the HPG over
values in the capital in the final quarter of 2014, with prices rising by 2.2% on average. the previous twelve months. In line with the easing rate of price growth seen in the quarterly
figures, the annual rate of increase recorded by the HPG for the full year to the end of
As shown in the graph below, 2014 was characterised by rising prices in Dublin throughout
December 2014 was 23.5% down from 24.2% in the year to the end of September 2014.
the year, however the trend for the year was in contrast to 2013, as the rate of increase
recorded by the HPG eased in each successive quarter of the year. Indeed, the latest Judging by the recent HPG results it would appear that the annual rate of property
quarterly results were in stark contrast to the first quarter of 2014, when prices increased price inflation peaked at 25.2% in the twelve months to the end of June 2014 and the
by 8.9%, and the rate of increase in the final three months of the year was less than half latest emerging trend of more sustainable annual growth in prices is to be welcomed.
the rate recorded in the third quarter (4.8%). However, it must be noted that the full year results for 2014 of 23.5% average price
growth, is higher than the figure recorded for 2013 as a whole (17.8%).
The latest results mean that the average price of a resale property in Dublin has now
risen for the tenth consecutive quarter and the average price of a resale property in The latest HPG results mean that residential property prices in the capital are now
the capital now stands at €373,981 up from €365,857 at the end of September, and 47.8% below their peak levels, as the market continues to recover, particularly in the
€63,000 higher than at the end of 2013 when the average price stood at €302,846. capital and since the floor of the market in 2012, prices have now risen by 54% since
that low point in the cycle.
25
15
5
-5
$
-15
-25
Q4 2012 - Q4 2013
Q4 2010 - Q4 2011
Q1 2011 - Q1 2012
Q2 2011 - Q2 2012
Q3 2011 - Q3 2 012
Q4 2011 - Q4 2012
Q1 2012 - Q1 2013
Q2 2012 - Q2 2013
Q3 2012 - Q3 2013
Q1 2013 - Q1 2014
Q2 2013 - Q2 2014
Q3 2013 - Q3 2014
Q4 2013 - Q4 2014
Q2 2010 - Q2 2011
Q3 2010 - Q3 2011
Figure 1: Quarterly percentage chanGe in Dublin residential property prices Figure 2: annual percentage chanGe in Dublin residential property prices
Annual Review 2014 | Outlook 2015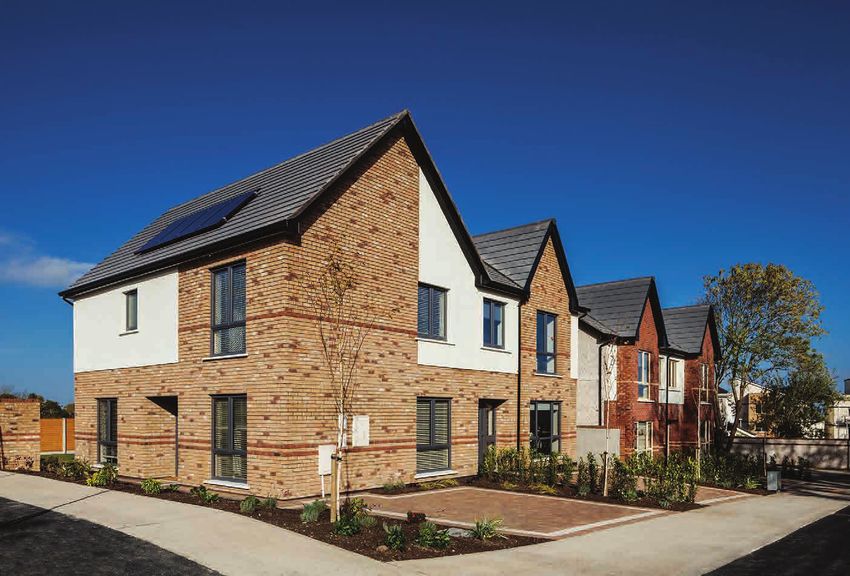
DNG House Price Gauge Q4 2014
               PRICE CHANGES BY LOCATION
 As part of the series, the DNG HPG examines price movements by geographical location within                                   Q4 2014          ANNUAL % CHANGE              FROM PEAK (Q3 06)        From Trough (Q2 2012)
 Dublin and its environs as shown in Table 1.
                                                                                                                SOUTHSIDE        2.0%                   21.1%                      -51.7%                       52.3%
 The average price of a resale property continued to rise across all areas of the capital in the final three
 months of the year with prices rising by around the average of 2% in south and west Dublin, however            NORTHSIDE        2.9%                   24.4%                      -44.9%                       55.0%
 the northside saw price inflation in excess of this at 2.9% in the fourth quarter. All areas of the city
                                                                                                                 WESTSIDE        1.8%                   28.9%                      -53.7%                       49.4%
 saw annual price inflation in excess of the overall average for the capital during 2014 as a whole. Of
 particular note is the 28.9% increase in values seen in west Dublin over the course of 2014, where
                                                                                                                            Table 1: Price changes by LOCATIOn
 prices rose at a faster rate in percentage terms than the rest of the capital. Prices in west Dublin are on
 average at the lower end of the price spectrum and strong demand at this level from first time buyers
 contributed better performance in this area.

 Overall prices in all areas of the city remain approximately 50% below their peak levels and 50%
 above the lowest point in the market as recorded by the HPG
                                                                                                                                  PRICE CHANGES BY PRICE BRACKET
                                                                                                                               Table 2 shows prices at all levels in the market continued to rise throughout 2014. Only
                                                                                                                               the higher end of the market recorded price increases lower than the overall HPG average
                                                                                                                               in 2014, with prices in the range above €500,000 rising by 17.4% on average. In contrast,
                                                                                                                               property price inflation at the entry level to the market (values less than €250,000) saw a
                        Q4 2014            ANNUAL % CHANGE                FROM PEAK (Q3 06)         From Trough (Q2 2012)
                                                                                                                               rate of increase of almost 40%, double the rate of increase seen at the top end of the market,
         Up to                                                                                                                 and the market as a whole in 2014.
      €250,000             3.1%                     39.7%                       -48.9%                         65.4%
  €251,000 to                                                                                                                  All price brackets saw price increases in line with the overall HPG average in quarter four,
    €350,001               2.3%                     26.1%                       -39.4%                         55.2%
                                                                                                                               with the exception again of the entry level to the market where prices rose by 3.1% on
  €351,000 to              1.9%                     21.8%                       -40.3%                                         average. Prices at this level of the market are now 65% higher than at the market low point
    €500,000                                                                                                   55.0%
                                                                                                                               but remain approximately 50% below their peak.
Over €500,000              2.0%                     17.4%                       -55.7%                         49.4%
                                                                                                                               Prices at the higher end of the market remain 55% below their peak values, indicating a
                    Table 2: Price changes by Price Bracket                                                                    slightly slower rate of recovery than seen at other levels, and significantly prices in the range
                                                                                                                               €251,000 - €€350,000 have recovered the best since the peak of the market with values
                                                                                                                               now standing only 40% below peak levels.

  Annual Review 2014 | Outlook 2015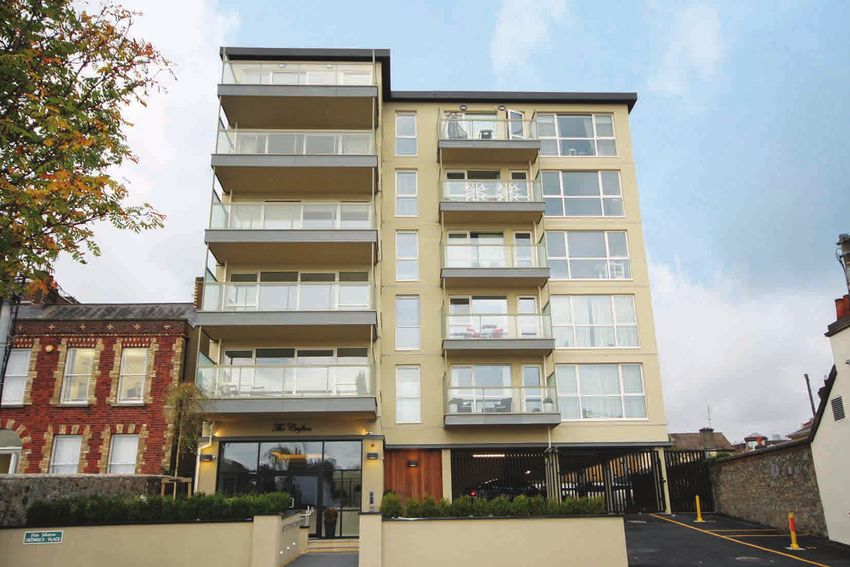
DNG HPG & CSO RPPI DUBLIN
A comparison of the DNG House Price Gauge (HPG)
and the Residential Property Price Index (RPPI),
compiled by the Central Statistics Office reveals a very
similar trend in the pattern of quarterly residential
property price changes as shown opposite.

With the exception of quarter one, where the CSO
RPPI recorded a decline in prices in Dublin, the
two measurements of property price movements
have followed a very similar trend over the course
of the year. Of note is the fact that the CSO RPPI
has recorded greater quarterly increases than the
DNG HPG although the trend of both measurements
remains broadly similar in that both show an easing
of the pace of price inflation as the year progressed.

                                                            FIGURE 3: DNG HPG & CSO RESIdential property price index for dublin property
Figure 4 opposite maps the annual change in Dublin
residential property prices from 2006 through to
2014 and again the trend is very similar in both sets
of statistics. Whist the full year data for 2014 is not
yet available for the CSO RPPI, it is clear that the rate
of annual change in prices will be broadly similar. The
latest available data from the CSO for October 2014
shows that the rate of residential property price rises
in Dublin stands at 22% from the period January to
October 2014.

                                                            FIGURE4: annual percentage change in dublin residential property prices

                                                                                                                                           Annual Review 2014 | Outlook 2015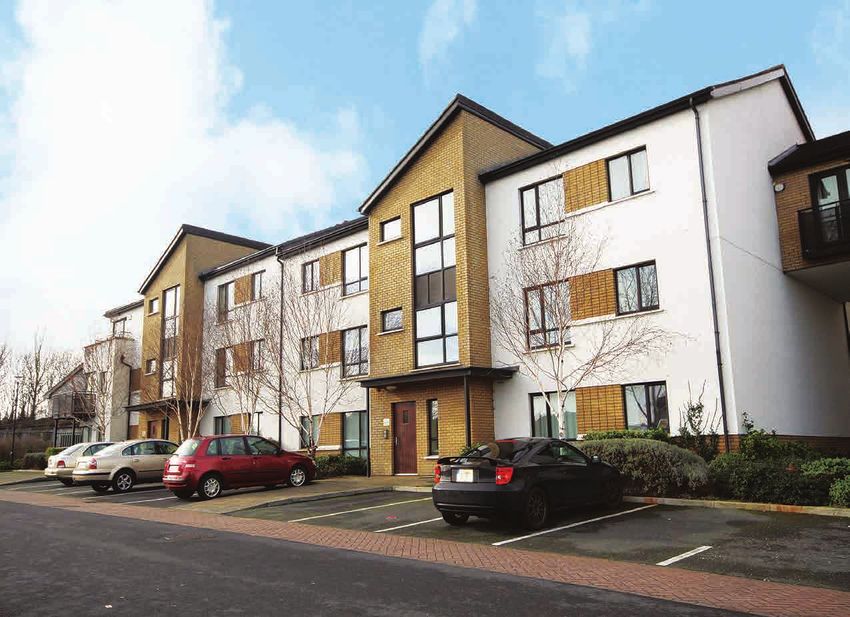
Outlook for the housing section for 2015

                                                                               HUBERT FITZPATRICK
                                                                               DIRECTOR CONSTRUCTION INDUSTRY FEDERATION

AS ALL THE FORECASTED REQUIREMENTS FOR NEW HOUSING OUTPUT PREDICT SUSTAINABLE
DEMAND FOR UP TO 25,000 UNITS ANNUALLY, ONE HAS TO ASK THE QUESTION ‘WHY
SUSTAINABLE DEMAND FOR NEW HOUSING IS NOT BEING MET BY THE LEVEL OF NEW
BUILDING ACTIVITY TAKING PLACE?

In particular, the Housing Agency published its report in April 2014 predicting that the requirement for new               •   Many planning permissions must be revised to take account of the type of housing unit that is now
housing in urban settlements nationally ranged from 9,526 units in 2014 to 20,853 units in 2018. Within                        sought in the market place compared to that which prevailed at the time planning permission may
the Dublin region, the figures show that there’s an immediate supply requirement of 5,663 units in 2014                        have been granted a number of years ago
which rises to an annual requirement of 8,970 units in 2018. However, in 2014, the likely level of new home
completions nationally will be less than 11,000 units while that in Dublin alone maybe closer to 3,500 units.              •   Many major greenfield sites require major infrastructural investment which will not have a pay-back
                                                                                                                               period within the next 2 to 3 years in accordance with banking sector requirements
So, why has the industry not responded to this sustainable demand for new homes that now exists?
There are a number of factors curtailing the supply of new homes which include the following:                              •   Builders can access development finance of up to 60% while the remaining funds must be raised
•   Even though house prices have risen in the metropolitan areas and are now showing signs                                    from equity and secondary debt providers, generally at a rate of interest which may not be sustainable
    of stabilisation in more rural parts of the country, new house prices in many locations are still 		                       in the current market place.
    less than replacement cost

 Annual Review 2014 | Outlook 2015
Central Bank Proposals for LTVs and LTIs                                                                       Departments proposal is to reduce Part V requirement from 20% to 10% of the development land in
While the house building industry in key metropolitan areas is hopeful that the industry can return to         housing developments of greater than nine housing units. This in own right is not sufficient to address
a more normalised function, there are concerns in relation to the availability of mortgages for future         the funding deficit that exists for the building of new houses and more action needs is required in this
purchasers of the new homes. Central Bank proposals to restrict mortgage availability to 80% loan to           particular area.
value or 3.5 times loan to income ratio are concerns to new home builders. These builders may not be
able to secure the development finance to fund development that might be perceived as speculative              Building Control (Amendment) Regulations 2014
in the uncertainty that borrowers may not have the capacity to have the required deposit to complete           During 2014, the new Building Control (Amendment) Regulations 2014 were introduced by the
the sale.                                                                                                      Minister for the Environment, Community and Local Government. Under these regulations, a mandatory
                                                                                                               level of oversight is now required prior to completion and occupation of any new dwelling house
Housing Market and Development Contribution Rates                                                              commenced after 1 march 2014. The industry has proactively worked with the Department in the rollout
The housing market, due to the collapse over the past 6 years, is broken and needs repair. House prices        of these regulations and the industry will pay its part in cooperating with inspections and certification
today are still circa 40% below peak levels which last pertained in 2007. While the industry is not            as required under the regulations.
advocating a return of the prices that pertained in 2007, it is important that the overall cost base reflect
the newly established sales prices of residential units in any area. While development contribution            Planning and Development (No. 2) Bill 2014
schemes have been modified in some local authority areas reducing the rates of contribution by 25%             The publication by the Department of the Environment Community and Local Government of the
to 26%, there are other local authorities who have yet to reduce their development contribution rates.         Planning and Development (No. 2) Bill 2014 which is to deal with, inter alia, the streamlining of various
These rates, together with high levels of supplementary development contribution rates that apply,             planning processes so as to remove a number of planning impediments that may exist to recovery of
continue to make developments uneconomic in many parts of the county. While this situation prevails,           development activity is awaited.
no new houses will be built in these areas until such time as projects become bankable and enable
house builders to undertake new housing construction programmes.                                               The Construction Industry Federation continues to work with the relevant Government Departments, the
                                                                                                               banking sector and others in the identification of constraints impacting on the sector so that adequate
All the inhibitors to recovery of the house building sector to the required levels have been identified in     solutions can be presented to ensure that the industry recovers for delivery of the sustainable level of
the Governments Construction 2020 Strategy. A number of Government Departments are working on                  housing required in the economy.
initiatives to address the funding problem and the cost problem. However, one must be mindful that as
long as the house building sector is not building houses that meet the sustainable demand, the social          It is not in anyone’s interest that an unsustainable level of house price inflation should apply which
housing lists will continue to grow thereby creating further difficulties for local housing authorities and    makes housing more unaffordable to first time buyers. The country must maintain its competitiveness in
the Department of the Environment Community and Local Government.                                              attracting foreign direct investment and in attracting new employees who can secure accommodation
                                                                                                               at a reasonable price in their area of choice.
Part V – Social and Affordable Housing Obligations
The Department of the Environment, Community and Local Government has published its proposals                  The house building industry wants to get back on its feet, house builders want to build and any
for the review of Part V (social housing obligations of developers). Industry supported the suspension         impediments to recovery of house building activity must be addressed.
of the Part V process and its replacement with a 1% levy on the sales of all new and second hand
homes. This could have been a more sustainable revenue source for Government in meeting its social             The industry looks forward to working pro-actively with various Government Departments and agencies
housing obligations and ensuring that the required level of social housing activity would take place. The      during 2015 ensuring that the various bottlenecks can be addressed moving forward.

                                                                                                                                                                                       Annual Review 2014 | Outlook 2015
DNG New Homes
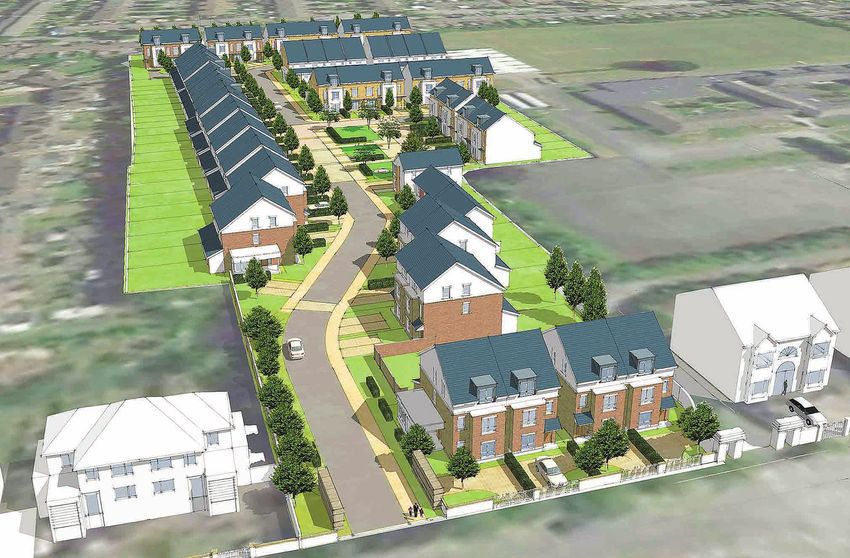
Elder Heath, Kiltipper Road, Dublin 24
A selection of 3 & 4 bed semi-detached houses.
Launching early Spring 2015,
GINA KENNEDY
MANAGER DNG
WHILST THERE HAS BEEN INCREASED ACTIVITY IN THE NEW HOMES MARKET, IT HAS BEEN VERY LIMITED WITH THE
MAJORITY OF NEW HOMES LAUNCHES HAPPENING IN THE LATTER PART OF THE 2014.
Of the new homes developments released we saw a limited number of apartment schemes and most of
these were part-build schemes which have recently been completed.
The majority of the new homes schemes launched were in the middle to upper end of the market for
people trading up to larger family homes in residential areas such as Dun Laoghaire, Blackrock, Foxrock,
Rathfarnham, Castleknock, Sutton and Malahide.
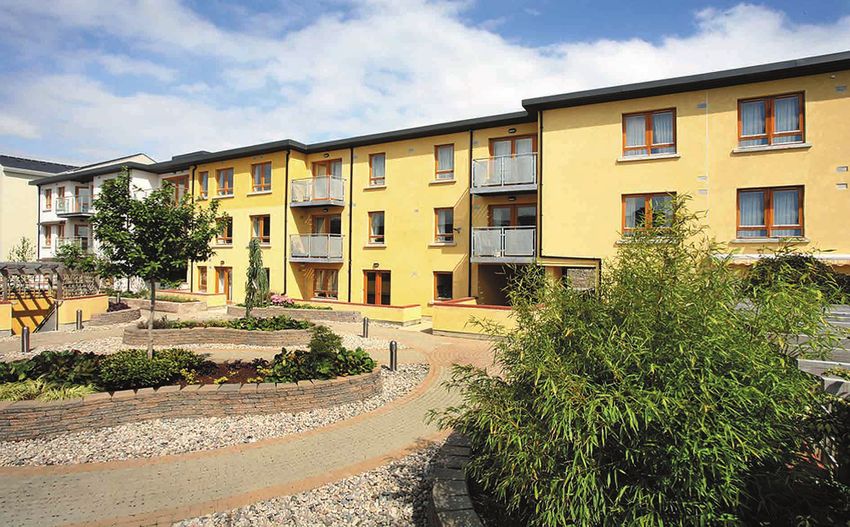
There has only been a handful of new homes released for the first time buyer market in Dublin, areas such maxwell Square, Maxwell Road,
as Swords, Clongriffin, Saggart, Ashbourne, Stepaside and a number along Dublin’s commuter belt mainly Rathmines, Dublin 6
in Kildare.
A selection of 3 & 4 bed TERRaced &
We have had a number of pre-launches in Elder Heath, Kiltipper and Beechpark, Leixlip within the last semi-detached houses.
few months which sold out before officially going to the market, demonstrating the strong demand for
new homes in the first time buyer market. Launching early Spring 2015,
Last year it is estimated there were c. 11,000 new homes built in the country. This is up from 2013 in
which only c. 7,500 homes were completed. However the majority of these houses are one-off houses or
part-built schemes being completed.
We set out opposite a number of the developments being handled by the DNG Advisory Division.
Annual Review 2014 | Outlook 2015SIOn HILL, SION HILL ROAD,
DRUMCONDRA, DUBLIN 9
A selection of 3 & 4 bed TERRACED &
semi-detached houses.
Launching Spring 2015,
THE CROFTON, GEORGE’s PLACE, DUN LAOghaire, Co. Dublin
LASt remaining 2 bed apartments now available
Phoenix Mews,
Castleknock, Dublin 15
Last 4 Bed detached house remaining
Beechpark, Leixlip, Co. Kildare
A selection of 3 & 4 bed TERRACED
& semi-detached houses.
Launching Spring 2015,
Launching early Spring 2015,
Annual Review 2014 | Outlook 2015
please register your interest.DNG Block Sales
Belville Court, Cabinteely, Co. Dublin
Sold Region €6,250,000
GEMMA LANIGAN Gross Yield based on ERV: c. 7%
PARTNER DNG
THE MARKET FOR BLOCK SALES PERFORMED VERY WELL WITH BOTH NATIONAL AND
INTERNATIONAL BUYERS COMPETING STRONGLY FOR THE LIMITED NUMBER WHICH
CAME TO THE MARKET IN 2014.
Buyers who had previously only considered whole block sales (ie entire
developments) changed track and pursued sales where the units were
interspersed with privately owned units.
We also witnessed an increase in the number of buyers/funds willing to
consider block sales in the sub €20M category due to the lack of large
asset sales coming to the market.
We set out opposite a selection of block sales handled by the
DNG Advisory Division in 2014.
Annual Review 2014 | Outlook 2015Spencer House, Custom House SqUARE,
IFSC, Dublin 1
Sold Excess €2,500,000
Gross Yield based on ERV: c. 8%
Monkstown Manor, Monkstown Farm, Co. Dublin
Sold region €2,700,000
Gross Yield based on ERV: c. 9%
Rosse Court, Lucan, Co. Dublin
Sold excess €5,000,000
(6 separate lots)
Gross Yield based on ERV: c. 11%
Rathgael, Clondalkin, Dublin 22
Sold region €2,500,000
(3 separate lots)
Gross Yield based on ERV: c. 12%
Annual Review 2014 | Outlook 2015CASH TRANSACTIONS
HOUSING TRANSACTIONS PER THOUSAND POPULATION
SOURCE: DNG Research
Annual Review 2014 | Outlook 2015DUBLIN meath
navan
DNG Head Office Ratoath
DNG NEW HOMES & ADVISORY KERRY Stamullen
BRAY kenmare
CEntral Killarney
Celbridge
tralee monaghan
castleblayney
Dun Laoghaire CARLOW
fairview Carlow Town Kildare
Tullow offaly
lucan clane
Birr
phibsboro maynooth
Tullamore
rathmines CAVAN naas
VIRGINIA
rock road
skerries roscommon
kilkenny BOYLE
stillorgan CLARE kilkenny city
ENNIS
tallaght
terenure sligo
CORK LAOIS sligo town
Newman Lowe Commercial portarlington
BANDon
blackpool tipperary
clonakility nenagh
COBH leitrm
carrick on shannon roscrea
douglas tipperary town
kinsale
glanmire
mallow limerick waterford
youghal abbeyfeale
DUNGARVAN
limerick city
waterford town
DONEGAL
DNG NATIONWIDE PRESENCE donegal Town
Falcarragh
longford
longford town
westmeath
athlone
killybegs mullingar
letterkenny Louth
drogheda wexford
GALWAY dundalk bunclody
athenry wexford town
galway city
kinvara mayo
portumna ballina wicklow
oranmore castlebar arklow
oughterard claremorris
Annual Review 2014 | Outlook 2015Sources used in compiling the report DNG Research Q4 2014 Additional Sources used in compiling the report: AIB Housing Market Bulletin - December 2014 AIB Market View - December 2014 Q3 Quarterly National Household Survey - November 2014 BPFI/PwC Mortgage Market Profile - Quarterly Report Q2 2014 Q3 Quarterly National Accounts - December 2014 CSO Live Register Statistics - December 2014 Property Price Register Disclaimer: Information herein has been obtained from sources believed reliable. While we do not doubt its accuracy, we have not verified it and make no guarantee, warranty or representation about it. DNG Property Advisors It is your responsibility to independently confirm its accuracy and completeness. Any projections, opinions, assumptions or estimates used are for example only and do not represent the current or future performance of the market. This information is designed exclusively for use by DNG and cannot be reproduced without prior written permission of DNG. All charts are created by DNG Research unless T: 01 4912600 E: info@dng.ie otherwise sourced.
You can also read