First Quarter FY 2020/21 Business Updates - 28 October 2020 Singapore Australia Malaysia China Japan - Starhill Global ...

Page created by Lonnie Murphy
 
CONTINUE READING
First Quarter FY 2020/21 Business Updates - 28 October 2020 Singapore Australia Malaysia China Japan - Starhill Global ...
First Quarter FY 2020/21 Business Updates
              28 October 2020

 Singapore  Australia  Malaysia  China  Japan
First Quarter FY 2020/21 Business Updates - 28 October 2020 Singapore Australia Malaysia China Japan - Starhill Global ...
Contents

            Financial and Key Highlights

            Portfolio Updates

            Market Outlook

                                            2
First Quarter FY 2020/21 Business Updates - 28 October 2020 Singapore Australia Malaysia China Japan - Starhill Global ...
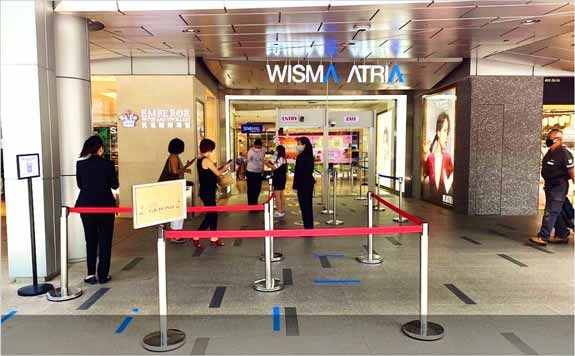
1   Financial and Key Highlights

                                   Wisma Atria
                                    Singapore
First Quarter FY 2020/21 Business Updates - 28 October 2020 Singapore Australia Malaysia China Japan - Starhill Global ...
Key highlights for 1Q FY20/21

Financial Performance
 Gross revenue and net property income was                                                  Retail
  lower by 10.3% and 19.2% y-o-y in 1Q FY20/21:                 WALE                        portfolio
                                                              by gross rent                occupancy               Operational
      –   Mainly due to rental assistance to eligible                     (1)                                      Performance
          tenants affected by the COVID-19                    5.5 years                     (as at 30 Sep 2020)

          pandemic, including allowance for rental                                              97.4%
          arrears and rebates mainly for Australia
          Properties
                                                                                                              Weighted
      –   Partially offset by higher contributions
                                                            Capital       Gearing                             average
          from The Starhill and appreciation of A$                        (as at 30 Sep 2020)
                                                                                                                debt
                                                        Management                                            maturity (1)
                                                                              39.1%
                                                                                                            2.5 years
Capital Management
 Prudent and proactive capital management to                    Tenants’                      Post-
                                                              sales y-o-y at                 lockdown
  enhance financial flexibility and liquidity                  Wisma Atria                    sales at
                                                                 Property                      Perth
                                                                                                                   Tenants’
 Secured new committed RCF with relationship                                                                      sales
                                                               recovered to                  Properties
  banks of up to $90 million                                  two-thirds of                  achieved              (1Q FY20/21)
                                                              pre-COVID-19                  pre-COVID-
 Undrawn and committed RCF is more than                          levels                     19 levels
  sufficient to cover the $250 million term
  borrowings maturing in the next 12 months
                                                                               Note:
                                                                               1. Excludes tenants’ option to renew or pre-terminate.
                                                                                                                                    4
First Quarter FY 2020/21 Business Updates - 28 October 2020 Singapore Australia Malaysia China Japan - Starhill Global ...
Key highlights for 1Q FY20/21

 Portfolio Performance
  Resilient portfolio occupancy of 96.6% as at 30 September 2020
  Most tenants are open for business across our portfolio in 1Q FY20/21
  Gradual recovery of tenants’ sales in Singapore                                                             (1)       (1)

            –     Wisma Atria Property’s tenants’ sales and shopper traffic recovered to about two-thirds and almost half
                  of pre-COVID-19 levels y-o-y respectively in 1Q FY20/21
  Encouraging post-lockdown sales in Australia
            –     Post-lockdown sales in Perth assets achieved pre-COVID-19 levels in 1Q FY20/21
            –     Myer Centre Adelaide sees improving sales since lockdown
            –     Majority of rental assistance negotiations have been concluded for our Australian tenants(1)
  Stable of new quality tenants
            –     United Overseas Bank (Ngee Ann City Property)
            –     Unity Pharmacy (Wisma Atria Property)
            –     New-to-market tenant Don Don Donki (Lot 10 Property)
            –     New flagship boutiques at The Starhill: Balmain, Philipp Plein, Tom Ford, Stefano Ricci, Paul & Shark
  Committed to support our tenants to ride through the COVID-19 pandemic
            –     Extended rental relief for eligible tenants in the portfolio, including an allowance for rental arrears and
                  rebates for the Australian tenants, amounting to approximately $7.3 million in 1Q FY20/21
Note:
1. As guided by the Mandatory Code of Conduct for landlords and tenants released by the National Cabinet of Australia.
                                                                                                                                5
First Quarter FY 2020/21 Business Updates - 28 October 2020 Singapore Australia Malaysia China Japan - Starhill Global ...
1Q FY20/21 financial performance

                         Gross Revenue                                     Net Property Income (NPI)
                                 10.3% y-o-y                                                19.2% y-o-y
                      48.0                                                                                                    Variance in gross
            50          1.2                                           50                                                      revenue and NPI y-o-y
                                          43.1
                                                                                      (1)                                     in 1Q FY20/21:
                        4.1                1.1                                36.9
            40                             4.6                        40                                                       Mainly due to rental
                                                                                0.9                            (1)
                       11.1                                                                             29.8                    assistance to eligible
                                                                                3.8                                             tenants affected by the
                                          10.5                        30
                                                                                                         0.9
            30                                                                  6.8                                             COVID-19 pandemic,
                                                          $ million
$ million

                                                                                                         4.3                    including allowance for
                       16.1                                                                              4.4                    rental arrears and
                                                                      20
            20                            13.4                                 13.2                                             rebates mainly for
                                                                                                        10.1                    Australia Properties
                                                                      10
            10                                                                                                                 Partially offset by
                       15.5               13.5                                 12.1                     10.0                    higher contributions
                                                                      0                                                         from The Starhill and
            0
                   1Q FY19/20           1Q FY20/21
                                                                             1Q FY19/20            1Q FY20/21                   the appreciation of A$

                 Wisma Atria Property        Ngee Ann City Property              Australia Properties
                                                                                                                     Note:
                 Malaysia Properties         Others                                                                  1. Total does not add up due to rounding differences.

                                                                                                                                                                        6
First Quarter FY 2020/21 Business Updates - 28 October 2020 Singapore Australia Malaysia China Japan - Starhill Global ...
Balance sheet and NAV statistics
     Total assets of approximately $3.1 billion

                                                                                           As at                                       As at
                                                                                    30 September 2020                              30 June 2020
                                                                                          ($’000)                                     ($’000)

      Total Assets (1)                                                                      3,082,354                                 3,081,035

      Total Liabilities                                                                     1,302,899                                 1,311,546

      Net Assets                                                                            1,779,455                                 1,769,489

      Unitholders’ Funds                                                                    1,779,455                                 1,769,489

      NAV Per Unit ($) (2)                                                                      0.81                                      0.81

      Closing Price ($)                                                                         0.44                                      0.51

      Unit Price Premium/(Discount) to NAV Per Unit                                          (45.7%)                                   (37.0%)

      Corporate Rating (Fitch Ratings)                                                     BBB/Stable                                BBB/Stable

Notes:
1.  Valuations of investment properties are subject to significant estimation uncertainty given the constantly evolving impact from the COVID-19 pandemic.
2. The computation of NAV per unit is based on 2,199,555,772 units which comprise (i) 2,194,958,278 units in issue as at 30 September 2020, and (ii) estimated
    4,597,494 units issuable as partial satisfaction of management fees for 1Q FY20/21 (Jun 2020: 2,194,651,816 units which comprise (i) 2,191,127,148 units in issue
    as at 30 June 2020, and (ii) estimated 3,524,668 units issuable as partial satisfaction of management fees for 4Q FY19/20).

                                                                                                                                                                        7
First Quarter FY 2020/21 Business Updates - 28 October 2020 Singapore Australia Malaysia China Japan - Starhill Global ...
Staggered debt maturity profile averaging 2.5 years
   as at 30 September 2020

                        Debt maturity profile                                        Financial Ratios (3)                  30 Sep 2020       30 Jun 2020
$ million                as at 30 Sep 2020                                           Total debt                           $1,203 million    $1,221 million
400                                                                                  Gearing                                  39.1%             39.7%
                                *
                                                                                     Interest cover (4)                        2.6x              2.9x
350
                                                                                     Average interest rate p.a.(5)            3.25%             3.23%
                               125             * Peak maturity 32%
300                                            of total debt and 12%
                                                                                     Unencumbered assets ratio                 74%               75%
                                               of total assets
                                                                                     Fixed/hedged debt ratio (6)               89%               91%
250
                                                                                     Weighted average debt maturity          2.5 years         2.7 years
                     132
200                                                  109                                          Notes:
                                                                                                  1. Comprises of short-term RCF outstanding, which were
                                                                                                     drawn mainly for working capital purposes and to
150
                                                                                                     finance ongoing asset enhancement works for The
              (1)
                               260                    48                                             Starhill.
            40
100                                                                                               2. Early refinanced the JPY0.68 billion bond in August
                                                                                                     2020, with new maturity of August 2025.
                     150                                                                          3. In compliance with its financial covenants as at 30
50          100                                      100                                             September 2020 and 30 June 2020.
                                          61                         (2)
                                                                            70                    4. Interest cover ratio computed per the Property Funds
                                                                 9                                   Appendix, based on trailing 12 months interest
 0                                                                                                   expenses of $39.8 million as at 30 September 2020
      FY 2020/21 FY 2021/22 FY 2022/23 FY 2023/24 FY 2024/25 FY 2025/26 FY 2026/27                   (Jun 2020: $39.1 million).
                                                                                                  5. Includes interest rate derivatives and benchmark rates
 S$150m term loan     S$260m term loan     A$135m term loan      A$63m term loan                     but excludes upfront costs.
 S$100m MTN           S$125m MTN           S$70m MTN             S$100m MTN (2020)
                                                                                                  6. Includes mainly interest rate swaps.
 JPY3.7b term loan    JPY0.68b bond        RM330m MTN            S$40m RCF

                                                                                                                                                              8
First Quarter FY 2020/21 Business Updates - 28 October 2020 Singapore Australia Malaysia China Japan - Starhill Global ...
2   Portfolio Updates

                        Myer Centre Adelaide
                          Adelaide, Australia
                                        9
First Quarter FY 2020/21 Business Updates - 28 October 2020 Singapore Australia Malaysia China Japan - Starhill Global ...
Balance of master / anchor leases and actively-managed leases

                                                                                                       Includes the following: -
    Master leases and anchor leases, incorporating periodic
         rental reviews, represent approximately 49.6% of gross
         rent as at 30 September 2020                                                                  Ngee Ann City Property Retail (Singapore)
                                                                                                       The Toshin master lease expires in 2025. Next rent
                                                                                                       review is in June 2022 (at prevailing rent or higher).

                                                                              Master leases /
                                                                              anchor leases,
                                                                             with periodic rent        The Starhill & Lot 10 Property (KL, Malaysia)
                                                                                                       New master tenancy agreements commenced
                                                                                  reviews,             in June 2019 and have long tenures of
                                                                                 49.6% (2)             approximately 19.5 years and 9 years(1) for
                                                                                                       The Starhill and Lot 10 Property respectively,
                                                                                                       with periodic rental step-ups.
           Actively-
           managed
            leases,
             50.4%                                                                                     Myer Centre (Adelaide, Australia)
                                                                                                       The long-term lease expires in 2032 and
                                                                                                       provides for an annual rent review.

                                                                                                       David Jones Building (Perth, Australia)
Notes:                                                                                                 The long-term lease expires in 2032 and provides
1. Assuming that the option to renew for the third three-year term for Lot 10 Property is exercised.   for upward-only rent review every three years.
2. Excludes tenants’ option to renew or pre-terminate.                                                 A rental uplift was secured in August 2020.
                                                                                                       .
                                                                                                                                                                10
Diversified portfolio across geography and sector
     Office portfolio contributes 15.2% to revenue in 1Q FY20/21

          ASSET VALUE                                         1Q FY20/21 GROSS REVENUE                                 1Q FY20/21 GROSS REVENUE
   BY COUNTRY AS AT 30 SEP 2020                                      BY COUNTRY                                              RETAIL/OFFICE

                                                                                Others*
                      Others*                                                    2.7%
                       3.1%                                      Malaysia                                                Office
     Malaysia                                                     10.6%
      13.7%                                                                                                              15.2%

Australia
 13.6%                                                   Australia
                                                          24.3%

                                                                                                         Singapore
                                                                                                           62.4%
                                           Singapore                                                                                        Retail
                                             69.6%                                                                                          84.8%

      *Others comprise one property in Chengdu, China, and two properties located in central Tokyo, Japan, as at 30 September 2020.

                                                                                                                                                     11
Retail portfolio actual occupancy rate resilient at 97.4%
  Prime assets in strategic locations with excellent connectivity

             31 Dec      31 Dec      31 Dec      31 Dec      31 Dec      31 Dec      30 Jun      30 Jun     30 Jun      30 Jun        30 Jun        30 Jun        30 Sep
As at
               08          09          10          11          12          13          15          16         17          18 (1)        19 (1)        20 (1)        20 (1)

                                                                                                                        98.7%         99.4%         98.9%         99.5%
SG Retail     98.3%      100.0%       99.1%       98.3%       99.8%       99.9%       99.4%       99.2%      99.2%              (2)           (2)           (2)           (2)
                                                                                                                        (99.1%)       (99.4%)       (99.5%)       (99.5%)

                                                                                                                        90.3%         93.2%         87.6%         90.3%
SG Office     92.4%       87.2%       92.5%       95.3%       98.3%       99.0%       99.3%       95.6%      92.9%              (2)           (2)           (2)           (2)
                                                                                                                        (95.0%)       (93.9%)       (90.4%)       (91.0%)

Singapore     96.0%       95.1%       96.5%       97.1%       99.2%       99.5%       99.3%       97.9%      96.8%      95.5%         97.0%         94.6%         96.0%

Japan         97.1%       90.4%       86.7%       96.3%       92.7%       89.8%       96.1%      100.0%      100.0%     100.0%        100.0%        100.0%        100.0%

China        100.0%      100.0%      100.0%      100.0%      100.0%      100.0%      100.0%       96.4%      100.0%     100.0%        100.0%        100.0%        100.0%

Australia        -           -       100.0%      100.0%      100.0%       99.3%       96.2%       89.7%      91.1%      88.8%         92.8%         94.3%         94.3%

Malaysia         -           -       100.0%      100.0%      100.0%      100.0%      100.0%      100.0%      100.0%     100.0%        100.0%        100.0%        100.0%

SG REIT                                                                                                                      (1)            (1)           (1)           (1)
              96.6%       95.4%       98.2%       98.7%       99.4%       99.4%       98.2%       95.1%      95.5%      94.2%         96.3%         96.2%         96.6%
portfolio

Notes:
1. Based on commenced leases as at reporting date. For prior years, the reported occupancy rates were based on committed leases, which include leases that have
    been contracted but have not commenced as at the reporting date.
2. Based on committed leases as at reporting date.

                                                                                                                                                                       12
Staggered portfolio lease expiry profile
     Long WALE of 8.5 years by NLA

                                                                     (1)         (1)
             Weighted average lease term of 8.5 and 5.5 years (by NLA and gross rent respectively)

                                   Portfolio lease expiry (as at 30 September 2020) (2)(3)
   90%
                                                                  By NLA      By Gross rent
                                                                                                                                            (4)(5)
   80%                                                                                                                                 75.7%

   70%
                                                                                                                                                        (4)(5)
   60%
                                                                                                                                                 53.5%
   50%

   40%

   30%

   20%                                                   14.2%
                           13.8%
                7.8%                                                                   9.5%                          9.0%
   10%                                        6.6%                           4.7%                          5.2%

     0%
                    FY20/21                        FY21/22                       FY22/23                       FY23/24                 Beyond FY23/24

Notes:
1. Excludes tenants’ option to renew or pre-terminate.
2. Lease expiry schedule based on commenced leases as at 30 September 2020.
3. Portfolio lease expiry schedule includes all of SGREIT’s properties.
4. Includes the Toshin master lease, master tenancy agreements for Malaysia Properties and the anchor leases in Australia and China.
5. Assuming that the option to renew for the third three-year term for Lot 10 Property is exercised.

                                                                                                                                                                 13
Staggered portfolio lease expiry profile by category
   Only 12.6% of retail leases expiring in FY20/21

             Retail Lease Expiry Profile by Gross Rents                                            Office Lease Expiry Profile By Gross Rents
                   (as at 30 September 2020) (1)(2)(3)                                                   (as at 30 September 2020) (1)(3)(6)
    70%                                                                                 70%
                                                                           (4)(5)
                                                                     59.2%
    60%                                                                                 60%

    50%                                                                                 50%

    40%                                                                                 40%

    30%                                                                                 30%
                                                                                                               24.2%         22.5%
                                                                                                 21.7%
    20%                                                                                 20%                                                      16.8%
                                                                                                                                       14.8%
             12.6%         12.7%
    10%                                   7.5%          8.0%                            10%

     0%                                                                                  0%
             FY20/21       FY21/22      FY22/23       FY23/24       Beyond                       FY20/21      FY21/22       FY22/23    FY23/24   Beyond
                                                                    FY23/24                                                                      FY23/24

Notes:
1. Based on commenced leases as at 30 September 2020.
2. Includes all of SGREIT’s retail properties.
3. Excludes tenants’ option to renew or pre-terminate.
4. Includes the Toshin master lease, master tenancy agreements for Malaysia Properties and the anchor leases in Australia and China.
5. Assuming that the option to renew for the third three-year term for Lot 10 Property is exercised.
6. Comprises Wisma Atria, Ngee Ann City and Myer Centre Adelaide office properties only.

                                                                                                                                                           14
Lease expiry profiles across geographies

 Portfolio           Lease expiry profile (by gross rent) as at 30 September 2020
             100%                                                                                                   (1)
                                                                                                            87.7%
                               Wisma Atria Property       Ngee Ann City Property
                                                                                                                          Includes Toshin
Singapore                                                                                                                 master lease at
                                                                                                                          Ngee Ann City
             50%
  Retail            25.8%
                                        33.5%                                                                             Property
                                                              19.1%                20.5%
                            3.9%                4.7%                  1.4%                 2.3%      1.1%
              0%
                     FY20/21              FY21/22               FY22/23               FY23/24      Beyond FY23/24

             100%
                              Wisma Atria Property           Ngee Ann City Property

Singapore
             50%    37.2%                                                                                                 Notes:
 Offices                                21.4%
                                                31.6%         34.0%
                                                                                                                          1. Includes the master
                            14.9%                                     18.8%                17.6%            17.1%             tenancy lease with
                                                                                   7.4%                                       Toshin Development
                                                                                                     0.0%
              0%                                                                                                              Singapore Pte Ltd
                     FY20/21              FY21/22               FY22/23               FY23/24      Beyond FY23/24             which expires in
                                                                                                                              2025.
                                                                                                                          2. Includes the long-
             100%                                                                                           (2)
                                                                                                                              term lease with
                               Perth Properties          Myer Centre Adelaide                       79.1%           (3)
                                                                                                             64.8%            David Jones Pty
                                                                                                                              Limited which
 Australia   50%                                                                                                              expires in 2032.
Properties                                                                                                                3. Includes the long-
                                                                                                                              term lease with Myer
                    12.6% 12.1%                                                            10.3%
                                        0.7%      6.7%         5.1% 6.1%           2.5%                                       Pty Ltd which expires
              0%                                                                                                              in 2032.
                     FY20/21              FY21/22               FY22/23               FY23/24      Beyond FY23/24
                                                                                                                                                15
Tenants’ Sales and Shopper Traffic - Wisma Atria Property
Gradual recovery in 1Q FY20/21 post-Circuit Breaker

 Tenants’ sales for Wisma Atria Property recovered to about two-thirds of pre-COVID-19 levels
  y-o-y in 1Q FY20/21 post-Circuit Breaker
 Shopper traffic recovered to almost half of pre-COVID-19 levels y-o-y

                          Tenants’ Sales                             Shopper Traffic
                                 33.5% y-o-y                               54.4% y-o-y
                                                               6
                    60
       S$ million

                                                               4
                    40

                                                     million
                                                               2
                    20

                     0                                         0
                         1Q FY20/21     1Q FY19/20                 1Q FY20/21     1Q FY19/20

                                                                                                 16
Prime locations at retail precincts of city centres
Attracts new-to-market and niche international brands

                           New and upcoming tenants across the portfolio

Singapore Office                                       Wisma Atria Property                                Lot 10 Property

                                   New tenants at Wisma Atria Property

 Unity Pharmacy opened at Wisma Atria in August 2020                 Beryl’s Chocolate opened at Wisma Atria in August 2020

                                                                                                                              17
Keeping our shoppers and visitors safe

                                                                                                     Floor markings in front of food and beverage stalls for safe distancing

Temperature screening for all shoppers and visitors with queue management as well as digital
check-ins and check-outs for contract tracing purposes

                                                                                                                                        Spaces marked out to ensure
                                                                                                      Temperature screenings            safe distance is maintained
Notices and floor markings in lifts and taxi stands to remind shoppers to maintain safe distancing    for contractors                   between patrons

                                                                                                                                                                        18
New technological solutions to enhance safety at Wisma Atria

        New and innovative technological solutions have been deployed / installed
      in addition to statutory guidelines to safeguard shopper safety and experience

       Air cleaning system utilising       Autonomous disinfection robots        Antivirus, antimicrobial
     advanced ultraviolet technology        that use innovative UV-C LED       and antifungal coating is
  capable of purifying the air has been      technology effective in killing     applied onto escalator
     installed inside air handling unit    microbes, including viruses like    handrails and lift buttons.
   ductworks of Wisma Atria shopping      COVID-19, has been deployed at       Cleaning and disinfectant
    mall and office tower for improved     Wisma Atria shopping mall and       frequency has also been
   indoor air quality from August 2020      office tower from August 2020               increased

                                                                                                             19
Asset Enhancement Works for The Starhill
    Estimated completion by December 2021

   The Master Tenant is entitled to a fair and
    reasonable extension of time under the Master
    Tenancy Agreement (MTA) for delays to the
    asset enhancement works (AEW) caused by
    force majeure
   As a result of the delays caused by the Malaysia
    Government’s movement control order, the time
    for completion of the AEW was extended for two
    months from October 2021 to December 2021,
    which was regarded as an interested person
    transaction
   Under the MTA, the agreed rent during the AEW
    shall continue for two more months to December
    2021 and the extension of time would result in a    Artist’s impression of The Starhill façade facing Jalan Bukit Bintang
    postponement of the rental increments(1)
   The financial impact, aggregated with all other        The Starhill (formerly known as
                                                           Starhill Gallery) is undergoing asset
    transactions between SGREIT and YTL
                                                           enhancement to transform into an
    Corporation Berhad or its associates entered
                                                           integrated development comprising
    into to-date in the current financial year falls       four retail floors and upper three
    below 3.0% of SGREIT’s latest audited net              floors of hospitality use as an
    tangible assets for the purposes of Chapter 9 of       extension of the adjoining JW
    the Listing Manual                                     Marriott Hotel Kuala Lumpur
   The Starhill and Lot 10 Property have resumed
                                                       Note:
    operations as the nation eased its Movement        1. For more details, please refer to the circular
    Control Order (MCO)                                    to unitholders dated 25 April 2019.             Artist’s impression of The Starhill’s central atrium
                                                                                                                                                          20
Prime locations at retail precincts of city centres
Attracts international luxury brands

                   New flagship boutiques joining The Starhill

       The Starhill’s well-loved brands to return with new concepts in 2021

                                                                              21
3   Market Outlook

                     Artist impression of The Starhill
                              Kuala Lumpur, Malaysia
Market Outlook - Singapore

                       • Singapore’s economy contracted by 7.0% y-o-y in 3Q 2020 based on advanced estimates
  Economy              • Retail sales (excluding motor vehicles) fell 8.4% y-o-y in August 2020
                       • From January to August 2020, international visitor arrivals fell 79.2% y-o-y to 2.7 million

                       • More businesses are allowed to operate in the gradual reopening of Phase Two post-Circuit Breaker
                         since 19 June 2020
                       • However, safe distancing measures and minimal tourist arrivals continue to impact shopper traffic and
                         tenants’ sales
                       • Occupancy and rents are expected to remain under pressure, although the extent will be mitigated by
                         the limited new retail supply(1)
                       • More employees are allowed to return to the office from 28 September 2020 and gradual easing of
    Retail               safe management measures are expected to be positive for the retail sector
    Sector             • Coupled with Government efforts in facilitating essential business travel with bilateral green lane
                         arrangements with some countries, proposed air travel bubble with Hong Kong and cautious lifting of
                         border restrictions
                       • COVID-19 (Temporary Measures) Act 2020 provides a rental relief framework for Small and Medium
                         Enterprises and seeks to offer temporary relief to businesses and individuals who are unable to
                         perform their contractual obligations due on or after 1 February 2020 because of COVID-19. The
                         relief period for leases and licenses of non-residential property from legal and enforcement actions
                         has been extended from 19 October 2020 to 19 November 2020

    Office             • Office demand continues to dampen due to recessionary pressure and bleak employment outlook(1)
    Sector             • Cost efficiency continue to be the main driver for leasing enquiries(1)

Note:
1. CBRE Research, Singapore MarketView, Q3 2020
                                                                                                                                 23
Market Outlook – Australia & Malaysia

                         • The Australian economy contracted sharply in the June quarter, with output falling by 7%(1)
                         • Retail sales for South Australia and Western Australia grew by 4.8% and 7.5% y-o-y
   Australia               respectively for the 12 months to August 2020
                         • Mandatory Code of Conduct by National Cabinet of Australia in South Australia and Western
                           Australia has been extended to 3 January 2021 and 28 March 2021 respectively(2)(3)

                         • Malaysia’s GDP contracted by 17.1% in 2Q 2020 from a marginal growth of 0.7% in 1Q 2020
                         • Sales of Retail Trade fell 1.5% y-o-y in August 2020, compared to the 3.8% y-o-y decline in
                           July 2020
                         • Tourist arrivals to Malaysia fell 68.2% y-o-y to 4.3 million in 1H 2020, with tourist expenditure
   Malaysia                declining 69.8% y-o-y to RM12.5 billion in 1H 2020
                         • Following a recent wave of COVID-19 infections, Kuala Lumpur, Putrajaya, Selangor and
                           Sabah were placed under movement restrictions for two weeks, which was extended to
                           9 November 2020
                         • All economic activities are allowed; social activities and cross-district travels are not allowed

Notes:
1. Reserve Bank of Australia, Statement by Philip Lowe, Governor: Monetary Policy Decision, 6 October 2020
2. Government of South Australia, Attorney-General’s Department, COVID-19 Emergency Response (Commercial Leases No. 2) (Prescribed Period) Variation
    Regulations 2020
3. Western Australia, Commercial Tenancies (COVID-19 Response) Act 2020, 26 September 2020
                                                                                                                                                       24
Riding through COVID-19 pandemic

             Proactive and prudent capital management

                Active asset management to enhance
                resilience

                Ensuring safety of the community

             Seeking out opportunities

                                                        25
Proactive and prudent capital management

                  Limited visibility on the duration and severity of the COVID-19
                   pandemic
                  Strengthen the balance sheet and enhance financial flexibility
Enhancing         Undrawn and committed revolving credit facilities are more than
 financial         sufficient to cover the S$250 million term borrowings maturing in
 flexibility       the next 12 months
                  Defer non-essential capital expenditure and enhance operational
                   efficiencies
                  Balancing distributions, cash reserves and rental assistance

                                                                                       26
Active asset management to enhance resilience

                   Continue to work closely with our tenants to render targeted relief
                    assistance where appropriate and weather through this difficult
                    period together
                   Keeping the mall relevant to shoppers
Proactive lease    Focus on tenant retention and maintaining healthy occupancy
 management
                   Implement proactive marketing plans to drive traffic and sales
                   Taking this opportunity to curate a high-quality and resilient tenant
                    mix
                   Position our assets to be ready for the eventual recovery

                                                                                            27
Ensuring safety of the community &
  asset enhancement and acquisitions

                    Health and safety of the community remains our priority
                         – Temperature screening, contact tracing and safe distancing
Measures taken             will continue
  to keep the
community safe           – Increased frequency in cleaning
amid COVID-19            – Disinfectant system utilising advanced ultraviolet technology
                           to disinfect indoor air and difficult to reach surfaces have
                           been deployed at Wisma Atria

                    Continue to explore and evaluate asset enhancement initiatives on
                     existing portfolio to enhance return
     Asset
 enhancement        Diversification of income to other commercial sectors like office
and acquisitions
                    Focusing the search for yield-accretive acquisition opportunities in
                     key gateway cities

                                                                                            28
References used in this presentation, where applicable

1Q, 2Q, 3Q, 4Q means where applicable, the periods from 1 July to 30 September; 1 October to 31 December; 1 January to 31 March and 1
April to 30 June
1Q FY20/21 means the period of 3 months from 1 July 2020 to 30 September 2020
1Q FY19/20 means the period of 3 months from 1 July 2019 to 30 September 2019
DPU means distribution per unit
FY means the financial year
GTO means gross turnover
IPO means initial public offering (Starhill Global REIT was listed on the SGX-ST on 20 September 2005)
NLA means net lettable area
NPI means net property income
pm means per month
psf means per square foot
q-o-q means quarter-on-quarter
WA and NAC mean the Wisma Atria Property (74.23% of the total share value of Wisma Atria) and the Ngee Ann City Property (27.23% of
the total share value of Ngee Ann City) respectively
y-o-y means year-on-year

All values are expressed in Singapore currency unless otherwise stated
Note: Discrepancies in the tables and charts between the listed figures and totals thereof are due to rounding

                                                                                                                                        29
Disclaimer

The information contained in this document has been compiled from sources believed to be reliable. Whilst every effort has been made to ensure the
accuracy of this document, no warranty is given or implied. This document has been prepared without taking into account the personal objectives,
financial situation or needs of any particular party.

The value of units in Starhill Global REIT (“Units”) and the income derived from them may fall or rise. The Units are not obligations of, deposits in, or
guaranteed by, the Manager or any of its affiliates. An investment in Units is subject to investment risks, including possible delays in repayment, loss of
income or principal invested. The Manager and its affiliates do not guarantee the performance of Starhill Global REIT or the repayment of capital from
Starhill Global REIT or any particular rate of return. Investors have no right to request the Manager to redeem their Units while the Units are listed. It is
intended that Unitholders may only deal in their Units through trading on the SGX-ST. Listing of the Units on the SGX-ST does not guarantee a liquid
market for the Units.

This document is for information only and does not constitute an invitation or offer to acquire, purchase or subscribe for the Units. The past performance
of Starhill Global REIT is not necessarily indicative of the future performance of Starhill Global REIT.

This document may contain forward-looking statements that involve risks and uncertainties. Actual future performance, outcomes and results may differ
materially from those expressed in forward-looking statements as a result of a number of risks, uncertainties and assumptions. Representative examples
of these factors include (without limitation) general industry and economic conditions, outbreak of contagious diseases or pandemic, interest rate and
foreign exchange trends, cost of capital and capital availability, competition from similar developments, shifts in expected levels of property rental
income, changes in operating expenses (including employee wages, benefits and training costs), property expenses and governmental and public policy
changes. Investors are cautioned not to place undue reliance on these forward-looking statements, which are based on the Manager’s view of future
events.

                                                                                                                                                                30
YTL Starhill Global REIT Management Limited
                                       CRN 200502123C

                          Manager of Starhill Global REIT
                            391B Orchard Road, #21-08
                                 Ngee Ann City Tower B
                                      Singapore 238874
                                     Tel: +65 6835 8633
                                    Fax: +65 6835 8644
                              www.starhillglobalreit.com

                                                       31
You can also read