Investor Presentation - Tricon Residential

Page created by Ernest Hanson
 
CONTINUE READING
Investor Presentation - Tricon Residential
Investor
Presentation

October 2020
Investor Presentation - Tricon Residential
Disclaimer
General
You are advised to read this disclaimer carefully before reading, accessing or making any             alternative to IFRS financial measures, such as net income. As non-IFRS financial
other use of the information included herewith. These materials are not an offer or the               measures do not have standardized definitions prescribed by IFRS, they are less likely to
solicitation of an offer to purchase any securities or make any investment. This                      be comparable with other issuers or peer companies. A description of the non-IFRS
presentation includes information about Tricon Residential Inc. and its subsidiaries and              measures used by the Company in measuring its performance is included in its
investees (together, the “Company”) as of June 30, 2020, unless otherwise stated. These               Management Discussion and Analysis available on the Company’s website at
materials should be reviewed in conjunction with the Company’s Financial Statements and               www.triconcapital.com and on SEDAR at www.sedar.com.
Management Discussion and Analysis for the periods ending June 30, 2020 and are
subject to the detailed information and disclaimers contained therein. All dollar amounts             This presentation may contain information and statistics regarding the markets in which
are expressed in U.S. Dollars unless otherwise stated.                                                the Company and its investees operate. Some of this information has been obtained from
                                                                                                      market research, publicly available information and industry publications. This information
The Company measures the success of its business in part by employing several key                     has been obtained from sources believed to be reliable, but the accuracy or completeness
performance indicators that are not recognized under IFRS including net operating income              of such information has not been independently verified by the Company and cannot be
(“NOI”), funds from operations (“FFO”), core funds from operations (“core FFO”), and                  guaranteed. Disclosure of past performance is not indicative of future results.
adjusted funds from operations (“AFFO”). These indicators should not be considered an

Forward-Looking Statements
This presentation may contain forward-looking statements and information relating to                  anticipated impact and therefore no assurance that actual performance will align with the
expected future events and the Company’s financial and operating results and projections,             Company’s targets. These statements are based on management’s current expectations,
including statements regarding the Company’s growth and performance goals and                         intentions and assumptions which management believes to be reasonable having regard
expectations, including, in particular, targeted returns, expected future performance, and            to its understanding of prevailing market conditions and the current terms on which
growth projections, that involve risks and uncertainties. Such forward-looking information is         investment opportunities may be available.
typically indicated by the use of words such as “will”, “may”, “expects” or “intends”. The
forward-looking statements and information contained in this presentation include                     Projected returns and financial performance are based in part on projected cash flows for
statements regarding the Company’s strategic priorities; expected or targeted financial and           incomplete projects as well as future company plans. Numerous factors, many of which
operating performance including project timing, projected cash flow; projected NOI and                are not in the Company’s control, and including known and unknown risks, general and
other projected performance metrics; the ability of the Company to extend debt maturities             local market conditions and general economic conditions (such as prevailing interest rates
and refinanced debt; the ability to attract third-party investment; FFO growth and the                and rates of inflation) may cause actual performance and income to differ from current
potential drivers of that growth; expectations for the growth in the business; the availability       projections. Accordingly, although we believe that our anticipated future results,
and quantum of debt reduction opportunities and the Company’s ability to avail itself of              performance or achievements expressed or implied by the forward-looking statements and
them; operational improvements in the single-family rental and U.S. multi-family portfolios,          information are based upon reasonable assumptions and expectations, the reader should
including integration/internalization plans, and any associated impact on revenues or                 not place undue reliance on forward-looking statements and information. If known or
costs; and improvements to the Company’s financial reporting.                                         unknown risks materialize, or if any of the assumptions underlying the forward-looking
                                                                                                      statements prove incorrect, actual results may differ materially from management
In regards to the targets presented on pages 22 and 23: the 2022 Targets are based on                 expectations as projected in such forward-looking statements. Examples of such risks are
the assumed impact of the growth drivers, proposed transactions, and sources of cash                  described in the Company’s continuous disclosure materials from time-to-time, as
flow described throughout those pages and on the assumption that other drivers of                     available on SEDAR at www.sedar.com. The Company disclaims any intention or
performance will not deteriorate over the relevant period. There can be no assurance that             obligation to update or revise any forward-looking statements, whether as a result of new
such growth drivers, transactions or cash flow will occur, be realized, or have their                 information, future events or otherwise, unless required by applicable law.

                                                                                        Jacksonville, FL

                                                                                                  1
Investor Presentation - Tricon Residential
Founded in 1988, Tricon is a rental housing company focused on the middle
market demographic. Tricon owns and operates approximately 30,000
single-family rental homes and multi-family rental units in 21 markets across
the United States and Canada, managed with an integrated technology-
enabled operating platform

                                                                                                                   Coolray Field,
                                              Atlanta, GA                                  Houston, TX               Atlanta, GA

                                                                                                           The Reserve at Alafaya,
                                           Charlotte, NC                                Jacksonville, FL             Orlando, FL     The Selby, Toronto, ON

Note: The above photos may not be representative of all Tricon investment properties.

                                                                                                      2
Investor Presentation - Tricon Residential
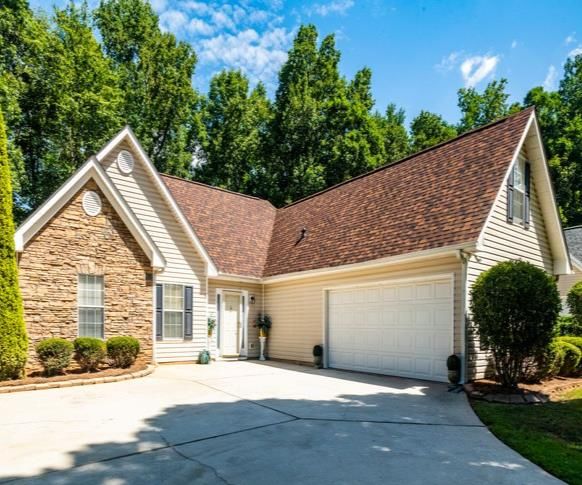
Our mission is to provide quality housing for families                                                                                                              TSX: TCN
across North America and to generate strong risk-adjusted
returns for our public and private investors

   1988                       Founded                                        21,582                              Single-Family
                                                                                                                 Rental (“SFR”)
                                                                                                                                                      C$2.1B   Market
                                                                                                                                                               Capitalization
                                                                                                                 Homes

                                                                                                                                                               Dividend Yield
  2010                        Listed (TSX)                                        7,789                          Stabilized
                                                                                                                 Multi-Family                          2.5%    (C$0.07/Quarter)
                                                                                                                 Rental Apartments

                                                                                                                                                           1
                                                                                                                 Multi-Family
             32
                              Years of Investing
                              In Communities                                      3,695                          Rental Apartments                      18%    Annualized Growth
                                                                                                                                                               In Book Value Per
                                                                                                                 Under Development                             Share Since Entering
                                                                                                                                                               SFR In 2012

All data presented as at June 30th, 2020. Share price is as of September 30th, 2020. All figures in U.S. dollars unless otherwise indicated.
1. Annualized growth in book value per share is calculated based on CAD book value since Tricon entered the Single Family Rental sector in Q1 2012.

                                                                                                                         3
Investor Presentation - Tricon Residential
Our Evolution as a Rental Housing Company

1988           2010             2012              2015           2017               2018              2019             2020

Founded by     Initial Public   Entered U.S.      Internalized   Acquisition of     Formed $2B         $450M JV         Internalized
David Berman   Offering,        Single-family     SFR Property   Silver Bay Trust   SFR joint          formed with      U.S. multi-family
and            listed on        rental business   management     for $1.4B          venture to         ASRS to          asset management &
Geoff Matus    The TSX                            ---                               acquire ~10,000    pursue B2R       Canadian multi- family
                                                                                    homes              communities      property management
                                                  Formed
                                                  Canadian                                             ---              ---
                                                  multi-family                                         Acquisition      Closed a $553 million
                                                  development                                          of $1.3B U.S.    securitization in
                                                  platform                                             multi-family     SFR-JV-1 at weighted
                                                                                                       portfolio        average coupon of
                                                                                                                        2.34%
                                                                                                                        ---
                                                                                                                        $300M Preferred Equity
                                                                                                                        investment led by
                                                                                                                        Blackstone Real Estate
                                                                                                                        Investment Trust

                                                                        4
Investor Presentation - Tricon Residential
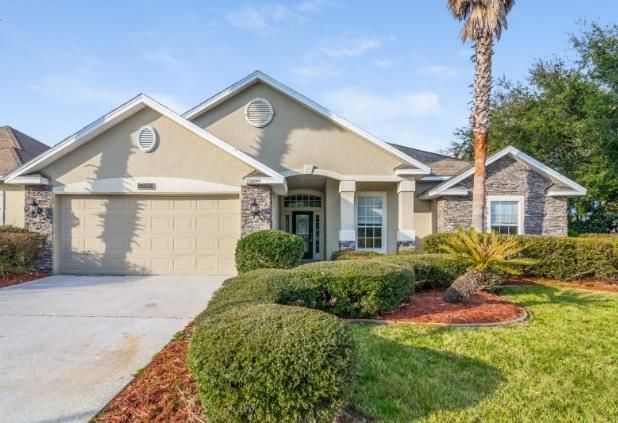
Our Strategic Vision
   Tricon generates predictable cash flow from rental assets and enhances its investment returns with
                       contractual fees earned from managing third-party capital

               Predictable                        Access to                         Centralized
              Rental Income                    Strategic Capital                 Operating Platform

          Generate recurring rental     Raise third-party capital to enhance   Leverage operating synergies
          income from single-family       scale and improve operational        and innovation across single-
            and multi-family rental      efficiency, reduce balance sheet         family and multi-family
                 properties.            exposure to development activities,              portfolios.
                                          and drive return on equity with
                                              incremental fee income.

                                                         5
Investor Presentation - Tricon Residential
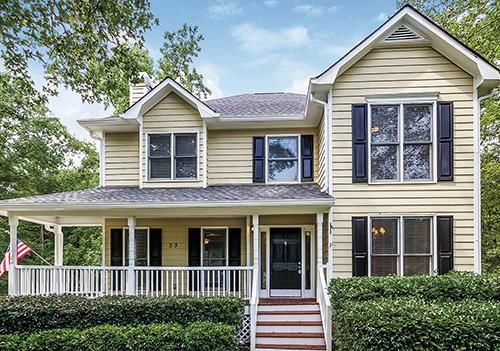
Our New Purpose Statement and Guiding Principles

Our Purpose Statement

Imagine a world where housing unlocks life’s potential

                                 Our Guiding Principles

                                  •    Go above and beyond to enrich the lives of
                                       our residents

                                  •    Commit to and inspire excellence in
                                       everything we do

                                  •    Ask questions, embrace problems, thrive on
                                       the process of innovation

                                  •    Do what is right, not what is easy

                                  •    Elevate each other so together we leave an
                                       enduring legacy

                                        6
Investor Presentation - Tricon Residential
ESG Update
    In Q2, Tricon embarked on several initiatives in support of our commitment to our people and our residents

Living Wage                                                          West Don Lands Block 10 – Indigenous Hub
                                                                     During the quarter, Tricon and its joint venture partners
•   Tricon is establishing a minimum annual base salary              agreed to expand their multi-family portfolio to include
    of $36,400 for full time employees in the U.S. and               Block 10 of the West Don Lands. The highlight of the
    C$46,000 for full-time employees in Canada                       project is the partnership with Anishnawbe Health
•   By paying a living wage, we can provide financial                Toronto in creating Toronto’s first purpose-built
    security for our employees and their families and                Indigenous hub. The hub will include an indigenous
    allow them to live with dignity                                  health center and community gardens as well as an
                                                                     indigenous employment, education, and training center
Our Response to Racism

Tricon is committed to demonstrable and positive action
to acknowledge and counter systemic anti-Black and
anti-minority racism
•   On June 19th, Tricon observed the Juneteenth
    holiday which marks the day in 1865 when anti-
    slavery laws were enforced by the government of
    Texas. We invited our employees company-wide to
    learn about Black history and the challenges
    minorities face
•   Donated to Black Girls Code and Black Boys Code
•   Signed the BlackNorth CEO Pledge, committing to
    ensure that 3.5% of Tricon executive and board
    roles are held by Black leaders by 2025
                                                          Jacksonville, FL

                                                                7
Investor Presentation - Tricon Residential
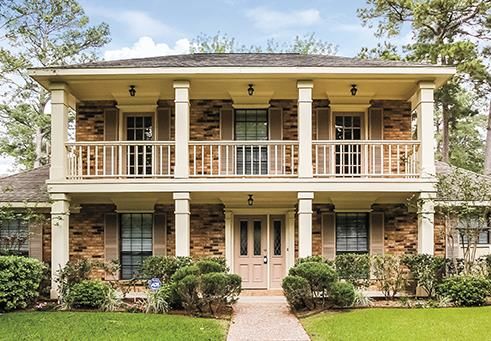
Tricon’s Asset Composition

96% Rental Housing                                                                                            Tricon’s Balance Sheet Asset Mix
      • Recurring rental income                                                                                                                  Residential
                                                                                                                                        CA MF    Development
      • Differentiated middle market focus                                                                                              Rental   4%
Investor Presentation - Tricon Residential
Q2 2020 Core FFO per Share Growth

                        175%
               Year-over-Year Growth
                      (+$0.07)

                                                                                       < $0.01
                                                              $0.03

                                                                                    Lower corporate
                                  $0.04                                             overhead due to
                                                                                 property management
                                                                                    cost efficiencies
                                                        Acquisition of U.S.
                                                        portfolio at the end                                   $0.11
                                                            of Q2 2019

                              Driven by 15%
                            increase in NOI on
       $0.04                larger portfolio and
                                rent growth

Q2 2019 Core FFO per   Single-family rental growth U.S. multi-family portfolio          Other           Q2 2020 Core FFO per
       Share                                             acquisition                                           share

                                                            Jacksonville, FL

                                                                   9
Consolidated Balance Sheet and Liquidity

                                                                                                                                              Q2 Corporate Liquidity
Debt Maturity Schedule
                                                                                                                                             Corporate Credit Facility                      $      500
(including Tricon’s extension options)
                                                                                                                                             Less Amounts Drawn                                   (330)
In millions of U.S. dollars                                                                                                                                                                         33
                                                                                                                                             Plus Unrestricted Cash
                                                                                                                                             Corporate Liquidity                                   203

                                                           2017-1            $461M                                                                            Liquidity enhanced
$1,400                                                                                                                                                        subsequently with $300M
                                                MS Term Loan                 $471M
                                                                                                                                                              Preferred Equity Offering
$1,200
                               2016-1           $354M2

$1,000

                                           Refinanced
 $800                                                                     $932
                                           JV debt                                                                                                                               SFR JV-1
                                           subsequent                                                                                                                            2020
                                           to quarter                                                                                                                            Securitization
 $600                                      end                                          Corporate Credit                         $404
             In discussions                                                             Facility
               to extend                                                                                                                                    $236                       $886
 $400

            US MF Credit
 $200         Facility                         $383                                                                              $364
                                                                          $330                                                                              $313
                    $113                                                                             $156
    $0
                   2020                        2021                       2022                       2023                       2024                       2025                       2026+

                                                                  Corporate             SFR           MF           Development

1. On July 21, 2020, SFR JV-1 closed a $553 million securitization at a weighted average coupon of 2.34% and term to maturity of six years. The proceeds were used to refinance the existing short-term
SFR JV-1 debt
2. Expected to be refinanced in Q4 2020
                                                                                               Jacksonville, FL

                                                                                                      10
The U.S. Sun Belt – A Vast Rental Housing Opportunity
                         The U.S. Sun Belt is home to about ~40% of all U.S. households, and is expected to see
                                      ~60% of the growth in U.S. households over the next decade

 Projected population
 growth in the next 10 years
                                                                                                                                        TORONTO
Tricon’s Middle Market Focus
       Tricon’s U.S. rental strategy is focused on serving the middle market, an addressable market of almost 9
                           million households with strong long-term rentership fundamentals

HOUSEHOLD                                                                  7.1M RENTERS
  INCOME                                        39M                        $1,800+ Monthly Rent

                                                HOUSEHOLDS                   Temporary renters
                                                >$100K                       Higher turnover
                                                                             Higher ownership rate
               $100K

                                                                           8.8M RENTERS
                                                28M                        $1,000 − $1,800 Monthly Rent

                                                HOUSEHOLDS                   Long-term renters
                                                $60K − $100K                 Lower turnover
                                                                             Stable cash flow
                $60K

                                                                           28.2M RENTERS
                                                61M                        < $1,000 Monthly Rent

                                                HOUSEHOLDS                   Higher eviction rates
Our People
              A dynamic, high-performing team of industry leaders and housing experts leading a team
                                           of ~700 dedicated employees

Toronto / San Francisco

32
Investment Team &
Tricon Development Group
                              Gary Berman               Wissam Francis                 David Berman                Geoff Matus             Jonathan Ellenzweig            Kevin Baldrige

61
Finance, Accounting,
                              President & CEO       EVP & Chief Financial Officer     Executive Chairman
                                                                                        & Co-Founder
                                                                                                                    Co-Founder             Chief Investment Officer     Chief Operating Officer

Tax and Legal Team

Houston

105                           Sherrie Suski            David Veneziano                Andy Carmody                 Andrew Joyner              Wojtek Nowak                  Evelyne Dubé
Johnson Development Corp.    Chief People Officer       Chief Legal Officer           Managing Director            Managing Director          Managing Director,           Managing Director,
                                                                                                                                               Capital Markets               Private Funds

Orange County /
Local Field Offices

512
Tricon American Homes         Andrew Gray                Larry Johnson               Douglas Quesnel               Sandra Pereira                David Mark                Gina McMullan
                            Head of Development,            President,              Chief Accounting Officer   SVP, Head of Tax Services   Managing Director, Finance   SVP, Corporate Reporting
                                  Canada            The Johnson Companies LP
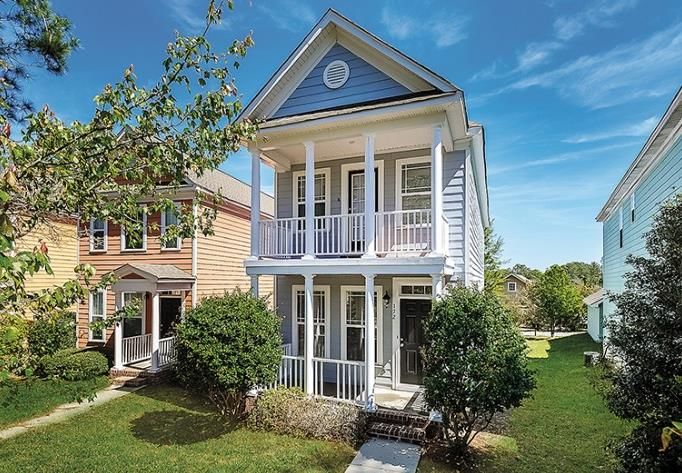
                                                                                    13
Our Single-Family Rental Portfolio
                   Tricon operates one of the largest portfolios of single-family rental homes in the U.S. Sun Belt

21,582                              1,627 SF                            $1,432                   $0.88                    1993           $210,000
Total Homes                         Avg. Home Size                      Avg. Monthly Rent        Avg. Monthly Rent / SF   Avg. Vintage   Avg. Home Value

                                                                                                                                               Charlotte, NC
                                                          Atlanta, GA                                    Houston, TX                           Charlotte, NC

                                                                                                                                                            Atlanta, GA
                                                    Jacksonville, FL                                    Columbia, SC                             Atlanta, GA
                                                  Jacksonville, FL

Note: Homes depicted may not represent all homes in the portfolio.

                                                                                            14
Single-Family Rental: Key Performance Metrics
           Acquisitions                                   Blended Rental Growth                              Same Home NOI Growth
                                                                           7.5% on new leases
                 1,162                                                      3.2% on renewals             11.6%
 977                                                                                                             10.0%
         918
                                                    6.2%     6.1%               5.9%                                      6.5%
                                                                    5.1%                                                          5.5%
                            538                                                          4.5%                                             5.1%

                                    68

Q2 2019 Q3 2019 Q4 2019 Q1 2020 Q2 2020            Q2 2019 Q3 2019 Q4 2019 Q1 2020 Q2 2020               Q2 2019 Q3 2019 Q4 2019 Q1 2020 Q2 2020

  Acquisition program was on pause                    Benefitting from continued strong                    Strong revenue growth and savings
   and resumed in mid-July due to                     demand for institutional SFR from                    from R&M internalization offsetting
              COVID-19                                   middle market households                             higher property tax expenses

                                     Occupancy                                          Annualized Turnover
                                                           97.1%                29.7%    30.0%
                         95.1%    94.4%   94.5%   95.5%
                                                                                                 25.4%
                                                                                                                 23.5%
                                                                                                         21.4%

                         Q2 2019 Q3 2019 Q4 2019 Q1 2020 Q2 2020                Q2 2019 Q3 2019 Q4 2019 Q1 2020 Q2 2020

                            Targeting ~95% by balancing rent                     Focused on driving lower turnover by
                          growth and time on market for vacant                    continually improving the resident
                                         homes                                                experience

                                                                           15
Industry Leading Technology Platform
Innovative technology is at the core of Tricon’s single-family rental operations – from acquisition of homes to
                                         leasing and customer service

                                                                             Cloud
                               Cellular               Broadband
                                                                           Computing
                               Mobility               Networking
                                                                          and Analytics

                  Proprietary TriAD platform filters over
   Home           1 million MLS listing/yr based on 90 point         Revenue       Balancing rent vs. occupancy and
 Acquisitions     criteria with ability to issue a purchase         Optimization   time on market
                  agreement in under five minutes

                  Coded lock boxes allow for secure and                            3D imaging captures and
   Self                                                               Home
                  efficient showings at times that are              Documenting
                                                                                   documents key components of
 Showings
                  convenient for the potential resident                            the home

                                                                                   TriOPS platform enables real-time data
                                                                                   sharing by field staff and head office
                  Automated lease application,                       Repair &
  Leasing         resident underwriting and                         Maintenance    Mobile inventory management for
                  rental payment options                                           maintenance techs
                                                                                   Roof diagnosis using drones

                                                               16
Our U.S. Multi-Family Rental Portfolio
                      Tricon owns a portfolio of high quality affordably priced suburban garden-style apartments
                                                          in the U.S. Sun Belt

  23                                7,289                             966 SF            $1,240                          $1.28                           2012
  Properties                        Total Units                       Avg. Unit Size    Avg. Monthly Rent               Avg. Monthly Rent / SF          Avg. Vintage

                             Falls at Eagle Creek, Houston, TX                                     The Allure, Austin, TX               The Reserves at Alafaya, Orlando, FL

                                               The Callie, Dallas, TX                         Carrick Bend, Denver, CO                       Altis at Sand Lake, Orlando, FL

Note: Representative images are of select units and may not represent all properties.

                                                                                              17
U.S. Multi-Family Rental: Key Performance Metrics
      Blended Rental Growth                               Same Property NOI Growth                                      Occupancy
                         -5.5% on new leases
                                                                  6.8%                                     94.7%    95.2%      94.9%
                            0% on renewals                                                                                             94.4%
                                                         5.6%                                                                                  93.5%
          1.6%                                                           5.0%
  1.4%
                  1.1%      1.1%
                                                                                Consistent
                                                                                with prior
                                     (2.2%)                                        year      (4.9%)
 Q2 2019 Q3 2019 Q4 2019 Q1 2020                        Q2 2019 Q3 2019 Q4 2019 Q1 2020

                                    Q2 2020                                                  Q2 2020
                                                                                                           Q2 2019 Q3 2019 Q4 2019 Q1 2020 Q2 2020

  Focused on driving occupancy since acquiring the portfolio in Q2/2019 and maintaining occupancy throughout current economic climate

                                  Annualized Turnover                                          Value-add Program

                          53.5%
                                   52.9%
                                               51.3%
                                                                                         Plan to renovate the portfolio over
                                                       47.5%                           time at a cost of ~$2,500-$6,000 per
                                                                46.5%
                                                                                          unit and projected average rent
                                                                                            increase of $50-$100/month

                         Q2 2019 Q3 2019 Q4 2019 Q1 2020 Q2 2020

                      Targeting turnover below 50% by continually
                          improving the resident experience

                                                                          18
Our Canadian Multi-Family Rental Portfolio
                             In Canada, Tricon is developing a premier portfolio of build-to-core rental apartments

500                                                             3,695                                           C$3.83                                                     $1.2B                         ~45%
Suites in Lease-up                                              Suites Under                                    Avg. Monthly Rent / SF                                     Cost to Complete1             Tricon
                                                                Development                                                                                                                              Ownership

                                           The Selby, Toronto, ON                                                           The Taylor, Toronto, ON                                            The James, Toronto, ON

                                 West Don Lands, Toronto, ON                                                                    The Ivy, Toronto, ON                                               Labatt, Toronto, ON

Note: Images are renderings.
1. Based on current project plans and Tricon’s underwriting assumptions. Total projected construction cost of $1.46 billion with remaining $1.2 billion mostly funded by construction loans.

                                                                                                                           19
Value Creation - Canadian Multi-Family Rental
    The Canadian Multi-Family Development portfolio is projected to be a significant source of value creation for
                                    Tricon’s shareholders upon stabilization

Development Status & Projected NOI1                                                                                                 Illustrative Value Creation upon Stabilization1

                                                                                                                                                     2 - 3x
                                                                                                                                                   Return on
                       $1,460M                                               $69M                                                                 Investment

 17%                 Cost to date
                       $242M
                                                                             TCN
                                                                            ~$31M                      45%

                 Cost to complete                                                                                                                                                                                        C$1.64
 83%                $1,218M

               (mostly funded by
              construction loans)
                                                                         Third-Party                                                                                                C$0.86
                                                                                                       55%
                                                                           ~$38M
                                                                                                                                               C$0.64

                  Funding Status                          Projected Annual NOI Upon                                                  Current IFRS NAV                      NAV per Share @                      NAV per Share @
                                                                  Stabilization                                                          per Share                          4.00% cap rate                       3.50% cap rate

1. Calculated on a total portfolio basis excluding The Selby, and based on target development yield of 4.75% on cost, with assumed financing of 65% loan-to-cost, and cap rates of 3.50-4.00% representing illustrative cap rates for the downtown Toronto
   Class A multi-family market. Tricon’s equity stake in the portfolio is approximately 30%. There can be no assurance that actual performance will align with these projections.

                                                                                                                           20
Private Funds and Advisory
     Through its private funds and advisory business, Tricon earns fees from managing third-party capital
                                     co-invested in its real estate assets

Fee Revenue by Segment (Q2/2020)                             PF&A AUM Growth

                                                                              30% YOY

                                                                                          $2.4B

   Asset
 Management                                                         $1.8B
    31%
                                         Development
                                         Management
                      $7.3M Q2              64%
                     Fee Revenue

Performance
    Fees
     3%
         Property
        Management
           2%                                                       Q2 2019              Q2 2020

                                                        21
Our Key Priorities1

                                                        • Provide stable, predictable income for shareholders by focusing on defensive
       Grow FFO per                                       rental housing
          Share                                         • Target 10%+ compounded annual growth rate in FFO per Share over three years

                                                        • Raise third-party capital in all our businesses to enhance scale, improve
Increase Third-Party                                      operational efficiency, and drive return on equity with incremental fee income
       AUM
                                                        • Add new third-party equity capital commitments of ~$1B over three years

   Grow Book Value                                      • Build shareholder value by deploying our free cash flow into accretive growth
      per Share                                           opportunities focused on rental housing

                                                        • Minimize corporate-level debt while maintaining prudent and largely non-recourse
  Reduce Leverage                                         leverage at the business segment or asset level
                                                        • Pursue consolidated leverage target of 50-55% net debt to assets

                                                        • Adopt financial disclosure practices that reduce complexity and improve
 Improve Reporting                                        comparability of results with real estate peers

1. Refer to the Forward-Looking Statements on page 1.

                                                                                   22
Performance Dashboard1
  Grow FFO per Share2                                                   Increase Third-Party AUM                                 Grow Book Value per Share
        Target 10%+ compounded                                             Target raising ~$1.0B in fee-bearing                       18% annualized growth since entering
              annual growth                                                   capital over the next 3 years                                      SFR in 2012

                                                                                                                                                                              C$11.37

                                              $0.52 to
                                               $0.57
                                                                                                              ~$3.3B
                        $0.42                                                     $2.4B
                                                                                                                                 C$3.01
 $0.31

 2018                   2019                    2022                              2019                         2022               2012 2013 2014 2015 2016 2017 2018 2019 Q2'20
                                               Target                                                         Target             Book Value per Share does not fully capture the value
                                                                                                                                 from embedded growth in underlying investments

                                     Reduce Leverage3                                                                                     Improve Reporting
           Current Consolidated                                              Targeted Consolidated
                Leverage                                                      Leverage of 50-55%                                  ✓
                                                                                                                                  □ Adopt consolidated accounting
                                                                                                                                  □ Adopt more conventional company-
                                                                                                                                  ✓
                                                                                                            Working towards          wide real estate performance metrics,
                39%                                                             45-50%                      syndication of the       such as FFO / AFFO per share
                                                                                                            U.S. Multi-Family      ✓
                                                                                                                                   □ Enhance financial disclosure practices
                                                                                                             Rental portfolio      □ Adopt comprehensive ESG plan
                           61%                                                            50-55%                                   ✓

                                               Equity        Debt
Refer to “General” and “Forward-Looking Statements” on Page 1
1. USD/CAD exchange rates used are 1.36 at June 30, 2020 and going-forward;1.31 at June 30, 2019
2. All debt figures are presented net of cash and exclude Tricon’s outstanding 5.75% convertible debentures
                                                                                                  Jacksonville, FL

                                                                                                       23
Gary Berman               Wissam Francis                Wojtek Nowak
                        President and             Executive Vice President      Managing Director,
                        Chief Executive Officer   and Chief Financial Officer   Capital Markets

triconresidential.com                             wfrancis@triconcapital.com    wnowak@triconcapital.com
You can also read