OUE Commercial REIT
Presentation for Phillip Securities Virtual Webinar
11 August 2020
←
→
Page content transcription
If your browser does not render page correctly, please read the page content below
OUE Commercial REIT Presentation for Phillip Securities Virtual Webinar 11 August 2020
Important Notice

This presentation should be read in conjunction with the announcements released by OUE Commercial REIT (“OUE C-REIT”) on 23 July 2020 (in relation to its
Financial Results for 2nd Quarter 2020).

This presentation is for information purposes only and does not constitute an invitation, offer or solicitation of any offer to acquire, purchase or subscribe for units in
OUE C-REIT (“Units”). The value of Units and the income derived from them, if any, may fall or rise. The Units are not obligations of, deposits in, or guaranteed by,
OUE Commercial REIT Management Pte. Ltd. (the “Manager”), DBS Trustee Limited (as trustee of OUE C-REIT) or any of its affiliates. An investment in the Units is
subject to investment risks, including the possible loss of the principal amount invested. The past performance of OUE C-REIT is not necessarily indicative of the
future performance of OUE C-REIT.

This presentation may contain forward-looking statements that involve risks and uncertainties. Actual future performance, outcomes and results may differ materially
from those expressed in forward-looking statements as a result of a number of risks, uncertainties and assumptions. These forward-looking statements speak only as
at the date of this presentation. Past performance is not necessarily indicative of future performance. No assurance can be given that future events will occur, that
projections will be achieved, or that assumptions are correct. Representative examples of these factors include (without limitation) general industry and economic
conditions, interest rate trends, cost of capital and capital availability, competition from similar developments, shifts in expected levels of property rental income,
changes in operating expenses (including employee wages, benefits and training costs), property expenses and governmental and public policy changes. You are
cautioned not to place undue reliance on these forward-looking statements, which are based on the Manager’s current view of future events.

Investors should note that they will have no right to request the Manager to redeem their Units while the Units are listed on the Singapore Exchange Securities
Trading Limited (the “SGX-ST”). It is intended that Unitholders may only deal in their Units through trading on the SGX-ST. Listing of the Units on the SGX-ST does
not guarantee a liquid market for the Units.

The information and opinions contained in this presentation are subject to change without notice.

                                                                                                                                                                              2
Agenda
Overview
Financial Performance and Capital Management
Commercial Segment
Hospitality Segment
Impact of COVID-19
Appendices
3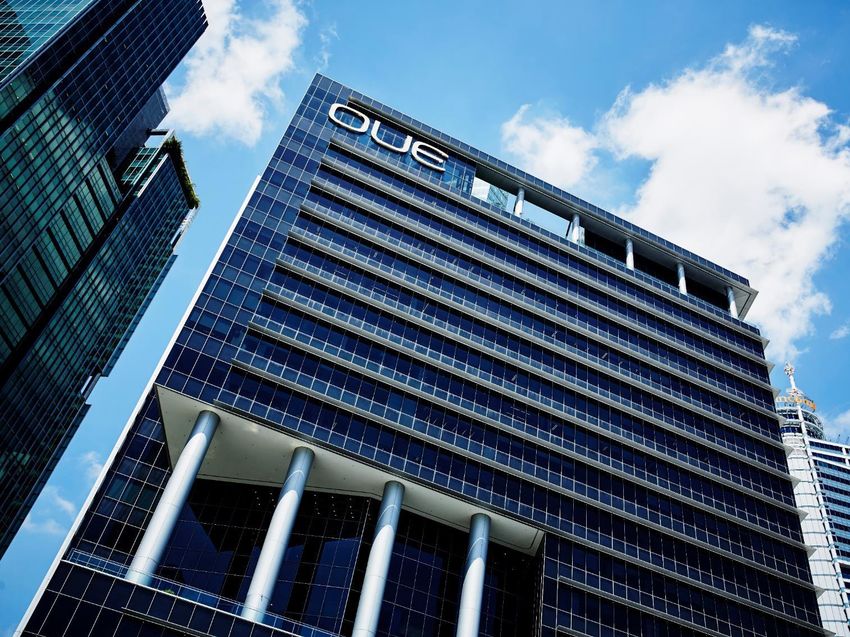
Overview of
OUE C-REIT
Overview of OUE C-REIT
One of the
Largest Diversified
Total assets under management
7 7 High quality
prime assets
SGX-listed REITs S$ 6.8billion (1)
High quality prime assets
3
6 properties in Singapore and 1 Asset classes
property in Shanghai
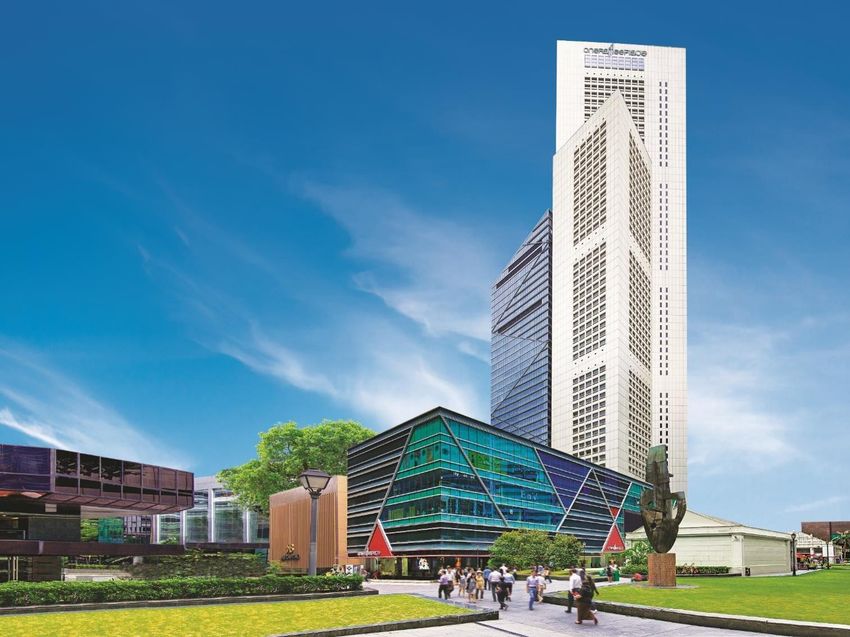
OUE Bayfront One Raffles Place OUE Downtown Office Lippo Plaza Mandarin Orchard Singapore Crowne Plaza Changi Airport Mandarin Gallery
Strong Support Investment Mandate
OUE Group
More than
in net lettable area 2.0 mil sq ft
Commercial
47.8% stake (1)
1,640 upscale
hotel rooms
Hospitality / Hospitality-related
(1) As at 30 June 2020 5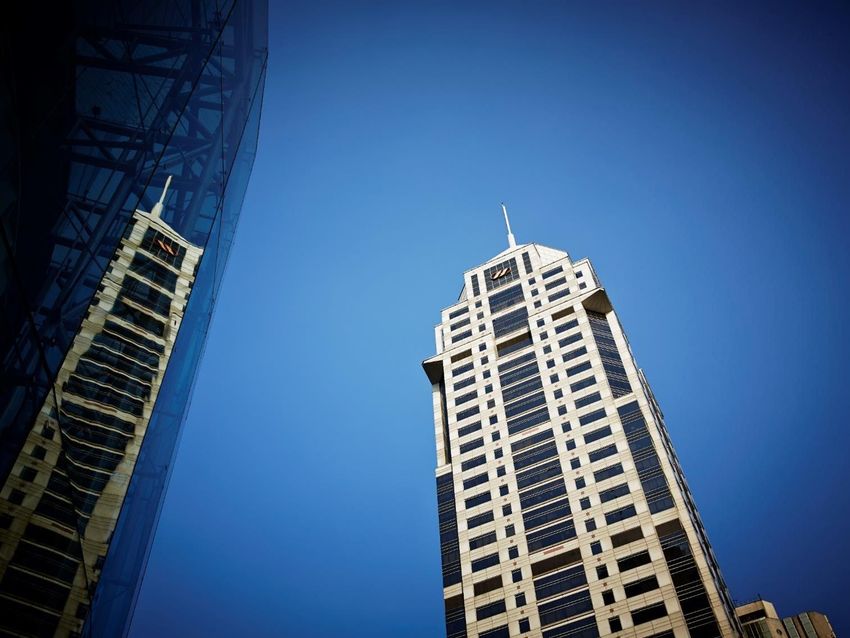
Milestones Since Listing
Total assets under management increased by more than four-folds since listing in 2014
Transformative merger with OUE Hospitality Trust in 2019 creates one of the largest diversified S-REITs FY2019
FY2018
S$6.8b
AUM
FY2016 FY2017
FY2015
S$4.5b
S$3.4b S$3.5b AUM
S$3.4b AUM AUM Completed
FY2014 AUM Debut acquisition
Completed Merger
AEI to issuance of of OUE
Maiden by way of a trust scheme
upgrade S$150 million Downtown
acquisition of arrangement (effective
S$1.6b common 3.03% fixed Office
of One from 4 Sep 2019)
AUM Raffles areas and rate notes
Place restrooms due 2020
(67.95% at Lippo
effective Plaza Commenced AEI at
interest) office tower One Raffles Place
Shopping Mall with
Commenced AEI at One co-working operator
Listed on SGX-ST Established S$1.5
Raffles Place Tower 1 to Spaces anchoring
with two assets – billion Multi-Currency
upgrade mechanical and the AEI
OUE Bayfront and Debt Issuance
Programme engineering equipment
Lippo Plaza
6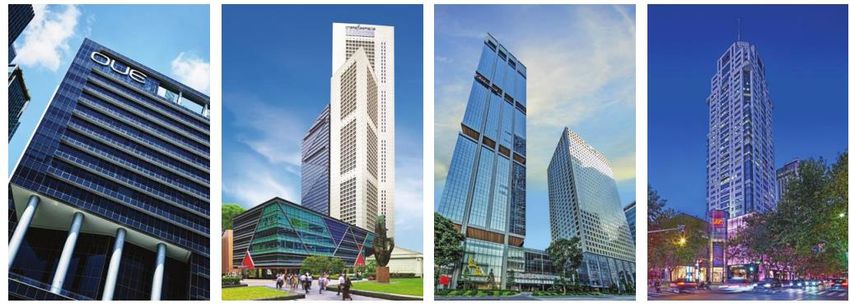
Premium Portfolio of Assets

                            Strategically-located assets in the prime business districts of Singapore and Shanghai

                                                                          OUE Downtown                                                                 Mandarin Orchard           Crowne Plaza
                    OUE Bayfront             One Raffles Place                                          Lippo Plaza            Mandarin Gallery                                                                  Total
                                                                              Office                                                                      Singapore               Changi Airport
Description      A landmark Grade A        Iconic integrated           Grade A office space, a     Grade A commercial         Prime retail            A world class             Award-winning hotel             NLA:
                 office building located   development with two        mixed-used                  building located along     landmark on             hospitality icon in       at Singapore Changi       Office: 1,869,003
                 at Collyer Quay           Grade A office towers       development with            Huaihai Zhong Road         Orchard Road –          Singapore since           Airport and close to       Retail: 307,561
                 between the Marina        and a retail mall located   offices, retail and         within the established     preferred location      1971, Mandarin            Changi Business           Overall: 2,176,564
                 Bay downtown and          in Singapore’s CBD at       serviced residences at      commercial district of     for flagship stores     Orchard Singapore is      Park with seamless
                 Raffles Place,            Raffles Place; latest AEI   Shenton Way, recently       Huangpu in Puxi,           of international        the largest hotel         connectivity to Jewel
                 completed in 2011         completed in 2019           refurbished in 2017         Shanghai                   brands                  along Orchard Road        Changi Airport            1,640 hotel rooms

Attributable     Office: 378,692           Office: 598,814             Office: 530,487             Office: 361,010            Retail : 126,283          1,077 hotel rooms         563 hotel rooms
NLA (sq ft)      Retail: 21,132            Retail: 99,370                                          Retail: 60,776

Occupancy(1)     Office: 100.0%            Office: 91.4%               Office: 91.7%               Office: 81.1%              Retail: 94.4%                      -                        -                 Office: 91.3%
                 Retail: 98.9%             Retail: 96.5%                                           Retail: 85.0%                                                                                            Retail: 93.6%
                 Overall: 99.9%            Overall: 92.2%                                          Overall: 81.7%                                                                                           Overall: 91.6%

Valuation(2)     S$1,181.0m                S$1,862.0m(3)               S$912.0m                    RMB2,950.0m /              S$493.0m                S$1,228.0m                S$497.0m                      S$6,752.3m
                 (S$2,954 psf)             (S$2,667 psf)               (S$1,719 psf)               RMB50,409 psm GFA          (S$3,904 psf)           (S$1.1m / key)            (S$0.9m / key)
                                                                                                   S$579.3m(4)
                                                                                                   (S$1,374 psf)

(1) Committed Occupancy as at 30 June 2020     (3) Based on OUB Centre Limited’s 81.54% interest in One Raffles Place. OUE C-REIT has an indirect 83.33% interest in OUB Centre Limited held via its wholly-owned subsidiaries
(2) As at 31 December 2019                     (4) Based on SGD:CNY exchange rate of 1:5.092 as at 30 June 2020
                                                                                                                                                                                                                                 7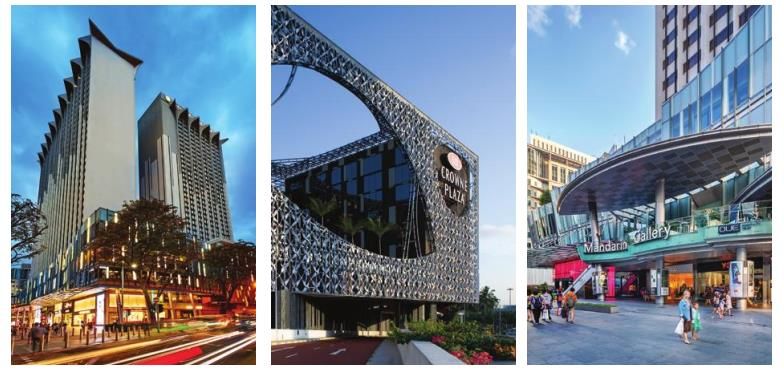
Portfolio Composition
Mandarin Mandarin
Gallery Gallery Hotel master lease
Crowne Plaza 7.3% 5.3% agreements provide
Crowne Plaza
Changi minimum rent of
One Raffles Changi Airport
Airport One Raffles
7.3% Place 8.8%
Place S$67.5 million
Retail
27.6% 22.4% 11.1%
per annum(3)
Lippo Plaza Lippo Plaza Hospitality
9.9% 26.3%
8.6%
By By
By
Asset Revenue
Segment
Value(1) Contribution(2)
Contribution(2)
OUE OUE
Downtown Downtown
Office Office OUE
13.5% 14.6% Bayfront Office
Mandarin 21.5% 62.6%
Orchard
Singapore Mandarin Orchard
OUE Bayfront 18.2% Singapore
17.5%
17.5%
91.4% of assets under management in No single asset contributes more than Hospitality segment revenue was
Singapore 22.4% to total revenue supported by the minimum rent under
the hotels’ respective master lease
agreements
Commercial segment comprises the office and/or retail contribution from OUE Bayfront, One Raffles Place (67.95% effective interest), OUE Downtown Office, Lippo Plaza (91.2% strata interest) and Mandarin Gallery
(1) Based on independent valuations as at 31 December 2019 and SGD:CNY exchange rate of 1:5.092 as at 30 June 2020
(2) For 2Q 2020
(3) Mandarin Orchard Singapore and Crowne Plaza Changi Airport’s master lease agreements are subject to a minimum rent of S$45.0 million and S$22.5 million per annum respectively, totalling S$67.5 million per annum
8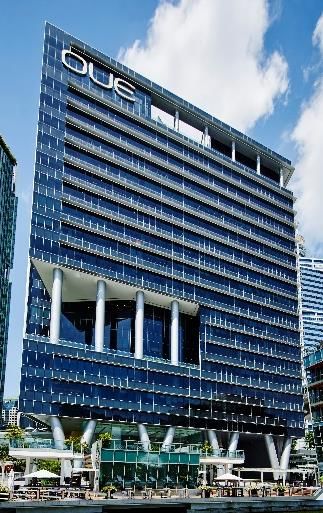
Tenant Base and Portfolio Lease Expiry Profile
                                                Others
                                                          Pharmaceuticals &
                                      Maritime & 1.6%        Healthcare
                                       Logistics               1.4%
                               Services 2.3%
                                3.7%
               Manufacturing &
                                                                                  Hospitality                                                     Office           Retail (1)    Hospitality
                  Distribution
                                                                                   22.3%
                     4.3%
      IT, Media &                                                                                                                                                                                      21.9%
  Telecommunications
          4.4%                                                                                                                         19.2%

           Legal                                                                                                                                           16.4%
           4.5%

                                                                                                                                                                                11.0%
  Real Estate &
Property Services
                                                                                                                             (2)
     4.8%                                                                                                             7.0%                                                                         6.9%
                                                                                                                                                                                               5.0%
     Energy &                                                                                                                                  3.8%            3.4%                  3.8%
    Commodities
       4.9%                                                                                                                  1.6%

                                                                                                                           2020            2021                2022                 2023       2024 and beyond
      Food & Beverage                                                                    Banking, Insurance &
           5.4%                                                                           Financial Services
                                                                                               20.1%
                                                                                                                              WALE(3) of 3.5 years by Gross Rental Income
                           Accounting &
                        Consultancy Services                  Retail                     As of Jun 2020                                                                                         As at 30 Jun 2020
                               9.9%                           10.5%

             Note: Tenant by trade sector is based on gross rental income excluding any provisions of rental rebates
             (1) Refers to contribution from Mandarin Gallery and all other retail components within OUE C-REIT’s portfolio
             (2) Post the quarter-end, 2.9% of office gross rental income remains to be renewed for the balance of 2020
             (3) “WALE” refers to the weighted average lease term to expiry. Based on committed tenancies and excludes turnover rent                                                                                9
Financial Performance &
Capital Management
Key Highlights

Financial             2Q 2020                              2Q 2020                                    1H 2020 Amount Available                            1H 2020
Highlights            Revenue                              Net Property Income                        for Distribution                                    Distribution(1)

                      S$64.3 m                             S$50.4 m                                   S$68.3 m                                           S$54.5 m
                           23.9% YoY                           23.7% YoY                                   40.6% YoY                                         12.1% YoY

Portfolio            Commercial Segment(2)                                    Singapore Office                                     Gross Rental Income Due for
Performance          Committed Occupancy                                      Rental Reversions                                    Renewal for Balance of 2020

                     91.6 %                                                 6.8 % - 14.8%                                                          5.8 %
                     2Q 2019: 94.5%

Capital              Aggregate                           Weighted Average                           % Fixed Rate Debt                          Issued in June 2020
Management           Leverage                            Cost of Debt

                    40.1 %                                3.1 %                                     80.7 %                                     S$100.0 m
                    2Q 2019: 39.3%                       2Q 2019: 3.5%                              2Q 2019: 76.1%                             4.0% Notes due 2025
              (1) After retention of S$13.8 million, of which S$3.0 million is for ongoing working capital requirements
              (2) Commercial segment comprises OUE Bayfront, One Raffles Place (67.95% effective interest), office components of OUE Downtown (“OUE Downtown Office”), Lippo Plaza (91.2% strata
                  interest) and Mandarin Gallery
                                                                                                                                                                                                   11
Summary of Results – 2Q 2020 & 1H 2020
2Q 2020 2Q 2019 Change 1H 2020 1H 2019 Change
(S$m) (S$m) (%) (S$m) (S$m) (%)
Revenue 64.3 51.9 23.9 142.0 107.2 32.4
Net Property Income 50.4 40.8 23.7 112.5 84.3 33.4
Amount Available for
30.7 22.5 36.0 68.3 48.6 40.6
Distribution
Distribution to Unitholders 54.5 48.6 12.1
Distribution per Unit 1.00(1) 1.68(2) (40.5)
Net property income in 2Q 2020 and 1H 2020 of S$50.4 million and S$112.5 million respectively, was higher YoY due primarily to
contribution from Mandarin Gallery, Mandarin Orchard Singapore and Crowne Plaza Changi Airport upon completion of the merger with
OUE Hospitality Trust in 2019. This increase was partially offset by provision for rental rebates to tenants
Amount available for distribution of S$30.7 million in 2Q 2020 and S$68.3 million in 1H 2020 were respectively higher YoY
In view of continued uncertainties posed by the COVID-19 pandemic, S$13.8 million of distribution was retained to preserve financial
flexibility. Consequently, 1H 2020 distribution to Unitholders was S$54.5 million, 12.1% higher YoY
(1) Based on 5,415 million Units in issue and to be issued as at 30 June 2020
(2) Based on 2,872 million Units in issue and to be issued as at 30 June 2019 12Capital Management
Issued S$100 million 4.0% notes due 2025 on 24 June 2020 to refinance existing borrowings
Balance of 2020 debt to be refinanced ahead of maturity, with average cost of debt expected to remain stable
With 80.7% of debt on fixed rate basis, earnings are mitigated against interest rate fluctuations
As at 30 Jun 2020 As at 31 Mar 2020 Debt Maturity Profile as at 30 June 2020
S$ million
Aggregate Leverage 40.1% 40.2%
Total debt S$2,644m(1) S$2,656m(2)
450
Weighted average cost of debt 3.1% p.a. 3.2% p.a. 150
Average term of debt 1.8 years 1.9 years 644
253
425
% fixed rate debt 80.7% 76.6% 342 23
150 107 100
% unsecured debt 41.6% 40.7%
2020 2021 2022 2023 2024 2025
Average term of fixed rate debt 2.1 years 2.1 years Unsecured SGD Loan Secured SGD Loan
Share of OUB Centre Limited's Unsecured SGD Loan MTN
Secured RMB Loan
Interest coverage ratio(3) 2.8x 2.9x
(1) Based on SGD:CNY exchange rate of 1:5.092 as at 30 June 2020 and includes OUE C-REIT’s share of OUB Centre Limited’s loan
(2) Based on SGD:CNY exchange rate of 1:4.885 as at 31 March 2020 and includes OUE C-REIT’s share of OUB Centre Limited’s loan
(3) Interest coverage ratio as prescribed under Appendix 6 of the Monetary Authority of Singapore’s Code on Collective Investment Schemes (last revised on 16 April 2020).
13Commercial Segment
Portfolio Performance – Commercial Segment
2Q 2020 & 1H 2020
(S$ million) (S$ million)
1.0%
8.6%
2.6%
14.1%
108.3 107.2
51.9
47.4
40.8 82.1 84.3
35.0
Revenue Net Property Income Revenue Net Property Income
2Q 2020 2Q 2019 1H 2020 1H 2019
The lower YoY performance in revenue and net property income was mainly due to provisions for rental rebates
extended to tenants to cushion the impact of business disruption caused by COVID-19 pandemic
Rental rebates committed to commercial tenants to date amount to approximately S$13.8 million
15Commercial Segment Occupancy
Commercial segment committed occupancy declined 2.7 percentage points (“ppt”) quarter-on-quarter (“QoQ”) to
91.6% as at 30 June 2020
In Singapore, committed office occupancy eased 2.0 ppt QoQ to 93.7% as the weak economic outlook dampened
leasing momentum, compounded by the suspension of leasing activities during the circuit breaker period
Mandarin Gallery’s committed occupancy fell 3.4 ppt QoQ to 94.4% due to continued operating challenges facing the
retail segment amidst the pandemic situation
Lippo Plaza’s committed office occupancy declined 4.7 ppt QoQ to 81.1% as demand continued to be weak due to
persistent business uncertainty exacerbated by COVID-19
Office: 91.3% Retail: 94.4% Commercial: 91.6%
Market: 97.1%(1)
100.0%
Market: 85.4%(2) 94.4%
91.4% 91.7% 91.6%
81.1%
OUE Bayfront One Raffles Place OUE Downtown Office Lippo Plaza Mandarin Gallery Commercial Segment
(1) Source: CBRE Singapore MarketView 2Q 2020 for Singapore Grade A office occupancy of 97.1% As at 30 Jun 2020
(2) Source: Colliers Shanghai Office Property Market Overview 2Q 2020 for Shanghai CBD Grade A office occupancy of 85.4% 16Office Segment Occupancy
Singapore
Chart Title
100% 100.0%
97.1%
95%
91.7%
91.4%
90%
85%
3Q13
4Q13
1Q14
2Q14
3Q14
4Q14
1Q15
2Q15
3Q15
4Q15
1Q16
2Q16
3Q16
4Q16
1Q17
2Q17
3Q17
4Q17
1Q18
2Q18
3Q18
4Q18
1Q19
2Q19
3Q19
4Q19
1Q20
2Q20
OUE Bayfront One Raffles Place OUE Downtown Singapore Core CBD Office
Shanghai
100%
95%
90%
85% 85.4%
80% 81.1%
75%
3Q13
4Q13
1Q14
2Q14
3Q14
4Q14
1Q15
2Q15
3Q15
4Q15
1Q16
2Q16
3Q16
4Q16
1Q17
2Q17
3Q17
4Q17
1Q18
2Q18
3Q18
4Q18
1Q19
2Q19
3Q19
4Q19
1Q20
2Q20
Lippo Plaza Shanghai CBD Grade A Office
Source: CBRE, Colliers Shanghai
17Committed Office Rents In Line Or Above Market
Singapore office properties continued to achieve rents which were in line or above their respective market rents
Continued to record positive rental reversions across Singapore office properties in 2Q 2020, ranging from 6.8% to 14.8%
Average Expired Comparable Sub-market Rents
2Q 2020 Committed Rents(1) Sub-market
Rents Colliers(2) Savills(3)
Singapore
New Downtown/
OUE Bayfront S$11.50 S$13.20 S$11.98 S$12.98
Marina Bay
One Raffles Place S$8.89 S$8.80 – S$10.20 Raffles Place S$10.29 S$10.17
OUE Downtown Shenton Way/
S$7.32 S$8.00 – S$8.80 S$10.43 S$8.91 – S$9.26
Office Tanjong Pagar
Shanghai
Lippo Plaza RMB9.73 RMB5.50 – RMB10.90 Puxi RMB8.83 RMB10.40(4)
(1) Committed rents for renewals and new leases
(2) Source: Colliers Singapore Office Quarterly 2Q 2020 for Singapore comparable sub-market rents; Colliers Shanghai Office Property Market Overview 2Q 2020 for Shanghai comparable sub-market rents
(3) Source: Savills Singapore Office Briefing 1Q 2020 for Singapore comparable sub-market rents; Savills Shanghai Office Market in Minutes Update 1Q 2020 for Shanghai comparable sub-market rents
(4) Shanghai Grade A office rent for prime districts of Nanjing Road West, Huaihai Middle Road and Lujiazui as defined by Savills
Note: For reference, CBRE Research’s 2Q 2020 Grade A Singapore office rent is S$11.15 psf/mth. Sub-market rents are not published 18Average Passing Rents
S$ psf/mth
11.75 11.85 11.43 11.60 11.98 12.03 12.09 Average passing office rent for all
10.40 10.58 10.26 10.28 9.88
9.92 9.69
9.45 9.68 Singapore office properties
6.94 7.27 7.31 7.39
Singapore improved as of June 2020 due to
(Office) consecutive quarters of positive
rental reversions
2013(1) 2014 2015 2016 2017 2018 2019 1Q20 2Q20
OUE Bayfront One Raffles Place OUE Downtown Office
RMB psm/day
9.89 9.81
9.79
9.65 9.70 9.64 Lippo Plaza’s average passing
9.45
Shanghai 9.14
office rent was stable at RMB9.64
9.06
(Office) psm/day as of June 2020
2013(1) 2014 2015 2016 2017 2018 2019 1Q20 2Q20
Lippo Plaza
S$ psf/mth 24.60
23.60 23.60 23.60
Average retail rent at Mandarin
22.50 22.30 22.47
Mandarin 21.70 21.95 21.95 22.02 Gallery remained stable
Gallery
2014 2015 2016 2017 2018 1Q19 2Q19 3Q19 4Q19 1Q20 2Q20
Mandarin Gallery
(1) Proforma average passing rents as at 30 September 2013 as disclosed in OUE C-REIT’s Prospectus dated 17 January 2014 19Top 10 Tenants – Commercial Segment
Top 10 Tenants
4.9%
4.7%
4.6% By Gross Rental Income 27.2%
2.4%
2.1%
1.9%
1.8% 1.7% 1.7%
1.4%
Bank of Deloitte & Luxury L Brands Allen & Overy Aramco Asia Spaces Virgin Active OUE (1) Hogan Lovells
America Merrill Touche LLP Ventures LLP Singapore Pte. Singapore Pte Limited Lee & Lee
Lynch Ltd. Ltd
As of Jun 2020
(1) Including the hotel master lease arrangements for Mandarin Orchard Singapore and Crowne Plaza Changi Airport, where OUE Limited is the master lessee, OUE Limited’s contribution
to the portfolio by gross rental income is 23.5%
20Lease Expiry Profile - Commercial Segment
11.1% of OUE C-REIT’s commercial segment gross rental income is due for renewal for the rest of
2020. This has been reduced to 5.8% post the quarter-end
By NLA By Gross Rental Income Completed (Year-to-date)
31.1%
29.4%
27.3%
25.3%
9.0% 19.0%
9.1% 16.6%
15.2%
10.7%
14.3%
11.1%
2020 2021 2022 2023 2024 and beyond
WALE of 1.9 years by NLA(1) and 2.2 years by Gross Rental Income
As at 30 Jun 2020
Based on committed tenancies and excludes turnover rent
(1) “NLA” refers to net lettable area 21Lease Expiry Profile by Commercial Property
OUE Bayfront One Raffles Place
WALE: 2.3 years (NLA); 2.3 Years (GRI) WALE: 2.1 years (NLA); 2.1 Years (GRI)
32.3%
34.7% 30.8%
31.3%
25.6% 25.7% 24.7%
23.4%
24.5% 24.5% 24.1%
21.6%
15.1% 15.8% 10.9% 11.8%
11.8% 12.2%
8.2% 8.6%
6.9% 6.6%
4.1% 4.3%
2020 2021 2022 2023 2024 and beyond 2020 2021 2022 2023 2024 and beyond
OUE Downtown Office Lippo Plaza
WALE: 1.2 years (NLA); 1.3 years (GRI) WALE: 2.3 years (NLA); 2.9 years (GRI)
42.1%
2.8%
2.5% 33.3%
30.5%
(1) 28.2% 28.8% 27.3%
39.6% (1)
24.9%
35.0% 22.3% 22.8%
14.8% 13.7% 13.3%
11.4% 10.5%
7.6%
6.6%
3.3% 3.7%
3.6% 2.9%
2020 2021 2022 2023 2024 and beyond 2020 2021 2022 2023 2024 and beyond
(1) Post the quarter-end, 8.3% of NLA and 8.6% of gross rental income remains
to be renewed for the balance of 2020 By NLA By Gross Rental Income Completed (Year-to-date)
As at 30 Jun 2020 22Mandarin Gallery – Stable Performance
Committed Occupancy(1)
Differentiated Tenant Mix
5% 2% 5% 1%
96.8% 99.1% 100.0% 99.5% 98.2% 98.3% 97.8%
94.4%
5%
7%
4%
9%
38%
By NLA 12% 57%
By GRI
3Q18 4Q18 1Q19 2Q19 3Q19 4Q19 1Q20 2Q20
18%
14%
WALE: 2.1 years (NLA); 2.7 Years (GRI(2))
23%
By NLA By Gross Rental Income Completed (Year-to-date)
As of Jun 2020
34.3%
Fashion & Accessories Food & Beverage Hair & Beauty
29.1% Living & Lifestyle Travel Watches & Jewellery
24.5% Services
23.9%
11.0% 19.7%
18.2%
10.3%
12.9% 13.1%
15.2% 9.1%
2020 2021 2022 2023 2024 and beyond
(1) Excludes pop-up stores As at 30 Jun 2020
(2) Excludes turnover rent 23Hospitality Segment
Portfolio Performance – Hospitality Segment
2Q 2020 & 1H 2020
2Q 2020 1H 2020
(S$ million) (S$ million)
33.8
30.4
16.9
15.4
Revenue Net Property Income Revenue Net Property Income
Hospitality segment revenue for 2Q 2020 of S$16.9 million and S$33.8 million for 1H 2020 was the minimum rent under the
master lease arrangements of the hotel properties
OUE C-REIT’s hotel properties have sought alternative demand sources such as healthcare and eldercare workers,
inbound travellers serving out Stay-Home Notices, and workers affected by border shutdowns.
25Portfolio Performance – Hospitality Segment
2Q 2020 & 1H 2020
2Q 2020 RevPAR 1H 2020 RevPAR
(S$) (S$)
79.5% 56.2% 71.7% 63.0% 40.2% 55.6%
196 193 203 198
189
187
112
83 88
75
55
40
Mandarin Orchard Crowne Plaza Changi Hospitality Portfolio Mandarin Orchard Crowne Plaza Changi Hospitality Portfolio
Singapore Airport Singapore Airport
2Q 2020 2Q 2019 1H 2020 1H 2019
For 2Q 2020, Mandarin Orchard Singapore’s RevPAR declined 79.5% YoY to S$40, while RevPAR for Crowne Plaza
Changi Airport declined 56.2% YoY to S$83. Hospitality segment RevPAR was 71.7% lower YoY in 2Q 2020 at S$55.
The relatively smaller decline in RevPAR for Crowne Plaza Changi Airport was due to additional demand from the air crew
segment.
26Re-branding of Mandarin Orchard Singapore to
Hilton Singapore Orchard
Transformational re-branding with addition of new income-generating spaces
to drive growth in sustainable returns and value
Rebranding will allow the hotel to leverage on
Hilton’s strong brand recognition and global sales & distribution network
Re-branded hotel set to become Hilton’s flagship in Singapore and
the largest Hilton hotel in Asia-Pacific
Major refurbishments to complete by end-2021 to capitalise on weak operating environment
due to COVID-19
Expected re-launch of hotel in 2022
Income assurance for Unitholders
Downside protection from master lease throughout phased renovation and ramping-up period
~10% expected return on investment of approx. S$90 mil on a stabilised basis
27Impact of COVID-19
Tenant Support Measures
SG Office (55.4% of Revenue) Less than 10 tenants have invoked the
• Passing on in full property tax rebate from the Singapore Government COVID-19 (Temporary Measures) Act to defer
• Eligible tenants have been extended flexible rental payment schemes
rental payments
Total relief commitment to tenants is
SG Hospitality (26.3% of Revenue) S$13.8 million to date
• Passing on in full property tax rebate from the Singapore Government Includes provision for rental rebates to be
extended to qualifying tenants under the
New Rental Relief Framework for Small
SG Retail (8.4% of Revenue) and Medium Enterprises (“SME”)
announced on 5 June 2020 by the
• Passing on in full property tax rebate from the Singapore Government
Singapore Government(1)
• Various assistance schemes such as rental rebates, flexible rental
payment and rental reductions have been extended to eligible tenants Excludes an estimated S$19.9 million of
support from the Singapore Government,
comprising property tax rebates and
Shanghai Office & Retail (9.9% of Revenue) mandated share of SME relief
• Rental rebates and flexible payment schemes have been extended to
eligible tenants
(1) “Ministry of Law Press Release, New Rental Relief Framework for SMEs, 3 June 2020
URL: https://www.mlaw.gov.sg/news/press-releases/new-rental-relief-framework-for-smes
29Priorities for 2020
Operations
Flexible leasing terms to selected tenants to sustain occupancy and
preserve cash flows
Tenant retention through
Intensified frequency of cleaning and implemented various safe proactive lease management
management measures to ensure a safe and clean environment for
tenants and visitors
Suspension of non-essential capital and operating expenditure across
OUE C-REIT’s properties
Focus on cost management
and cash conservation, and
maintaining financial flexibility
Capital Management
Issued S$100 million of 4.0% notes due 2025 for refinancing existing
borrowings in June 2020. Balance of borrowings due in latter part of
Preserve sustainable long
2020 to be refinanced ahead of maturity. Average cost of debt is term returns for Unitholders
expected to remain stable
Balance sheet remains healthy, with available credit facilities to tap on
where necessary
Asset values would need to correct by ~20%, before regulatory limit
of 50% is reached
30Appendices Singapore Office Market Shanghai Office Market Singapore Hospitality Market Hotel Master Lease Details
Singapore Office Market
Core CBD Grade A occupancy declined 0.5 ppt QoQ to 97.1% in 2Q 2020, while core CBD Grade A office rents
corrected 3.0% QoQ to S$11.15 psf/mth
While the supply of new Grade A office space in the medium-term is limited, both occupancy and office rents are
expected to come under pressure in view of subdued demand as occupiers focus on cost containment
Singapore CBD Grade A Rents and Occupancy Office Supply Pipeline in Singapore (CBD and Fringe of CBD)
('000 sq ft)
11.55
11.40 11.45 11.50 2,500
11.20 11.30 11.30
10.95 10.90 11.15 11.15
10.60 10.40 10.80
10.25 9.90 10.45 97.6%
9.50 10.10 2,000
9.75 96.6% 96.2% 9.40 9.70 96.5%
9.55 9.55 9.30 9.10 9.10
95.8% 96.1% 95.8% 95.9%
95.7% 8.95 8.95 95.2% 97.1%
95.0% 95.2%
95.7% 95.8% 95.6% 94.8% 96.1% 96.1% 1,500
95.2% 95.2% 94.1%
95.1% 93.8% 94.6% 1,258
94.1% 94.1%
93.5% 1,000
92.5%
500 635
650
0 140 131
2Q13 4Q13 2Q14 4Q14 2Q15 4Q15 2Q16 4Q16 2Q17 4Q17 2Q18 4Q18 2Q19 4Q19 2Q20 2020 2021 2022 and beyond
Grade A rents (S$ psf/mth) Core CBD Occupancy
Shenton Way / Robinson Road Fringe CBD
Raffles Place Marina Bay
Note: Excluding strata-titled office
Source: CBRE Research 32Singapore Office
Demand and Supply vs Office Rental
Island-wide Office Demand, Supply and Office Rents
('000 sq ft)
(S$ psf/mth)
7,000 20
6,000 18
16
5,000
14
4,000
12
3,000 10
2,000 8
1,000 6
4
0
2
-1,000
0
-2,000 -2
-3,000 -4
1990 1992 1994 1996 1998 2000 2002 2004 2006 2008 2010 2012 2014 2016 2018 1Q20
Demand (LHS) Supply (LHS) Prime Office Rental (RHS) Prime Grade A Office Rental (RHS)
Source: URA statistics, CBRE Research
2Q 2011 was the last period where CBRE provided Prime Office Rental data. Prime Grade A office rental data not available prior to 1Q 2002
33Shanghai Office Market
Shanghai
100.0%
10.1010.3010.30
10.5010.40 10.40
10.36 10.3510.35
10.3210.27 10.20 10.10
11.00 Shanghai CBD Grade A office occupancy
9.90 10.30 10.21 10.26
9.70
98.0%
9.10 9.20 9.30 9.49 10.15 9.68 9.28 10.00 remained stable in 2Q 2020 at 85.4%.
96.0%
95.0%
94.0%
94.4%
93.8% 96.0% 92.8%
9.00
Rents declined 4.3% QoQ to RMB9.28
8.00
92.0%
92.2%
92.8% 92.6%
94.0%
7.00
psm/day due to intense leasing
89.4% 90.0%
90.0%
90.2%
89.8%
88.4%
87.6% 6.00
competition among landlords
88.0% 87.1% 89.7%
87.6% 86.1% 87.6% 87.5% 85.4% 5.00
86.0%
86.1% 86.5%
Puxi Grade A office occupancy remained
84.0% 85.4% 4.00
82.0% 3.00
80.0% 2.00
relatively stable at 86.9% as at 2Q 2020,
2Q14 4Q14 2Q15 4Q15 2Q16 4Q16 2Q17 4Q17 2Q18 4Q18 2Q19 4Q19 2Q20
while rents corrected a further 3.5% QoQ
CBD Grade A Rents (RMB psm/day) Shanghai CBD Grade A Occupancy
to RMB8.83 psm/day
Puxi
100.0% 9.4 9.5 9.4 9.6 9.5 9.3 9.2 9.14 9.14 9.31 9.46 9.51 9.54 9.55 9.54 9.56 9.46 9.15 10.0
9.0 9.1 9.3
8.8 8.8 8.8 8.83
95.0%
94.9%
9.0
Given the significant office supply
96.3% 93.6%
91.7% 92.2%
90.7%
92.5% 91.9%
90.4%
8.0
pipeline which only peaks in the medium
92.8% 7.0
90.0% 88.6%
89.0%
90.9% 88.5%
87.6% 91.5%
89.7% 90.2% 86.7% 86.9%
term, the rental outlook is expected to
90.0% 85.7% 6.0
85.0% 87.2%
86.2% 5.0
remain subdued
85.3%
4.0
80.0%
3.0
75.0% 2.0
2Q14 4Q14 2Q15 4Q15 2Q16 4Q16 2Q17 4Q17 2Q18 4Q18 2Q19 4Q19 2Q20
Puxi Grade A Average Rent (RMB psm/day) Puxi CBD Grade A Office Occupancy
Source: Colliers International 34Shanghai CBD
Demand, Supply and Vacancy
Grade A Office Net Absorption, New Supply and
Vacancy Rate Office Supply Pipeline in Shanghai CBD
('000 sq m)
('000 sq m)
1,200 16.0%
700
1,000 14.0% 600
600
12.0%
800 500
10.0% 400
600 353
321
8.0% 300 276
400 192
6.0% 200
200
4.0% 100
- 2.0% -
2009 2010 2011 2012 2013 2014 2015 2016 2017 2018 2019 1Q20 2Q20 2020 2021 2022 2023 2024
-200 0.0%
Zhuyuan Old Hongqiao & Gubei
Xujiahui Nanjing Road West
The Bund Huaihai Middle Road & Xintiandi
Net Demand (LHS) New Supply (LHS) Vacancy rate (RHS) Zhongshan Park Jing'an (Other)
Shanghai CBD Grade A office supply expected to
abate after 2022
Source: Colliers International
35Singapore Hospitality Market
For Jan to Jun 2020, due to restrictions on inbound short-term visitors to stem the spread of COVID-19, Singapore visitor
arrivals have fallen 71.4% YoY to 2.7 million
Top source markets saw major declines led by China (-81.4% YoY), Indonesia (-70.2% YoY), India (-77.1% YoY), Malaysia
(-74.9% YoY) and Australia (-62.1%)
The World Tourism Organisation (UNWTO) has forecasted a 58-78% annual decline in international tourist arrivals
worldwide due to COVID-19
Visitor Arrivals in Singapore Singapore Hotel Supply
(million) (No. of Hotel Rooms)
Visitor Arrivals YTD Jun 2020 80,000
70,000
18.5 19.1 60,000
17.4
16.4
15.6 15.1 15.2 50,000
Sep ‘11 and SARS Sub-Prime 14.5
13.2
11.6 40,000
9.8 10.3 10.1 9.7
8.3 8.9 30,000
7.6
6.1
20,000
2.7
10,000
-
2002 2003 2004 2005 2006 2007 2008 2009 2010 2011 2012 2013 2014 2015 2016 2017 2018 2019 2020 2014 2015 2016 2017 2018 2019 2020F 2021F 2022F
Total No. of Rooms Net Increase in Supply New Supply
Source: Singapore Tourism Board, International Visitor Arrival Statistics, JLL Industry Sources
36Singapore Hospitality Market
– Investment in Tourism
Strong Leisure and Events Calendar Tourism Investment
Greater Flight Connectivity
New and increased flights to key markets of China, India, Japan and USA
Partnerships to drive visitor arrivals
STB, CAG and Royal Caribbean collaborated on a new multimillion-dollar five-
year tripartite marketing partnership to promote fly-cruises. The collaboration is
expected to bring some 623,000 international fly-cruise visitors to Singapore and
generate over S$430 million in tourism receipts between end-2019 and 2024
Source: Singapore Tourism Board, Changi Airport Group and Singapore Airlines Media Releases
Upcoming Attractions and Developments
Mandai Nature Precinct
Rejuvenation of Mandai into an
integrated nature and wildlife
destination
New developments include the Bird
Park, Rainforest Park and a Nature
Resorts World Sentosa’s expansion includes new Rejuvenation and Expansion of Mandai
Resort
Greater Southern Waterfront
Rejuvenation of Orchard Road
attractions, hotels and lifestyle offerings (~2027) Nature Precinct (~2020)
Jurong Lake District (JLD)
Set to become the largest commercial
and regional centre outside
Singapore’s CBD
A new tourism development consisting
of an attraction, retail, F&B,
entertainment, hotel and open public
spaces is envisioned to support JLD’s
position as a ‘must visit’ leisure and
Sentosa Redevelopment (~2030) Expansion of Marina Bay Sands to include a 15,000-seat arena, a luxury hotel tower Jurong Lake District recreational cluster
Merlion Gateway (2021 ) and additional MICE space developmental project (~2026)
Information & Image Sources: Websites of Changi Airport Group, Mandai Project, Sentosa Development Corporation, Singapore Tourism Board, Women’s Tennis Association, International Rugby Board, F1, International Champions Cup Singapore, Las Vegas Sands, Resorts World
Sentosa, Singapore Art Week, Singapore Food Festival, Ultra Singapore, Urban Redevelopment Authority of Singapore and The World’s 50 Best Restaurants.
37Hotel Master Lease Details
Property Mandarin Orchard Singapore Crowne Plaza Changi Airport
No. of Guestrooms 1,077 563
Master Lease Variable Rent Comprising Sum of: Variable Rent Comprising Sum of:
Rental (i) 33.0% of MOS GOR(1) ; and (i) 4% of Hotel F&B Revenues;
(ii) 27.5% of MOS GOP(2); (ii) 33% of Hotel Rooms and Other Revenues not related to F&B;
subject to minimum rent of S$45.0 million(3) (iii) 30% Hotel GOP; and
(iv) 80% of Gross Rental Income from leased space;
subject to minimum rent of S$22.5 million(3)
Master Lessee OUE Limited OUE Airport Hotel Pte. Ltd. (OUEAH)
Tenure First term of 15 years to expire in July 2028 First term of Master Lease to expire in May 2028
Option to renew for an additional 15 years on the same Option to renew for an additional two consecutive 5-year terms
terms and conditions
FF&E Reserve Capital Replacement Contribution
3% of GOR Aligned with hotel management agreement between OUEAH and IHG
Generally at 3% of GOR
(1) GOR: Gross operating revenue
(2) GOP: Gross operating profit
(3) The rental under the master lease will be the minimum rent if the amount of variable rent for that operating year is less than the amount of minimum rent
38Thank You
You can also read