Transforming RWE Securing a sound financial base - Essen, 8 March 2016 - RWE AG

Page created by Darren Lindsey
 
CONTINUE READING
Transforming RWE Securing a sound financial base - Essen, 8 March 2016 - RWE AG
Transforming RWE
Securing a sound financial base

Essen, 8 March 2016
Peter Terium      Bernhard Günther   Stephan Lowis
Chief Executive   Chief Financial    Vice President
Officer           Officer            Investor Relations
Transforming RWE Securing a sound financial base - Essen, 8 March 2016 - RWE AG
Forward Looking Statement

      This presentation contains certain forward-looking statements within the meaning
      of the US federal securities laws. Especially all of the following statements

>   Projections of revenues, income, earnings per share, capital expenditures, dividends, capital structure or other financial items
>   Statements of plans or objectives for future operations or of future competitive position
>   Expectations of future economic performance; and
>   Statements of assumptions underlying several of the foregoing types of statements are forward-looking statements. Also words such
    as “anticipate”, “believe”, “estimate”, “intend”, “may”, “will”, “expect”, “plan”, “project”, “should” and similar expressions are intended to
    identify forward-looking statements. The forward-looking statements reflect the judgment of RWE’s management based on factors
    currently known to it. No assurances can be given that these forward-looking statements will prove accurate and correct, or that
    anticipated, projected future results will be achieved. All forward-looking statements are subject to various risks and uncertainties that
    could cause actual results to differ materially from expectations. Such risks and uncertainties include, but are not limited to, changes in
    general economic and social environment, business, political and legal conditions, fluctuating currency exchange rates and interest
    rates, price and sales risks associated with a market environment in the throes of deregulation and subject to intense competition,
    changes in the price and availability of raw materials, risks associated with energy trading (e.g. risks of loss in the case of unexpected,
    extreme market price fluctuations and credit risks resulting in the event that trading partners do not meet their contractual obligations),
    actions by competitors, application of new or changed accounting standards or other government agency regulations, changes in, or
    the failure to comply with, laws or regulations, particularly those affecting the environment and water quality (e.g. introduction of a price
    regulation system for the use of power grid, creating a regulation agency for electricity and gas or introduction of trading in greenhouse
    gas emissions), changing governmental policies and regulatory actions with respect to the acquisition, disposal, depreciation and
    amortisation of assets and facilities, operation and construction of plant facilities, production disruption or interruption due to accidents
    or other unforeseen events, delays in the construction of facilities, the inability to obtain or to obtain on acceptable terms necessary
    regulatory approvals regarding future transactions, the inability to integrate successfully new companies within the RWE Group to
    realise synergies from such integration and finally potential liability for remedial actions under existing or future environmental
    regulations and potential liability resulting from pending or future litigation. Any forward-looking statement speaks only as of the date
    on which it is made. RWE neither intends to nor assumes any obligation to update these forward-looking statements. For additional
    information regarding risks, investors are referred to RWE’s latest annual report and to other most recent reports filed with Frankfurt
    Stock Exchange and to all additional information published on RWE’s Internet web site.

                                                                                               RWE AG | FY 2015 Conference Call | 8 March 2016       2
Transforming RWE Securing a sound financial base - Essen, 8 March 2016 - RWE AG
Agenda

 A
     Peter Terium
     Strategy update

 B
     Bernhard Günther
     Financial performance and outlook for 2016

                                                  RWE AG | FY 2015 Conference Call | 8 March 2016   3
Transforming RWE Securing a sound financial base - Essen, 8 March 2016 - RWE AG
3 steps to securing a sound financial base

     NewCo                           Efficiencies                     Dividend

> Listing of a unique and       > Step up of efficiency       > Dividend policy reflects the
  leading European utility        programme by another          general business situation
  comprising grid, retail and     €500 million                  and market conditions
  renewables businesses
                                > Additional measures         > Proposal for fiscal 2015:
> ~10% capital increase at        largely stemming from         suspension of payment for
  NewCo envisaged to fund         conventional power            common shares and €0.13
  future growth investments       generation                    per preferred share

                                                          RWE AG | FY 2015 Conference Call | 8 March 2016   4
Transforming RWE Securing a sound financial base - Essen, 8 March 2016 - RWE AG
Creation of a unique and leading European utility
taking shape and well on track

                                                   Key milestones

                                                  > December 2015
           RWE AG               NewCo SE            Supervisory Board approval
         shareholders          shareholders
                                                  > March 2016
              100%                                  Nomination of management team
             RWE AG                               > 1 April 2016
   Conventional                          ~10%
                                                    Operational start of NewCo planned
                     Supply &
      power
                     Trading                      > 30 June 2016
    generation
                                                    Full implementation of new structure
                                                    envisaged
                     ~90%
                                                  > Q4 2016
                     NewCo                          Planned IPO of NewCo

      Grid            Retail         Renewables

                                                     RWE AG | FY 2015 Conference Call | 8 March 2016   5
Transforming RWE Securing a sound financial base - Essen, 8 March 2016 - RWE AG
Designated management team for NewCo with long-
standing experience and extensive industry knowledge

Peter Terium                   Bernhard Günther                      Uwe Tigges
> Chief Executive Officer      > Chief Financial Officer             > Chief HR Officer
> 13 years sector experience   > 18 years sector experience          > 32 years sector experience

Hildegard Müller               Martin Herrmann                       Hans Bünting
> COO – Grid                   > COO – Retail                        > COO – Renewables
> 7 years sector experience    > 14 years sector experience          > 20 years sector experience

                                                              RWE AG | FY 2015 Conference Call | 8 March 2016   6
Transforming RWE Securing a sound financial base - Essen, 8 March 2016 - RWE AG
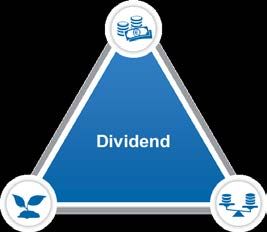
Operational progress in downstream and renewables
businesses provide solid basis for future growth
     Grid                               Retail                                 Renewables

> Commissioning of power-         > Expansion of retail                > Commissioning of Nordsee
  to-gas storage facility to        activities in Slovenia,              Ost and Gwynt y Môr
  stabilise grid                    Poland and Hungary                   offshore wind farms

> RWE-led project                 > Agreement to equip                 > Start of construction of
  “Designetz” selected for          Daimler and VW with                  Nordsee One and Galloper
  government funding                electric vehicle charging            offshore wind projects
                                    solutions

                        Start of numerous initiatives, including
                        > Launch of communication protocol “Lemonbeat”
                        > Introduction of “Bidgely” products in Germany
                        > Collaboration with KnGrid to test smart electric vehicle infrastructure

                                                                   RWE AG | FY 2015 Conference Call | 8 March 2016   7
Transforming RWE Securing a sound financial base - Essen, 8 March 2016 - RWE AG
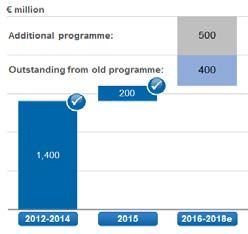
Restructuring plan defined to put RWE npower back
on track

Root causes       > Over-customised billing system resulting in issues delivering accurate
                    and timely bills
                  > Absence of adequate operational controls to detect system issues

Implications      > Write down of anticipated revenues due to erroneous and late billing
                  > Higher provisions for bad debt
                  > Increased levels of opex associated with customer service due to
                    operating defective IT system
                  > Increased levels of customer loss reducing overall margins

Mitigation plan   > Simplification of current billing and customer service IT infrastructure
                  > Introduction of effective management information systems and controls
                  > Establishment of effective end to end business processes and
                    accountability
                  > Implementation of cost and efficiency measures
                  > Focus on competitive pricing position and value adding product offerings

                                                              RWE AG | FY 2015 Conference Call | 8 March 2016   8
Transforming RWE Securing a sound financial base - Essen, 8 March 2016 - RWE AG
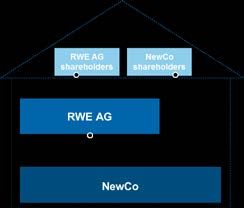
Persistent pressure on conventional power
generation met by continued efficiency efforts
 €/MWh                                                                                                            € million
                  €60
     60                                                                                                             1.200
                                                                                                                    1,200
                                        €51
     50                                                        €48
                                                                                           €41
     40                                                                                                             800
     30
     20                                                                                                             400
     10
      0                                                                                                             0
                 2012                  2013                   2014                        2015

               German 1 year base load forward (lhs)          RWE average realised power price (lhs)
               Net benefit to operating result from efficiency measures at GenCo (rhs)

> Accumulated cost savings and efficiency improvements of approximately €1 billion realised
  between 2012 and 2015

> In total decisions taken for approx. 9 GW capacity measures: 3.7 GW of capacity (partially)
  mothballed; 2.5 GW of capacity shut or to be shut/ 3 GW of contracts cancelled

> Headcount reduction of 3,600 FTEs since 2012

                                                                        RWE AG | FY 2015 Conference Call | 8 March 2016     9
Additional measures identified to improve cash flow
situation for conventional power generation

 Indicative free cash flow situation1                               Measures to improve cash flow situation

                                                                    > Further optimisation of maintenance
                                                                      strategy including reduction of day-to-day
  Coal NL                                          Coal UK
                                                                      capex and opex in order to take
  Gas UK                                           PPAs CE
                          Gas Ger                                     calculated risk vs. lower market
                                                   Lignite            prices/spreads (e.g. reduce overhauls,
  Coal Ger                 Gas NL
                                                    Nuclear           within overhaul spend less, and
  Nuclear                                           (incl. use of     shortening the overhaul)
  (excl. use of                                     provisions)
  provisions)
                                                                    > Renegotiations and further
                                                                      standardisations to reduce external spend
    positive                 neutral               negative
                                                                    > Optimisation of personnel costs

1 Calculated as revenues - cash costs before financing and tax.     > Increase margins via optimisation of
  Based on market parameters as of January 2016.
                                                                      technical plant parameters

                                                                                 RWE AG | FY 2015 Conference Call | 8 March 2016   10
                                                                                                                                    10
Efficiency programme reaches €2.5 billion through
GenCo’s efforts to identify improvement measures

   Net benefit to operating result              Net benefit by division

€ million
                                                                                                      ~60%
                                                 ~10%                                    Conventional Power
Additional programme:                 500        Holding and other                               Generation

Outstanding from old programme:       400        ~10%
                                                 Grids/Participations/
                        200
                                                Other
              
                                                 ~10%
                                                 Supply                    ~ €2.5bn
                                                                           by 2018
      1,400

    2012-2014           2015       2016-2018e                        ~10%
                                                                     Trading/Gas Midstream

                                                                RWE AG | FY 2015 Conference Call | 8 March 2016   11
                                                                                                                   11
RWE maintains disciplined capex approach and
secures investment opportunities

        Day-to-day/maintenance capex of €1.8 billion complemented with up to €700 million in
        potential growth investments

   Day-to-day investments in € billion for 2016          > Total capex for 2016 expected to be
                                                           between €2 – 2.5bn, depending on
~0.4                                                       NewCo IPO
Conventional                                      ~1.2
Power Generation                 Grids/Participations/   > D-t-d investments planned of
                                                Other      approx. €1.8bn

~0.1                                                     > Approx. €1.1bn of d-t-d investments
Supply                                                     intended for regulated grid business
                      ~1.8
~0.1                                                     > Approx. 50% of growth investments
Other                                                      intended for renewables

                                                                      RWE AG | FY 2015 Conference Call | 8 March 2016   12
                                                                                                                         12
Forward-looking dividend policy reflecting the general
business situation

     Dividend proposal for fiscal 2015: suspension of payment for common shares and
     €0.13 per preferred share

                                    Earnings
                                    situation

                                    Dividend

                                                             Leverage
             Growth
                                                             and cash flow
        opportunities
                                                             situation

                                                      RWE AG | FY 2015 Conference Call | 8 March 2016   13
                                                                                                         13
Agenda

 A
     Peter Terium
     Strategy Update

 B
     Bernhard Günther
     Financial performance and outlook for 2016

                                                  RWE AG | FY 2015 Conference Call | 8 March 2016   14
                                                                                                     14
Development of operating result in FY 2015

                                                                                                Earnings in Conventional Power Generation under
 … by division (-€180 million; -4.5%)                                                           pressure mainly due to declining generation
 € million                                                                                      margins.
                FY 2014                                               4,017                     Lower earnings from the disposal of grid assets in
                                                                                                Germany but better performance in Supply NL/B.
       Conventional
    Power Generation                                                   -436
                                                                                                Strong earnings decline in Supply UK especially
   Supply/Distribution
   Networks Germany                                                      -15                    due to process and system-related problems for
                                                                                                our B2C billing. Furthermore, customer losses
             Supply NL/B                                                  48                    and margin decline.

              Supply UK                                                -364                     Asset revaluation linked to the full consolidation of
                                                                                                VSE group leads to a strong improvement of
               CEE/SEE                                                  229                     CEE/SEE operating result.

             Renewables                                                 307                     Strong earnings increase of €307 million in our
                                                                                                renewables business, mainly due to
             Trading/                                                                           commissioning of two large offshore wind farms
       Gas Midstream                                                    -118
                                                                                                and the sale of shares in Galloper wind farm
  Other, consolidation                                                  169                     project and Gwynt y Môr grid connection.

                                                                                                Lower result in trading business in comparison to
                FY 2015                                               3,837
                                                                                                the very good result in 2014.

A detailed overview of the individual value drivers is given on slides 23 to 33 and in the Annual Report on pages 51/52.

                                                                                                     RWE AG | FY 2015 Conference Call | 8 March 2016   15
                                                                                                                                                        15
Development of the earning figures in FY 2015

                                                             +/- vs.   EBITDA distorted by positive one-offs
€ billion                                         FY 2015    FY 2014   from Hamm D hard coal plant termi-
                                                                       nation. Offsetting depreciation only in
            EBITDA                                   7.0       -0.1    operating result line.

                                                                       Non-operating result (NOR) dominated
      Depreciation                                   -3.2      -0.1    by impairments for German und UK
 Operating result                                    3.8       -0.2    conventional power plants (€2.1bn)

    Non-operating                                                      Financial result: improved interest
                                                     -2.9      -3.0    accretion to non-current provisions
           result
                                                                       and positive one-off from the sale of
   Financial result                                  -1.6       0.3    securities.
                Tax                                  -0.6      -0.1    Tax rate for adjusted net income: 31%,
                                                                       after adjustment for depreciation of
Income from DCO1                                     1.5        1.2    deferred tax assets.

 Minorities/hybrids                                  -0.5      -0.1    Income from DCO dominated by book
                                                                       gain from sale of RWE Dea.
      Net income                                     -0.2      -1.9
                                                                       Minorities/hybrids interest increased.
      Adjustments                                    +1.3       1.7    For more details see Annual Report
                                                                       page 55, 56.
     Adjusted net
                                                     1.1       -0.2
         income2                                                       Adjustments to net income comprise
                                                                       in particular non-operating result,
                                                                       depreciation of deferred tax assets
                                                                       and income from DCO.
              1 Income from discontinued operations (DCO).
              2 New term: formerly “recurrent net income”.             RWE AG | FY 2015 Conference Call | 8 March 2016   16
                                                                                                                          16
                Rounding differences may occur.
Development of cash flows from operating activities

 Strong decline in cash flows1 driven by movements in working capital
 € billion

             5.6            -0.6
                                                 +0.3   -0.3
                                                                  -1.1

                                                                                    -0.7

                                                                                                      +0.1                3.3

      CFOA1                                                                                                            CFOA1
                                                                 Procure-            Higher
      FY 2014              Higher            Lower      Other                                        Other             FY 2015
                                                                 ment of            variation
                          variation          use of
                                                                   CO2              margins
                          margins          provisions
                                                                certificates      (hedges for
                       (trading book
                                                                                  other group
                           RWE
                                                                                 subsidiaries)
                          Supply&
                          Trading)

                                             -0.6                                   -1.7

                                       Cash Flow-FFO                     Change in working capital

1 CFOA = cash flows from operating activities.

                                                                                  RWE AG | FY 2015 Conference Call | 8 March 2016   17
                                                                                                                                     17
Strong improvement of net debt after successful
disposal of RWE Dea

€ billion           Cash flows           Capex on         Dividends1      Divestments1        Change               Others
                   from opera-         property, plant                                      in pension,           including
                 ting activities1      and equipment                                          nuclear,           f/x effects
                                       and intangible                                          mining
                                         assets and                                         provisions1
                                          financial
                                           assets1

                                                              +1.1             -6.7
     31.0             -3.3                  +3.2
                                                                            Of which
                                                                                -5.3
   Of which                                                                    from
      1.1                                                                    disposal
     from                                                                        of
                 Negative cash balance: 0.92                                RWE Dea           -0.5               +0.3               25.1
   discon-
    tinued
  operations                                                                                                                      No DCO
    (DCO)                                                                                                                           after
                                    Of which impact from change of pension provisions:                                            disposal
                                    Interest/discount rates related changes in provisions     -1,1                                   of
                                    Other changes in pension provisions                       +0.4
                                    Change in net debt                                        -0.7                                RWE Dea

  Net debt                          Funding CTA (not debt relevant)                           -1,3                               Net debt
31st Dec 2014                       Change of pension provisions in balance sheet             -2.0                             31st Dec 2015

                1 From continuing operations.
                2 Rounding differences may occur.                                           RWE AG | FY 2015 Conference Call | 8 March 2016    18
                                                                                                                                                18
Reliable access to the capital market is key to us

             Significant reduction of net financial debt

 Achievements                             € billion

  Strong decrease of net
  financial debt                               29.9               33.0                30.7            31.01                 25.1         Net debt
  Net financial debt
  (incl. 50% hybrids)/
  EBITDA < 1x (2015)
                                                                      19.9                 19.6           20.6
  Ample liquidity after Dea sale                                                                                                18.8
                                                   16.9
                                                                                                                                          Financial
 Financial policy                                              13.1                                                                        assets
                                            13.0
                                                                                  11.1                                                   earmarked
                                                                                                                  Dea
                                                                                                    9.3                                   to cover
  Access to the capital                                                                                           sale                    >20% of
  market at all times                                                                                                     6.3            provisions
  through…
     •   keeping solid
         investment
         grade rating
     •   first funding of
         provisions                                               2012               2013              2014
                                               2011                                                                         2015
     •   targeting ongoing
         positive cash
         balance                                 Net financial debt incl. 50% of hybrids      Pension, mining and nuclear provisions

                  1 Including €1.1bn net debt from discontinued operations (= RWE Dea).
                    Rounding differences may occur.                                               RWE AG | FY 2015 Conference Call | 8 March 2016     19
                                                                                                                                                       19
Outlook for 2016

                            2015 reported                                     2016e2

     € million

     EBITDA                 7,017                                                                    5,200 – 5,500

   Operating
                                  3,837                                                              2,800 – 3,100
      result

   Adjusted
                                        1,125                                                           500 – 700
net income1

   Dividend3               Common shares:             -                       Oriented towards growth opportunities, indebtedness and
                           Preferred shares:      €0.13                                         earnings situation.

1 New term: formerly ‘recurrent net income‘.
2 The outlook considers the current status of the nuclear fuel tax law. In case the nuclear fuel tax is declared finally illegal and fully in
  our favour, we expect a positive earnings contribution of up to €1.7bn to EBITDA, operating result and adjusted net income.
3 Executive and Supervisory Board propose to the AGM on 20 April 2016 a suspension of the dividend payment to holders of
  common shares for fiscal 2015. For owners of preferred shares, the proposed dividend corresponds to the preferred share of profits
  of €0.13 per share stipulated by the Articles of Incorporation.

                                                                                                           RWE AG | FY 2015 Conference Call | 8 March 2016   20
                                                                                                                                                              20
2016 divisional outlook for the operating result

€ million                                                                           2015 reported1                        2016 forecast2

Conventional Power Generation3                                                            543                     Significantly below 2015

Renewables                                                                                493                     Significantly below 2015

Trading/Gas Midstream                                                                     156                     Significantly above 2015

Grids/Participations/Other                                                               2,008                    Significantly below 2015

Supply                                                                                    824                     Moderately below 2015

1 Some figures are pro-forma due to the change in the reporting structure.
2 Qualifiers such as ‘moderately’, and ‘significantly’ indicate percentage deviations from the previous year’s figures.
3 The outlook considers the current status of the nuclear fuel tax law.

                                                                                                        RWE AG | FY 2015 Conference Call | 8 March 2016   21
                                                                                                                                                           21
Back-up charts
Performance of the Conventional Power Generation
Division
January – December: operating result: -45% (-€436 million)
€ million
                            -   Lower realised electricity generation spreads
    979                     -   Termination of power plant project Hamm D
                 543        -   Impact from the change in nuclear and mining provisions
                            -   Restructuring provisions

    2014          2015
                            +   Efficiency improvements

Outlook for fiscal 2016: significantly below previous year
€ million                   -   Lower realised electricity generation spreads
                            -   Higher costs due to larger plant revision programme
    543                    +   Absence of one-off costs from termination of power plant project
                                Hamm D in 2015
                            +   Efficiency improvements
   2015         2016e

                                                                 RWE AG | FY 2015 Conference Call | 8 March 2016   23
RWE’s forward hedging of conventional electricity
production (German, Dutch and UK portfolio)
As of 31 December 2015

                 >30% >20%       >40% >10%        >40% >10%        >60% >10%        >60% >20%        >80% >40%        >90% >60%      >90% >80%        >90% >90%
  2016 forward

                 31 Dec. 2013    31 March 2014     30 June 2014     30 Sep. 2014     31 Dec. 2014    31 March 2015    30 June 2015    30 Sep. 2015     31 Dec. 2015

                 >30% 50% 70% 80% 80% 40%
Clean Dark (CDS) and Spark Spreads (CSS) –
   2015 - 2017 (forwards for Germany, UK and Netherlands1)

                          Germany                                           UK2                                    Netherlands

        Cal15    Cal16               Cal17                Cal15   Cal16             Cal17             Cal15   Cal16               Cal17
€/MWh                                                                                                                                                €/MWh

  20                                                                                                                                                  20

  15                                                     Ø16.97
                                                                                                                                                      15

                                                                  Ø10.52                                      Ø11.21
  10                                                                                                                                                  10
                                                                                                     Ø9.18                    Ø7.62
        Ø6.63                                                     Ø5.80          Ø5.32
   5                                                                                                                                                  5
                 Ø4.83
                                  Ø 3.98                  Ø3.65                  Ø4.71
   0                                                                                                                                                  0
                                  Ø -1.44
                 Ø-4.34                                                                                                       Ø-3.76
  -5                                                                                                                                                  -5
                                                                                                              Ø-5.43
        Ø-6.84
                                                                                                     Ø-7.52
 -10                                                                                                                                                  -10
             CDS Cal 17 base load                              CDS Cal 17 base load                        CDS Cal 17 base load
             (assumed thermal efficiency: 37%)                 (assumed thermal efficiency: 35%)           (assumed thermal efficiency: 37%)
             CSS Cal 17 peak load                              CSS Cal 17 base load                        CSS Cal 17 base load
             (assumed thermal efficiency: 50%)                 (assumed thermal efficiency: 49%)           (assumed thermal efficiency: 50%)

                          1 Settlement one year ahead (Cal+1).
                          2 Including UK carbon tax.                                               RWE AG | FY 2015 Conference Call | 8 March 2016    25
                          Source: RWE Supply & Trading, prices through to 1 March 2016.
Performance of the Supply/Distribution Networks
Germany Division

January – December: operating result: -0.8% (-€15 million)
€ million
                           -   Lower earnings from the disposal of grid assets
   1,871        1,856
                           +   Weather-induced higher gas demand

                           +   Improved customer base

   2014         2015

Outlook for 2016 see new divisions ‘Grids/Participations/Other’ page 30 and ‘Supply’ page 31.

                                                               RWE AG | FY 2015 Conference Call | 8 March 2016   26
Performance of the Supply Netherlands/Belgium
Division (Essent)

January – December: operating result: +33% (+€48 million)
€ million
                           +   Weather-induced higher gas demand
                           +   Marketing of new supply offerings
                194
    146

    2014       2015

Outlook for 2016 see new division ‘Supply’ page 31.

                                                               RWE AG | FY 2015 Conference Call | 8 March 2016   27
Performance of the Supply United Kingdom Division
(RWE npower)

January – December: operating result: -€364 million
€ million
                           -   Significant process and system-related problems in B2C billing
      227
                               system

                 -137      -   Shift to tariffs with lower margins

                           -   Customer losses and lower energy consumption in the B2C
                               segment
    2014       2015
                           +   Lower costs for ‘Energy Companies Obligation’ (ECO) programme

Outlook for 2016 see new division ‘Supply’ page 31.

                                                                     RWE AG | FY 2015 Conference Call | 8 March 2016   28
Performance of the Central Eastern and
South Eastern Europe Division

January – December: operating result: +33% (+€229 million)
€ million
                           +   Efficiency improvements

                               Slovakia:
                  919
      690                  +   VSE: One-off effect from asset revaluation linked to the full
                               consolidation (+€185 million)

                               Czech Republic:
     2014        2015
                           -   Lower gas storage margins
                           +   Improved regulatory conditions for gas distribution grid
                           +   Weather-induced improvement in gas business
                               Hungary:
                           -   Lower earnings from electricity generation (Mátra)

Outlook for 2016 see new divisions ‘Grids/Participations/Other’ page 30 and ‘Supply’ page 31.

                                                                 RWE AG | FY 2015 Conference Call | 8 March 2016   29
Outlook Grids/Participations/Other

Outlook for fiscal 2016: significantly below previous year
€ million
                            +   Efficiency improvements
    2,008                  -   Increased costs to operate and maintain the distribution grid
                            -+Lower earnings from the disposal of grid assets in Germany
                            - VSE: One-off effect from asset revaluation linked to the full
    2015        2016e           consolidation in 2015 (-€143 million)
  Pro forma

                                                                 RWE AG | FY 2015 Conference Call | 8 March 2016   30
Outlook Supply

Outlook for fiscal 2016: moderately below previous year
€ million
                                East:
                           -    VSE: One-off effect from asset revaluation linked to the full
     824
                 
                               +consolidation in 2015 (-€42 million)

    2015       2016e            UK:
  Pro forma
                           +    Improved earnings from operating activities
                           -    Burdens from restructuring programme

                                                                  RWE AG | FY 2015 Conference Call | 8 March 2016   31
Performance of the Renewables Division
(RWE Innogy)
January – December: operating result: +165% (+€307 million)
€ million
                            +   Increased earnings contribution from growth investments, mainly Nordsee
                                Ost and Gwynt y Môr and sale of grid connection asset of the latter project
                 493
                            +   Weather-induced higher utilisation of wind farms

     186
                            +   One-off from disposal of stake in Galloper wind farm project (+€93 million)
                            +   Positive f/x effects from our UK business

   2014          2015
                            +   Impact of impairments in 2014
                            -   Impairments on UK onshore wind projects and Dutch onshore wind farms

Outlook for fiscal 2016: significantly below previous year
€ million
                            -   One-off from disposal of stake in Galloper wind farm project and grid
     493
                               connection asset of Gwynt y Môr in 2015
                            +   Full-year earnings contribution from new offshore wind farms Nordsee Ost
                                and Gwynt y Môr

                            +   Commissioning of new generation capacity
     2015       2016e           Impact of impairments in 2015
                            +
                                                                      RWE AG | FY 2015 Conference Call | 8 March 2016   32
Performance of the Trading/Gas Midstream Division
(RWE Supply & Trading)
January – December: operating result: -43% (-€118 million)
€ million
                                Trading:
                            -   Trading activities did not reach high earnings level of 2014

                                Supply:
     274                        Still suffering from out of the money long-term gas storage contracts
                 156

     2014        2015

Outlook for fiscal 2016: significantly above previous year
€ million
                                Trading:

                            +   Improvement after below average earnings contribution in 2014
      156                      Supply:

                                Still suffering from out of the money long-term gas storage contracts
     2015       2016e

                                                                       RWE AG | FY 2015 Conference Call | 8 March 2016   33
Financial liabilities and assets
(Excluding hybrid capital as of 31 December 2015)

  Financial liabilities                                    Financial assets                                              Split of
  € billion                                                € billion                                                     securities

 20                                       18.9             20
                         16.5              1.9                                                                                  24%
                          1.0              1.6
 15                                                0.4     15
                          1.3
                                                                    11.0                           11.5
                                                                                            0.8
                                                            0.5
                                                           10                                       2.5
 10                                                                  2.5
                                                            0.6                             0.6
                         14.2             15.0
                                                           5
                                                                     7.4                            7.6
  5
                                                                               0.3    0.5
              2.4
      0.3                                                                      0.2
      0.4     0.9                                          0
                                                                 Short term Long term      Total
      0.8
  0                                                             (≤ 12 months)(> 12 months)                                                                    76%
       Short term Long term               Total
      (≤ 12 months) (> 12 months)

      Bonds, incl.   Collateral, margin payments                 Securities          Collateral, margin payments1            Interest-bearing          Equities
      other notes    received2                                                                                               instruments
      payable1
      Loans          Other: including CP of €0.0bn,              Cash/cash           Other: other financial receiv-
      with           finance leases, financial liabili-          equivalents         ables, financial receivables
      banks          ties with non-consolidated com-                                 from non-consolidated compa-
                     panies, other financial liabilities                             nies, other loans receivable

1 Including currency rate hedges of bonds.
2 Excluding variation margins which are netted against the fair values of the respective derivatives.

                                                                                                                    RWE AG | FY 2015 Conference Call | 8 March 2016   34
Capital market debt maturities and sources
of financing
  Capital market debt maturities1                                                             Sources of funding1

 € billion
 2,0
 2.0                                                                                  18,0
                                                                                       18.0   Syndicated loan facility             €0.0bn out of €4.0bn
                                                                                              (until March 2020)                   (Back up liquidity)

 1,5
 1.5                                                                                  13,5
                                                                                       13.5

                                                                                              Commercial papers
                                                                                                                                    $0.1bn out of $5.0bn
 1,0
 1.0                                                                                  9,0
                                                                                       9.0    (up to 1 year)

 0.5
 0,5                                                                                   4.5
                                                                                      4,5
                                                                                              Senior bonds                                          €12.4bn out
                                                                                              (up to 30 years)                                      of €30bn
 0.0
 0,0                                                                                   0.0
                                                                                      0,0
       2016

               2019

                      2022

                             2025

                                    2028

                                           2031

                                                  2034

                                                          2037

                                                                 2040

                                                                        2043

                                                                               2046

                                                                                              Hybrid bonds
              Maturities of debt issued                  Hybrid (first call date)             (60 years and more)                    €4.0bn

              Accumulated outstanding debt (incl. hybrid)

              Balanced profile with limited maturities
              up to end of 2016 (~ €0.85 billion)

1 RWE AG, RWE Finance B.V. and RWE Finance II B.V. as of 31 December 2015.

                                                                                                                 RWE AG | FY 2015 Conference Call | 8 March 2016   35
Capital market debt: Currency and interest exposure
(as of 31st December 2015)

    Currency exposure1                                                          Interest exposure2

                                                                                                             8%
                                               1

                39%

                                                    61%

                                                                                                                     92%

     €                                                                            Fixed interest payments
     £                                                                            Floating interest payments (fixing expiry ≤ 1 year)

1 Capital market debt (senior bonds and hybrids) including cross-currency swaps.
2 Capital market debt (senior bonds and hybrids) including cross-currency and interest rate swaps.

.
                                                                                                     RWE AG | FY 2015 Conference Call | 8 March 2016   36
Keep up with RWE …

        Follow us on twitter.com/RWE_IR and have a look at www.rwe.com/ir

Important links                                                             Financial Calendar

      Annual and Interim Reports                                                    20 April 2016
      http://www.rwe.com/ir/reports/                                                Annual General Meeting

      Investor and Analyst Conferences                                              12 May 2016
      http://www.rwe.com/ir/investor-and-analyst-conferences/                       Results release on the first
                                                                                    quarter of 2016
      Facts & Figures – the Guide to RWE and the Utility Sector                     11 August 2016
      http://www.rwe.com/ir/facts-figures/                                          Interim report on the first
                                                                                    half of 2016
      IR presentations & further factbooks                                          14 November 2016
      http://www.rwe.com/ir/presentations/                                          Results release on the first
                                                                                    three quarters of 2016
      IR videos
      http://www.rwe.com/ir/videos/

      Consensus of analysts’ estimates
      http://www.rwe.com/ir/consensus-estimates

                                                                       RWE AG | FY 2015 Conference Call | 8 March 2016   37
RWE Investor Relations – contacts
Contacts for Institutional Investors & Financial Analysts

Dr. Stephan Lowis                   Martin Vahlbrock           Gunhild Grieve                         Dr. Holger Perlwitz
Vice President Investor Relations   Tel.: +49 201 12-15055     Tel.: +44 207 015-5459                 Tel.: +49 201 12-15141
Tel. +49 201 12-15031               martin.vahlbrock@rwe.com   gunhild.grieve@rwe.com                 holger.perlwitz@rwe.com
stephan.lowis@rwe.com

Dr. Burkhard Pahnke                 Marcel Rohrbach            Martin Jäger
Tel.: +49 201 12-15182              Tel.: +49 201 12-15043     Tel.: +49 201 12 -15106
burkhard.pahnke@rwe.com             marcel.rohrbach@rwe.com    martin.jaeger@rwe.com

Contact for Private Shareholders

Marisa Weiskirch
Tel.: +49 201 12-44915
marisa.weiskirch@rwe.com

                                                                              RWE AG | FY 2015 Conference Call | 8 March 2016   38
You can also read