Ending Child Marriage - A profile of progress in India - UNICEF Data

Page created by Arnold Jackson
 
CONTINUE READING
Ending Child Marriage - A profile of progress in India - UNICEF Data
Ending Child Marriage
A profile of progress in India
Ending Child Marriage - A profile of progress in India - UNICEF Data
2 I Ending Child Marriage: A profile of progress in India
Ending Child Marriage - A profile of progress in India - UNICEF Data
Child marriage in
the global
development agenda
Child marriage is a violation of human rights. Every    SDG: 5
child has the right to be protected from this harmful   Achieve
                                                        gender equality
practice, which has devastating consequences            and empower all
                                                        women and girls
for individuals and for society. Child marriage is
now firmly on the global development agenda,
                                                        TARGET 5.3                            INDICATOR 5.3.1
most prominently through its inclusion in Sustainable
                                                        Eliminate all harmful                 Proportion of women aged
Development Goal (SDG) target 5.3, which aims to        practices, such as child,             20 to 24 years who were
                                                        early and forced marriage             married or in a union before
eliminate the practice by 2030. Although indicator      and female genital mutilation         age 15 and before age 18

5.3.1 measures child marriage among girls, the
practice occurs among boys as well. Regardless
of gender, marriage before adulthood is a breach
of children’s rights.

                                                                                  Ending Child Marriage: A profile of progress in India I 3
Ending Child Marriage - A profile of progress in India - UNICEF Data
Key facts
                                                     One in three of the world’s child brides live in India. Of the country’s 223
                                                     million child brides, 102 million were married before turning 15.

                                                     Over half of Indian child brides live in five states: Uttar Pradesh, Bihar,
                        5
                                                     West Bengal, Maharashtra and Madhya Pradesh. U
                                                                                                  ​ ttar Pradesh is home to
                                                     the largest population of child brides, with 36 million.

                                                     Approximately one in four young women in India were married or in union
                                                     before their 18th birthday.

                                                     The prevalence of child marriage varies across states and union territories
                                                     in India.​ Over 40 per cent of young women were married before turning 18 in
                                                     Bihar and West Bengal, compared to less than 5 per cent in Lakshadweep.

                                                     A girl’s risk of child marriage depends on certain background
                                                     characteristics. ​Girls who live in rural areas or come from poorer households are
                                                     at greater risk, and a higher proportion of child brides are found among those with
                                                     little or no education.

4 I Ending Child Marriage: A profile of progress in India
The majority of young women who married in childhood gave birth
as adolescents. Child brides go on to have larger families compared to
women who marry later.

The practice of child marriage is less common today than in previous
             ​ here is evidence of accelerating progress over the last decade.
generations. T

India’s progress is strong compared to other countries in South Asia.​
Nonetheless, if child marriage is to be eliminated by 2030, additional efforts
will be required.

Child marriage is less common among boys than girls, and the
practice among boys could be eliminated by 2030 if progress is
accelerated.

                                                       Ending Child Marriage: A profile of progress in India I 5
Current state of child                                                              India is home to 223 million child brides

         marriage among girls
                                                               World                                                                                         650
                                                                                                                                                             million
                                                               South Asia                                   285
                                                                                                            million

             One in three of the
             world’s child brides
             live in India. Of the
             country’s 223 million
             child brides, 102
             million were married
             before turning 15

                                                              India
                                                                                                223
                                                                                                 million

                                                              102 million                                    121 million
                                                               Girls and women were married                   Girls and women were married at or after   = 10 million
                                                               before age 15 in India                         age 15 but before age 18 in India

                                                            FIG. 1 Number of girls and women who were first married or in union before age 18,
                                                                    India, South Asia and the world
                                                            NOTE: Due to rounding, individual figures may not add up to total.

6 I Ending Child Marriage: A profile of progress in India
Uttar Pradesh,
                                Other states and union territories, 16 million                                                         36 million
                                                 Assam, 5 million
                                        Chhattisgarh, 5 million
                                          Odisha, 7 million

   Over half of Indian           Jharkhand, 7 million

    child brides live in     Telangana, 8 million
                                                                                                                                                                Bihar,
    five states: Uttar                                                                                                                                          22 million
 Pradesh, Bihar, West        Gujarat, 10 million

 Bengal, Maharashtra
and Madhya Pradesh.        Karnataka, 10 million

      Uttar Pradesh is                                                                                                                                       West Bengal,
  home to the largest        Tamil Nadu, 11 million                                                                                                          22 million
    population of child
brides, with 36 million          Andhra Praesh, 13 million

                                                                                                                                           Maharashtra,
                                                        Rajasthan, 15 million
                                                                                                                                           20 million
                                                                                                    Madhya Pradesh,
                                                                                                    16 million

                                 FIG. 2 Number of girls and women who were first married or in union before age 18, by state
                                 NOTE: Geographical boundaries follow the National Family Health Survey, 2015-2016. State populations are estimated using data from the Census of India
                                 2011 and the United Nations Department of Economic and Social Affairs, Population Division, 2017.

                                                                                                                            Ending Child Marriage: A profile of progress in India I 7
India ranks fourth among the eight South Asian countries in terms
    of child marriage prevalence

% 0                               10                          20                 30               40                  50                     60

                                                             World        South Asia
                                                              21             30

          Maldives            Sri Lanka                      Pakistan   Bhutan        Afghanistan Nepal                               Bangladesh
                4                  10                          21        26              35        40                                      59

                                                                           India
                                                                             27

    FIG. 3 Percentage of women aged 20 to 24 years who were first married or in union before age 18, countries in South Asia and regional and
            world averages

 8 I Ending Child Marriage: A profile of progress in India
Levels vary across India:
                                                                                                                          More than 40 per cent
                             Jammu and Kashmir
                                                                                                                          of young women were
                                            9
                                                                                                                          married in childhood in
                                   Himanchal Pradesh
                          Punjab      9                                                                                   Bihar (43 per cent) and
                           8
                          Haryana
                                    Uttarakhand
                                         14
                                                                                                                          West Bengal (42 per
                            19
                                Delhi
                                  15                                             Sikkim
                                                                                                 Arunachal Pradesh        cent) compared to 2 per
                                                                                                         28
                                                                                   15                                     cent in Lakshadweep​
                                                      Uttar Pradesh                              Assam Nagaland
           Rajasthan
                                                           21            Bihar                     33    14
                    36                                                    43            Meghalaya
                                                                                                      Manipur
                                                                                           18
                                                                                                      14
                                                                      Jharkhand
       Gujarat               Madhya Pradesh                                   West Bengal           Mizoram
                                                                          38
          26                                                                       42               11
                                       33
                                                      Chhattisgarh
                                                                                               Tripura
                                                           21
                                                                      Odisha                   33
Daman and Diu
                     Maharashtra                                        22
           25
                           26
   Dadra and
 Nagar Haveli                             Telangana
          30                                     27
                    Goa
                     10               Andhra Pradesh
                                                34                                           Andaman and                       Above 40%
                          Karnataka                                                         Nicobar Islands
                                24                                                                  18                         31% - 40%
   Lakshadweep
                                                         Puducherry
                2                    Tamil Nadu                                                                                21% - 30%
                                                         11
                           Kerala         16                                                                                   11% - 20%
                                 8
                                                                                                                               10% or less

                                                                                                                          NOTE: This map does not reflect a position by UNICEF
FIG. 4 Percentage of women aged 20 to 24 years who were first married or in union before                                on the legal status of any country or territory or the
         age 18, by state or union territory                                                                              delimitation of any frontiers.

                                                                                                                     Ending Child Marriage: A profile of progress in India I 9
Girls most at risk of                                                                     Child brides in India are more likely to live
                                                                                                   in poor households, have less education
         child marriage                                                                            and reside in rural areas

          100

          90

          80

          70

          60
                           51
          50                               47
                                                                                     46

          40                                                                                     37

                                                                                                                                                 32
                                                             29                                               29
          30

                                                                                                                            20
          20                                                                                                                                               18

                                                                                                                                     10
          10
                                                                     4

            0
                      No education       Primary       Secondary   Higher          Poorest      Fourth       Middle        Second   Richest      Rural    Urban

                   Education                                                     Wealth quintile                                              Residence

                                  Married before age 15                     Married at or after age 15 but before age 18

                  FIG. 5 P
                          ercentage of women aged 20 to 24 years who were first married or in union before ages 15 and 18, by education, wealth
                         quintile and residence

10 I Ending Child Marriage: A profile of progress in India
Education
                                                                                                                                                     The largest
                             No education                        Primary                         Secondary           Higher
                                                                                                                                                     disparities in the
Wealth quintile

                                                                                                                                                     prevalence of
                  Richest

                                   30             25                   32             29             19       18          4       2                  child marriage
                                                                                                                                                     are found across
                                                                                                                                                     women with
                  Second

                                   38             34                   38             38             27       23          4       3
                                                                                                                                                     different levels
                                                                                                                                                     of education
                  Middle

                                   49             41                   45             46             31       28          6       6
                  Fourth

                                   52             47                   50             45             34       32          8       2
                  Poorest

                                   56             51                   52            49              36       34          9      (5)

                                 Rural         Urban                 Rural          Urban          Rural     Urban      Rural   Urban

                              Residence

                            FIG. 6 P
                                    ercentage of women aged 20 to 24 years who were first married or in union before age 18,
                                   by education, wealth quintile and residence
                            NOTE: The value in parentheses is based on 25-49 unweighted cases.

                                                                                                                                      Ending Child Marriage: A profile of progress in India I 11
Smaller disparities in child marriage prevalence are found across
   women from different religious groups and castes/tribes​

        Religion                                                                                                               Caste/Tribe
100                                                                                                                    100

 90                                                                                                                      90

 80                                                                                                                      80

 70                                                                                                                      70

 60                                                                                                                      60

 50                                                                                                                      50        49

 40       38                                                                                                             40
                                                                                                                                                 34
                                                                                                                                                               31
                         28                                                                                                                                                 30
 30                                    27           (27)                                                                 30                                                               27
                                                                   21                                                                                                                                   21
 20                                                                               18                                     20

 10                                                                                               8                      10
                                                                                                                6

  0                                                                                                                       0
         Other         Hindu        Muslim           No         Buddhist/   Christian           Sikh           Jain               Don’t      Scheduled      No caste/    Scheduled   Other           Other caste/
                                                   religion    Neo-Buddhist                                                       know         tribe          tribe        caste   backward             tribe
                                                                                                                                                                                     class

                    Married before age 15                               Married at or after age 15 but before age 18

       FIG. 7 Percentage of women aged 20 to 24 years who were first married or in union before ages 15 and 18, by religion and caste/tribe

       NOTE: Only categories with 25 or more unweighted cases are presented. The value in parentheses is based on 25-49 unweighted cases. “Scheduled castes” and “scheduled tribes” are officially designated
       groups by the Indian Government, referring to the most disadvantaged socio-economic groups in India.

12 I Ending Child Marriage: A profile of progress in India
State-level overview
100
                                                                                                                                                                                                                                                                                      The states featured on
90                                                                                                                                                                                                                                                                                    this page have the highest
80                                                                                                                                                                                                                                                                                    prevalence of child marriage
 70                                                                                                                                                                                                                                                                                   in the country (Bihar, West
                                                                                                                                                                                                                                                                                      Bengal, Jharkhand, Rajasthan
60
                                                                                                                                                                                                                                                                                      and Andhra Pradesh), the
50
                       43                   42                                                                                                                                                                                                                                        largest population of child
                                                                                   38                                    36
40
                                                                                                                                                    34                           33
                                                                                                                                                                                                                                                                                      brides (Bihar, West Bengal,
30                                                                                                                                                                                                                  26                                                                Madhya Pradesh, Maharashtra
                                                                                                                                                                                                                                                           21                         and Uttar Pradesh) or both
 20
                                                                                                                                                                                                                                                                                      (Bihar, West Bengal).
 10

  0
                   Bihar              West Bengal                        Jharkhand                             Rajasthan                 Andhra Pradesh              Madhya Pradesh Maharashtra                                                     Uttar Pradesh

             Married before age 15                                                                              FIG. 8 Percentage of women aged 20 to 24 years who were first
             Married at or after age 15 but                                                                                       married or in union before ages 15 and 18, selected states
             before age 18

        Education                                 No education                  Higher than secondary                             Wealth quintile                                                           Poorest               Richest                   Residence                                                           Rural                   Urban
 100                                                                                                                      100                                                                                                                        100

  90                                                                                                                      90                                                                                                                          90

  80                                                                                                                      80                                                                                                                          80

  70
 70                                                                                                                       70
                                                                                                                          70                                                                                                                          70

  60
 60                                                                                                                       60
                                                                                                                          60                                                                                                                          60

  50
 50                                                                                                                       50
                                                                                                                          50                                                                                                                          50

  40
 40                                                                                                                       40
                                                                                                                          40                                                                                                                          40

  30
 30                                                                                                                       30
                                                                                                                          30                                                                                                                          30

  20
 20                                                                                                                       20
                                                                                                                          20                                                                                                                          20

 1010                                                                                                                     10
                                                                                                                          10                                                                                                                          10

  00                                                                                                                          0                                                                                                                        0
         West Bengal

                        Bihar

                                Jharkhand

                                            Rajasthan

                                                                                                                                   West Bengal

                                                                                                                                                 Bihar

                                                                                                                                                         Jharkhand

                                                                                                                                                                                                                                                                West Bengal
                                                                                                                                                                                                   Andhra Pradesh

                                                                                                                                                                                                                    Maharashtra

                                                                                                                                                                                                                                    Uttar Pradesh

                                                                                                                                                                                                                                                                              Bihar

                                                                                                                                                                                                                                                                                       Jharkhand
                                                        Madhya Pradesh

                                                                          Andhra Pradesh

                                                                                           Maharashtra

                                                                                                         Uttar Pradesh

                                                                                                                                                                     Rajasthan

                                                                                                                                                                                  Madhya Pradesh

                                                                                                                                                                                                                                                                                                   Rajasthan

                                                                                                                                                                                                                                                                                                               Madhya Pradesh

                                                                                                                                                                                                                                                                                                                                 Andhra Pradesh

                                                                                                                                                                                                                                                                                                                                                  Maharashtra

                                                                                                                                                                                                                                                                                                                                                                Uttar Pradesh
  FIG. 9 Percentage of women aged 20 to 24 years who were first married or in union before age 18, by education, wealth quintile and residence​, selected states

                                                                                                                                                                                                                                                            Ending Child Marriage: A profile of progress in India I 13
Early childbearing                                                                    Marrying in childhood has repercussions on a
         among child brides                                                                    woman’s age at first birth and her family size

                                                       100
             The majority
             of young                                   90
             women who
                                                        80                      79
             married during                                                                                      75
             childhood gave                             70
             birth before
             they completed                             60
             adolescence
                                                        50

                                                        40

                                                        30

                                                        20
                                                                                                                                                   14
               Gave birth before age 18
                                                        10
               Gave birth at or after age
               18 but before age 20                          0
                                                                       Married before age 15           Married at or after age 15       Married at or after age 18
                                                                                                          but before age 18

                                                                 FIG. 10 Percentage of ever-married women aged 20 to 24 years who gave birth before ages 18 and 20,
                                                                          by age at marriage

14 I Ending Child Marriage: A profile of progress in India
Child brides have many children to care for at a young age, and also
 go on to have larger families compared to women who marry later​

50

40

                                                                    Married before age 15
30

          25

20

                                                                    Married at or after age 15 but before age 18
                              12
10

                                                  2
 0
      Married before    Married at or after   Married at or
         age 15         age 15 but before     after age 18
                                                                    Married at or after age 18
                             age 18

FIG. 11 P
         ercentage of ever-married women aged 20 to 24 years who   FIG. 12 Median number of children of ever-married women
        have had 3 or more children, by age at marriage                      aged 45 to 49 years, by age at marriage

                                                                                      Ending Child Marriage: A profile of progress in India I 15
Madhya Pradesh

                                                                                                                                                                                                                                         Rajasthan
                                                                                                                    Andhra Pradesh
                                                                              India

                                                                                                                                                                                 Bihar
                                                                                                                                                                Jharkhand
                                                                                                 West Bengal

                                                                                                                                             Maharashtra

                                                                                                                                                                                                                    Uttar Pradesh
   Many states show
                                                             100
    disparities in early
childbearing between                                         90

      child brides and
                                                             80
 non-child brides; the
 greatest differences                                        70
    are found in West
    Bengal among the                                         60

             key states​
                                                             50

                                                             40

                                                             30

                                                             20

                                                             10

                                                                                                                                                                                                               64

                                                                                                                                                                                                                                    63
                                                                                                               82
                                                                                            87

                                                                                                                                                                            73
                                                                                                 20

                                                                                                                    20

                                                                                                                                                                                         72
                                                                                                                                                           78
                                                                       76

                                                                                                                                        81
                                                                                                                                             15

                                                                                                                                                                18

                                                                                                                                                                                              12

                                                                                                                                                                                                                                         10
                                                                            14

                                                                                                                                                                                 14

                                                                                                                                                                                                                    9
                                                              0

                                                                            Married before age 18                                    Married at or after age 18

                                                                   FIG. 13 Percentage of ever-married women aged 20 to 24 years who gave birth before age 20 by
                                                                            age at marriage, India and selected states

16 I Ending Child Marriage: A profile of progress in India
Ending Child Marriage: A profile of progress in India I 17
Generational trends in                                                                                                   The practice of child marriage in India
                                                                                                                                 is less common today than in prior
        reducing child marriage                                                                                                  generations

        100
                                                                                                                                                                          Over the
         90                                                                                                                                                               last decade,
          80         74
                                                                                                                                                                          progress
                                     71
          70                                        67                                                                                                                    has been
                                                                    65
                                                                                   61
                                                                                                   58
                                                                                                                                                                          accelerating​
          60
                                                                                                                   50
          50                                                                                                                      47
                     42
                                     38                                                                                                           37
          40                                        35              33
                                                                                   30                                                                            27
                                                                                                   28
          30
                                                                                                                  23
                                                                                                                                  18
          20
                                                                                                                                                  13
          10
                                                                                                                                                                  7

            0
                    1970            1975           1980            1985            1990           1995            2000           2005            2010           2015

                        Married before age 18                            Married before age 15

          FIG. 14 Percentage of women aged 20 to 24 years who were first married or in union before ages 15 and 18

          NOTE: This trend analysis is based on the prevalence of child marriage across age cohorts, as measured in the National Family Health Survey (NFHS) 1992-1993,
          1997-1998, 2005-2006 and 2015-2016. See technical notes for details.

18 I Ending Child Marriage: A profile of progress in India
India’s progress in the                                                              Important advances have been made in reducing
  past decade is one of the                                                            child marriage, including in high-prevalence and
  strongest among countries                                                            high-burden states ​
  in South Asia

Table 1. Average annual rate of reduction and                                 100
current prevalence of child marriage, percentage
of women aged 20 to 24 years who were first                                   90
married or in union before age 18
                                                                              80

                                                                               70
                           Average annual rate      Current prevalance
                           of reduction of child   of child marriage (%)      60
                               marriage (%)
                                                                              50

     Maldives                      21.2                      4                40

                                                                              30
     India                         5.5                      27
                                                                              20
     Pakistan                      4.5                      21
                                                                               10
     Afghanistan                   3.6                      35                  0
                                                                                         India

                                                                                                                 Madhya Pradesh

                                                                                                                                       Andhra Pradesh

                                                                                                                                                        Bihar

                                                                                                                                                                                   Rajasthan

                                                                                                                                                                                               West Bengal

                                                                                                                                                                                                             Jharkhand

                                                                                                                                                                                                                         Maharashtra
                                                                                                                                                                   Uttar Pradesh
     Nepal                         2.7                      40

     Bhutan                        2.6                      26

     Sri Lanka                     2.4                      10

     Bangladesh                    2.2                      59                             25 years ago                           10 years ago                  Today

NOTE: Table includes all countries in South Asia with nationally                    FIG. 15 Percentage of women aged 20 to 24 years who were first married or in
representative data on child marriage. Countries are ranked from highest to
                                                                                             union before age 18, selected states
lowest according to the 10-year rate of reduction. Caution is warranted in
interpreting these rates, as in some cases the differences in prevalence in
the last 10 years may not be significant.​                                          NOTE: See technical notes for details on the calculation of trends at the state level.

                                                                                                                                                                 Ending Child Marriage: A profile of progress in India I 19
Looking ahead                                                                  Compared to the last 10 years, progress will need
                                                                                       to be four times faster to eliminate child marriage
        towards elimination                                                            by 2030

         100
                                                                                                                            If progress is
          90                                 Percentage of women aged 20 to
                                                                                                                            accelerated,
                                             24 years who were first married or
                                             in union before age 18
                                                                                                                            1 in 20 young
          80
                   74                                                                                                       women in
          70                                                                                                                India will have
                                                      61
                                                                                                                            married in
          60
                                                                                                                            childhood in
          50                                                         47                                                     2030 compared
                                                                                                                            to one in four
          40                                                                              Percentage of women aged 20 to
                                                                                          24 years expected to be married
                                                                                                                            today
                                                                                  27      or in union before age 18 if:
          30

          20                                                                                                                9 Progress of the past
                                                                                                                              25 years continues

          10                                                                                                                4 Progress of the past
                                                                                                                              10 years continues

           0                                                                                                                1 Progress of the past
                                                                                                                              10 years doubles
                1970 1975 1980 1985 1990 1995 2000 2005 2010 2015 2020 2025 2030 2035 2040 2045 2050

               FIG. 16 O
                        bserved and projected percentage of women aged 20 to 24 years who were first married or
                       in union before age 18​
               NOTE: See ‘How to read the projections’ on page 26.

20 I Ending Child Marriage: A profile of progress in India
In order to meet

                   India

                                        Bihar

                                                            West Bengal

                                                                                  Jharkhand

                                                                                                          Rajasthan

                                                                                                                                  Andhra Pradesh

                                                                                                                                                               Madhya Pradesh

                                                                                                                                                                                         Maharashtra

                                                                                                                                                                                                                   Uttar Pradesh
                                                                                                                                                                                                                                   the SDG target
                                                                                                                                                                                                                                   of eliminating
                                                                                                                                                                                                                                   child marriage by
                                                                                                                                                                                                                                   2030, substantial
                                                                                                                                                                                                                                   acceleration will
                                                                                                                                                                                                                                   be required

30

                                    25.1                24.9
                                                                                24.3
25                                                                                                    23.8                    23.4                         23.3
              22.0                                                                                                                                                                   21.8
                                                                                                                                                                                                               20.4
20

15

                                                                                                                                                                                                             9.3
10

             5.5                                                                                                            5.7                          5.5
                                                                                                    5.1                                                                                                5.1
 5                                                                          4.0                                                                                                    4.2
                                  3.7                                                                                 3.4                          3.5
       3.2                                            2.7                                     2.8                                                                               2.9
                            2.4                                           2.2
                                                1.9

 0

       Average annual rate of reduction:
               Observed in the past 25 years                              Observed in the past 10 years                                              Required for elimination by 2030

     FIG. 17 Average annual rate of reduction (%) in the percentage of women aged 20 to 24 years who were first
               married or in union before age 18 observed and required for elimination, India and selected states​

                                                                                                                                                                                                              Ending Child Marriage: A profile of progress in India I 21
Child marriage                                                                                      Child marriage among boys does occur in
                                                                                                            India, but at levels much lower than those
        among boys in India                                                                                 seen in the past

          50
                                                                                                                                                            Only 1 in 25 men
                                                                                                                                                            were married before
          40
                                                                                                                                                            age 18, but one in
                                                                                                                                                            five were married
                                                                                                                                                            before the legal age
          30                                                                                                                                                of 21

                                                                                                                 21
          20

          10
                                                                                                                  7
                                              4

                                              1                                                                   2
           0
                                Men aged 20 to 24 years                                                 Men aged 25 to 29 years

                       Married before age 15                 Married at or after age 15 but before 18        Married at or after age 18 but before age 21

                  FIG. 18 Percentage
                                   of men aged 20 to 24 years and 25 to 29 years who were first married or in union
                          before ages 15, 18 and 21

22 I Ending Child Marriage: A profile of progress in India
The practice of child marriage among boys could be
     eliminated by 2030 if progress is accelerated

50

40

30
                                 Percentage of men aged 20 to 24
                                 years who were first married or in
                                 union before age 18

         19
20

                                                                                        Percentage of men aged 20 to 24
                                                                                        years expected to be married or in
                                                                                        union before age 18 if:
                                                              9                                                                          0.5 Progress of the past
10
                                                                                                                                                25 years continues
                                                                           4
                                                                                                                                         0.3 Progress of the past
                                                                                                                                                10 years continues

 0                                                                                                                                       0.0 Progress of the past
        1980      1985       1990       1995       2000     2005   2010   2015   2020   2025   2030   2035    2040   2045      2050
                                                                                                                                                10 years doubles

      FIG. 19 Observed and projected percentage of men aged 20 to 24 years who were first married or in union
                before age 18​
      NOTE: See ‘How to read the projections’ on page 26.

                                                                                                                      Ending Child Marriage: A profile of progress in India I 23
Working to empower                                                                           India’s 253 million adolescents should be
                                                                                             active participants in their own path to
adolescents and end                                                                          adulthood

child marriage in India
Most girls and boys in India are excluded from decisions that determine the           adolescent voices to be amplified, challenging gender norms and forging new
trajectory of their lives.                                                            socio-economic opportunities for young people as they become adults.

As they become adolescents and social and economic pressures mount,
Indian girls are often deprived of the right to move freely and make choices
                                                                                      Access to education and opportunity
about their work, education, marriage and social relationships. Often, they
                                                                                      Many girls are lost in the transition to secondary school, prematurely called
must drop out of school to perform household duties or informal, unskilled
                                                                                      to the duties of adulthood. Keeping girls in school – and reaching those who
jobs. Many get married and become mothers when they are still children
                                                                                      are out of school, overage or failing to learn – is vital to the realization of
themselves. Child marriage in India provides glaring evidence of widespread
                                                                                      their rights and in the fight against child marriage. But getting adolescent
gender inequality and discrimination in a young woman’s journey to adulthood.
                                                                                      girls to the classroom isn’t enough on its own. Schools must also provide
                                                                                      a safe, secure learning environment and the right skills to prepare for life
Enhancing the value of girls underpins the effective alleviation of social
                                                                                      in the ‘real world’, alongside the know-how to confront vulnerable and
injustice. Education and economic independence play a critical role in delaying       demanding situations. Teaching life skills, financial literacy and management
marriage and creating change in one generation.                                       of the school-to-work transition (including through vocational training and
                                                                                      career guidance) are focus areas. With the Ministry of Human Resource
UNICEF’s work to end child marriage and empower adolescent girls and boys             Development, UNICEF promotes girls’ education through targeted curricula
in India centres on five key interventions:                                           and teacher training programmes at schools across India, covering the
                                                                                      trajectory from preschool to secondary school.
•     Adolescents as agents of change
•     Social mobilization among parents and within communities                        Building competencies at schools forges a better entry to the workplace.
•     Investments in education for children both in and out of school                 UNICEF works with adolescents to provide information on career choices and
•     Access to social protection programmes                                          market opportunities. UNICEF is also identifying learning opportunities and
•     Linkages with skills and employment opportunities                               packages for girls and boys who have dropped out or never been to school,
                                                                                      including alternative and flexible education.
To realize these goals, UNICEF collaborates with the Government of India and
its relevant ministries at national, state and district level; with adolescents and   Recognizing that cash alone is not sufficient to reduce the interrelated
parents in communities; and with civil society organizations, United Nations          social and economic risks that girls face, UNICEF is strengthening existing
agencies and the private sector. The shared aim is to create a platform for           government cash transfer schemes for girls and developing new ones.

24 I Ending Child Marriage: A profile of progress in India
To achieve better outcomes, the concept of ‘plus or complementary services’       Right to protection and care
has been introduced, which entails options such as counselling for parents,
career counselling, access to information on choices and aspirations, and         UNICEF’s efforts have resulted in realizable, practical government-led action
linkages to skills training and market opportunities.                             plans and the leveraging of state- and national-level child protection
                                                                                  initiatives – such as Beti Bachao, Beti Padhao (‘Save the daughter, Educate
To date, UNICEF’s programme to end child marriage and promote adolescent          the Daughter’) and the Scheme for Adolescent Girls – that share the goal of
empowerment has reached 5 million girls and boys across 13 target states.         ending child marriage and promoting adolescent empowerment. Relevant
                                                                                  social and behavioural change communication has reached 1.9 million parents
                                                                                  and community members across 13 target states.

Adolescents as agents of change
                                                                                  Advocacy within UNICEF and with Government has led to enhanced
                                                                                  convergence across the education, health and nutrition, social policy and
Supporting adolescent girls and boys as agents of change is core to UNICEF’s
                                                                                  communication sectors and has increased accountability and visibility of
framework of action. UNICEF’s work enables young members of society to
                                                                                  adolescent and child marriage-related issues and initiatives. UNICEF’s current
identify the challenges affecting their lives, build and implement evidence-
                                                                                  larger-scale, district model has been developed in 13 states and relies on
based solutions, and evaluate their effectiveness. When adolescent voices
                                                                                  large government programmes, using non-governmental organizations as
are amplified in the public domain, they can influence policies and programmes
                                                                                  intermediaries and tapping on amplifiers such as the media, private sector,
concerning them.
                                                                                  and digital and technical communication tools.

UNICEF-facilitated adolescent groups at the community level and school-
based adolescent platforms provide an opportunity for individual and
community concerns to be voiced, offering a safe environment to find the          Strategic partnerships and constituency building
solutions. During intergenerational dialogues, girls and boys join community
leaders and parents to discuss topics like child marriage and related issues      UNICEF plays a crucial role in convening critical stakeholders around a
such as early pregnancy, health and nutrition, and the value of education.        platform that addresses multiple deprivations and supports adolescent girls and
They discuss making informed choices, realizing aspirations and creating          boys to build skills for life and livelihoods. Large-scale, multi-state technical
equal opportunities. They explore the ways in which community members             partnerships with state government and district administrations have been
can fulfil young people’s right to participation. These interactions are paving   established to work with adolescents, parents, community structures and
the way for long-term systemic change in the gender dynamic and the end of        front-line workers. To widen the discourse around child marriage, UNICEF
harmful social norms such as child marriage.                                      partners with civil society organizations, academic institutes, the private
                                                                                  sector, other United Nations agencies, volunteer groups, youth networks,
Adolescents are their own best advocates. UNICEF is supporting the                the media and the World Bank.
development of adolescent-friendly planning, governance and accountability
mechanisms, which are vital to a successful transition to adulthood.              UNICEF’s overall aim is to enable social policies that foster an environment
                                                                                  that protects children from child marriage, child labour, civil strife and other
Through multimedia platforms and key influencers, young voices and stories        harmful experiences that limit their ability to realize their full potential. To bring
of change have been amplified to give greater visibility to the adolescent        this change, UNICEF will focus on service and system improvements; advocacy,
agenda, reaching more than 25 million people.                                     constituency building and partnerships; and evidence generation.

                                                                                                                     Ending Child Marriage: A profile of progress in India I 25
Technical note                                                                                           Data sources
To assess the prevalence of child marriage, this analysis used SDG Indicator 5.3.1 – the proportion      India data are from the National Family Health Surveys 1992-1993, 1997-1998, 2005-2006 and
of women aged 20 to 24 who were married or in union before age 18. The proportion of women               2015-2016 (NFHS 1, 2, 3 and 4). Data for other countries are from UNICEF global databases,
aged 20 to 24 who married before age 15 is also presented to show how early child marriage               2018, based on Multiple Indicator Cluster Surveys, Demographic and Health Surveys and other
happens to girls. All reference to ‘marriage’ or ‘child brides’ includes formal marriages and informal   nationally representative surveys, 2004 to 2018. For detailed source information by country, see
unions in which women started living with a partner as if married, as well as all marriages that         . Demographic data are from Government of India, Ministry of Home Affairs,
occurred in childhood, regardless of whether or not the gauna ceremony (which is associated with         Office of the Registrar General & Census Commissioner, Census of India, 2011 and United Nations
the consummation of marriage) was performed.​                                                            Department of Economic and Social Affairs Population Division, ‘World Population Prospects: The
                                                                                                         2017 Revision’, DVD edition.
Key message titles were developed taking into account confidence intervals. Thus, in cases
where the title indicates that there is a difference among demographic groups or states and union
territories, it has been confirmed as statistically significant.​

Trends in the national prevalence of child marriage presented in figures 14, 16 and 19 were
calculated taking into account data from India’s National Family Health Survey (NFHS) 1992-1993,
1997-1998, 2005-2006 and 2015-2016, based on the prevalence of child marriage across age
cohorts. Trends prior to 2010 are based on the 1992-1993, 1997-1998 and 2005-2006 surveys,               How to read the projections
while trends in or after 2010 are based on the 2015-2016 survey. The most recent NFHS is
excluded in the trends prior to 2010 since the analysis raised questions about comparability across
                                                                                                         pages 20, 21 and 23
surveys for some cohorts of women. This is a deviation from the standard, as this adjustment is          Figures 16 and 19 show how the scale of the practice of child marriage has changed since 1970,
not necessary when results are consistent across sources over time. Calculations of the average          as well as various scenarios that could occur in the future. Figure 16 shows how the percentage
annual rate of reduction over the last 25 years in Table 1 and Figure 17 relied on this adjusted         of young women married in childhood has changed and could continue to change through 2050,
analysis across surveys.​                                                                                and Figure 19 shows the same for young men. Figure 17 shows progress in terms of the rate of
                                                                                                         reduction that has been observed and the rates that would be required to meet elimination targets.​
The burden of child marriage is defined as the number of girls under age 18 who have already
married plus the number of adult women who were married before age 18, calculated by applying            The projection scenarios build on existing trends. They show expected values if progress from
the prevalence of child marriage for each age cohort. At the national level, the adjusted prevalence     the past 25 years were to continue (in light blue), or if progress from the past 10 years were to
from the trend analysis is applied for each age cohort across surveys from 18 to 69 years to the         continue (in dark blue). Progress appears to have accelerated over the past 10 years, making this
respective female population; at the state level, the prevalence of child marriage based on the          the more ambitious of the two scenarios. A third scenario (in yellow) illustrates what could happen
NFHS 2015-2016 is applied for the age cohort 18 to 49 years to the respective female population.         if the rate observed over the past 10 years were to double.​
Outside this range, direct estimates of the prevalence were not available so the following
assumptions are made:                                                                                    The observed average annual rates of reduction (AARRs) quantify the rate of progress in the
                                                                                                         prevalence of child marriage over each period. A higher AARR indicates faster progress. Required
 • 0-9 years – all are assumed to be unmarried​                                                          AARRs are calculated to illustrate the rate necessary to eliminate child marriage by 2030 and
 •  10-17 years – indirect estimates are produced using related indicators, including the              achieve target 5.3 of the Sustainable Development Goals.
      percentage of girls married before age 15 and the percentage of adolescents aged 15 to 17
      currently married​
 • 70+ years at the national level – prevalence of women aged 65 to 69 is used​
 • 5 0+ years at the state and union territory level – prevalence of women aged 45 to 49 in each
      state and union territory is used​

Projected values based on a continuation of observed progress apply the average annual rate of
reduction in the prevalence of child marriage, or the percentage of women aged 20 to 24 first
married or in union before 18, over the past 25 years and over the past 10 years. The acceleration
scenario assumes a doubling of the observed annual rate of reduction over the past 10 years. For
statistical purposes, ‘elimination’ is defined here as a child marriage prevalence of less than 1 per
cent. ‘Childhood’ refers to the period from birth until the 18th birthday. ‘Adolescence’ refers to
ages 10 to 19.​

Data at the state and union territory level represent geographical boundaries as of NFHS 2015-
2016. In the case of Jharkhand, formed in 2000, the estimates represent the risk over time of
women who currently live in the geographical area which is now Jharkhand. The trend analysis for
states and union territories, as presented in Figures 15 and 17, are based on an age cohort analysis
from the NFHS 2015-2016. The value for ‘25 years ago’ was adjusted using a factor consistent
with the adjustment for the underestimation of child marriage prevalence among the oldest cohort
of women at the national level, as described in the third paragraph of this note.

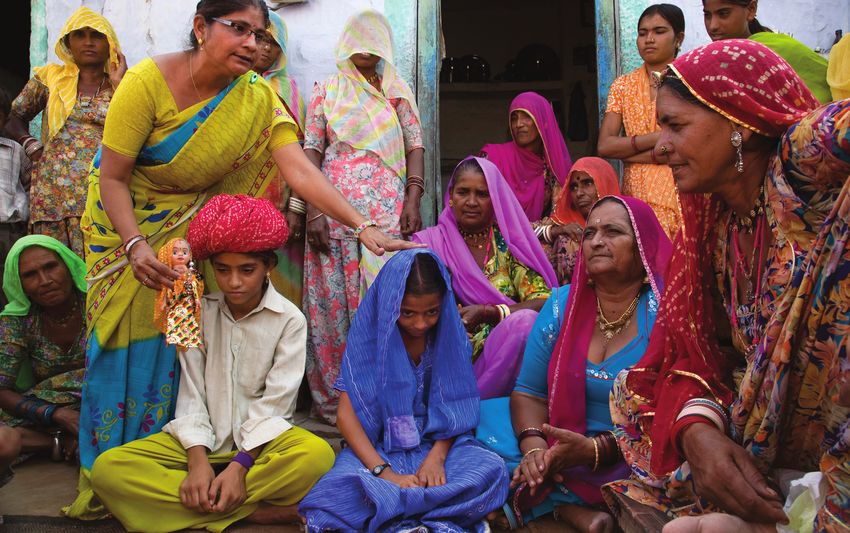
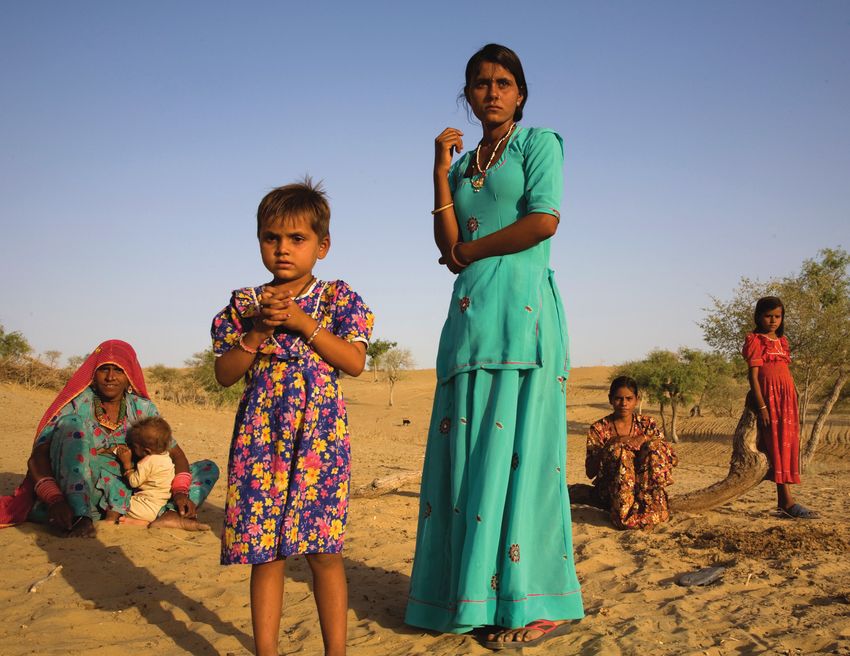
26 I Ending Child Marriage: A profile of progress in India
ACKNOWLEDGEMENTS:
This data brief was prepared by UNICEF’s
Data and Analytics Section with inputs from
the India Country Office.​

SUGGESTED CITATION: United Nations
Children’s Fund, ‘Ending Child Marriage: A
profile of child marriage in India’, UNICEF,
New York, 2019.

PHOTO CREDITS:
Cover: © UNICEF/UNI77781/Khemka
Snehlata (in glasses) explains the harmful
effects of child marriage to women in Agolai
Village, Jodhpur District, Rajasthan State.
Two girls (seated in foreground) are dressed
as a groom and bride to help illustrate a
point. Snehlata is a precheta, a community
educator and women’s advocate. Prechetas
work with sathins (grassroots-level women’s
advocates), anganwadis (village-level
health centres), auxiliary nurse midwives,
health activists and teachers to promote
awareness of domestic violence, child
marriage, physical and sexual exploitation,
and other issues affecting women. Goga
Devi (sitting, in blue) is a sathin. Sathins and
prechetas are part of the local government’s
development programme for women.

Page 2: © UNICEF/UNI77745/Khemka
Page 17: © UNICEF/UNI77758/Khemka
Page 27: © UNICEF/UNI144957/Singh
For information on the data in this brochure:   For information on child marriage in India:

UNICEF                                          UNICEF India
Data and Analytics Section                      73 Lodi Estate
Division of Data, Research and Policy           New Delhi 110 003, India
3 United Nations Plaza                          Telephone: +91 11 2469 0401
New York, NY 10017, USA                         Email: newdelhi@unicef.org
Telephone: +1 212 326 7000                      Website: unicef.in
Email: data@unicef.org
Website: data.unicef.org
You can also read