Investor Presentation February 2021 - Mapletree ...
←
→
Page content transcription
If your browser does not render page correctly, please read the page content below
Investor Presentation February 2021
Important Notice
This presentation shall be read in conjunction with Mapletree Industrial Trust’s (“MIT”) financial results for Third Quarter
Financial Year 2020/2021 in the SGXNET announcement dated 29 January 2021.

This presentation is for information only and does not constitute an offer or solicitation of an offer to sell or invitation to
subscribe for or acquire any units in Mapletree Industrial Trust (“Units”).

The past performance of the Units and MIT is not indicative of the future performance of MIT or Mapletree Industrial Trust
Management Ltd. (the “Manager”).

The value of Units and the income from them may rise or fall. Units are not obligations of, deposits in or guaranteed by the
Manager or any of its affiliates. An investment in Units is subject to investment risks, including the possible loss of the
principal amount invested. Investors have no right to request the Manager to redeem their Units while the Units are listed. It is
intended that unitholders may only deal in their Units through trading on the Singapore Exchange Securities Trading Limited
(“SGX-ST”). Listing of the Units on the SGX-ST does not guarantee a liquid market for the Units.

This presentation may also contain forward-looking statements that involve risks and uncertainties. Actual future
performance, outcomes and results may differ materially from those expressed in forward-looking statements as a result of
risks, uncertainties and assumptions. Representative examples of these factors include general industry and economic
conditions, interest rate trends, cost of capital, occupancy rate, construction and development risks, changes in operating
expenses (including employees wages, benefits and training costs), governmental and public policy changes and the
continued availability of financing. You are cautioned not to place undue reliance on these forward-looking statements, which
are based on current view of management on future events.

Nothing in this presentation should be construed as financial, investment, business, legal or tax advice and you should
consult your own independent professional advisors.

2
Contents

    01   Key Highlights
    02   Overview of Mapletree Industrial Trust
    03   Portfolio Update
    04   3Q & YTD FY20/21 Financial Highlights
    05   Outlook and Strategy

3
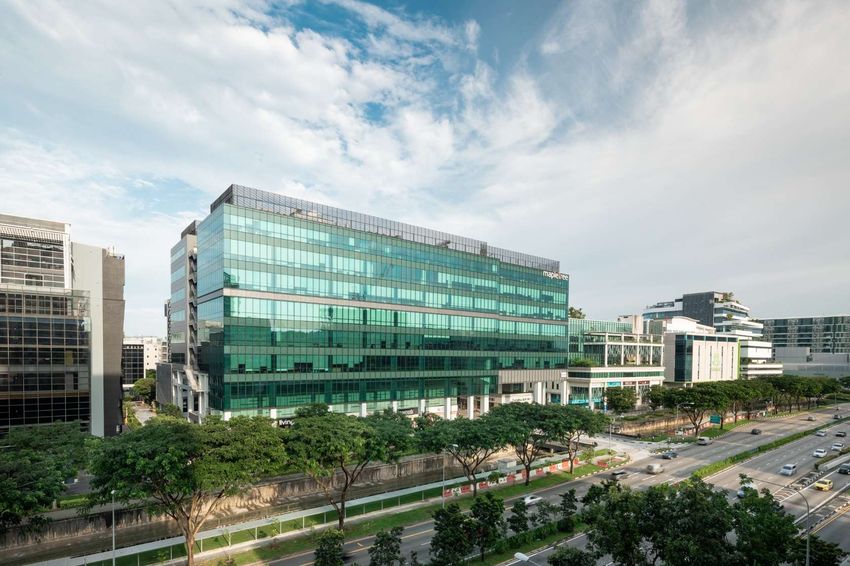
KEY HIGHLIGHTS

Data Centres, 44490 Chilum Place (ACC2), Northern Virginia
Sustainable and Growing Returns
Distributable Income DPU
(S$ million) (cents)
100 3.28
3.50
3.13 3.16
3.073.083.10 3.10
90 3.00
2.95
3.003.01
2.92 2.85
2.852.832.832.88 2.88 2.87 3.00
2.792.822.81 81.1
2.73
80 2.672.65
2.60
2.472.512.512.51 72.9
2.43 70.6
2.37 69.4 69.2 2.50
70 2.292.32
2.222.26
2.16 63.263.5
2.05 59.9
1.98 58.3
60 1.93 55.5
56.956.7
54.053.5 2.00
51.852.9
50.350.451.550.651.1
48.248.9
50 45.446.046.7
1.52
42.242.642.8
41.1
38.940.2 1.50
40 36.937.537.7
35.235.8
31.6
28.329.0
30 1.00
22.3
20
0.50
10
0 0.00
3Q¹ 4Q 1Q 2Q 3Q 4Q 1Q 2Q 3Q 4Q 1Q 2Q 3Q 4Q 1Q 2Q 3Q 4Q 1Q 2Q 3Q 4Q 1Q 2Q 3Q 4Q 1Q 2Q 3Q 4Q 1Q 2Q 3Q 4Q 1Q 2Q 3Q 4Q 1Q 2Q 3Q
FY10/11 FY11/12 FY12/13 FY13/14 FY14/15 FY15/16 FY16/17 FY17/18 FY18/19 FY19/20 FY20/21
DPU
3.45 8.41 9.24 9.92Distributable
10.43 Income
11.15 11.39
(S$ million) 11.75
DPU (cents) 12.16 12.24
(cents)
1 MIT was listed on 21 Oct 2010.
5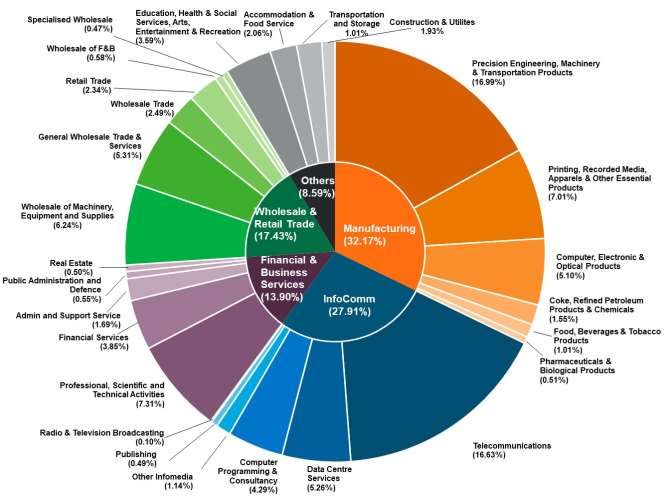
Portfolio Growth since IPO
                                                                                                                                                    FY19/20        FY20/21
    3 Asset Enhancement                                                                                                                              S$5.9b

      Initiatives (“AEI”)
    5 Build-to-Suit (“BTS”)                                                                                                           FY18/19
      Projects                                                                                                                        S$4.8b

    7 Acquisitions                                                                                                     FY17/18
                                                                                                                       S$4.3b

                                                                                                       FY16/17
                                                                                             FY15/16   S$3.7b
                                                                         FY14/15
                                                                                             S$3.6b
                                                       FY13/14           S$3.4b
                                                       S$3.2b                                                                                                    Acquisition
                                  FY12/13                                                                                                                          Remaining
                FY11/12           S$2.9b                                                                                                                          60% interest
                S$2.7b                                                                                                                                           in 14 US DCs
 FY10/11                                                                                                                                                          US$494m
 S$2.2b1                                                                     Acquisition                                          Acquisition                   BTS
                                                 AEI                                                      BTS
                                             Woodlands                        2A Changi                                             Upgraded                    Kolam
                                                                                                         1 & 1A
                                              Central                        North Street 2                                      7 Tai Seng Drive               Ayer 2
                                                                                                       Depot Close
                                                                                                                                     to a DC
                                              S$30m                              S$12m                  S$226m                                                 S$300m
                                                                                                                                     S$95m

                                                  BTS                              BTS                 Acquisition                    BTS                     Acquisition
              Acquisition                                                       26A Ayer
               11 Flatted                   K&S Corporate                                               40% interest               Mapletree                13 North
                                            Headquarters                         Rajah                 in14 US DCs²              Sunview Drive 1          American DCs3
               Factories
                                                S$50m                           Crescent                                             S$76m                    US$684m
               S$400m                                                                                   US$300m
                                                                                S$101m

                                              AEI                                                          AEI                    Acquisition
FY10/11         FY11/12            FY12/13 Toa Payoh
                                                 FY13/14                 FY14/15             FY15/16    FY16/17
                                                                                                        30A Kallang    FY17/18        FY18/19
                                                                                                                                  18 Tai Seng       FY19/20         FY20/21
                                               North 1                                                     Place                    S$268m
                                               S$40m                                                      S$77m

          1    Valuation of investment properties on 31 Mar at end of each financial year.
          2    Acquired through a 40:60 joint venture with MIPL.
     6    3    Acquired through a 50:50 joint venture with MIPL.
3QFY20/21 Results Highlights
Growth underpinned by new income streams from North American data centres
but partly offset by rental reliefs extended to tenants and loss of revenue from
redevelopment of Kolam Ayer 2 Cluster
• 3QFY20/21 Distributable Income: S$81.1 million ( 16.8% y-o-y)
• 3QFY20/21 DPU: 3.28 cents ( 3.8% y-o-y)
• YTD FY20/21 Distributable Income and DPU were S$224.5 million ( 14.4% y-o-y)
and 9.25 cents ( 1.5% y-o-y)
Portfolio update
• Average Overall Portfolio occupancy increased q-o-q from 92.3% to 93.1% in
3QFY20/21
• Average rental rate of Singapore Portfolio increased q-o-q from S$2.03 psf/mth to
S$2.11 psf/mth
Capital management update
• Secured inaugural S$300 million sustainability-linked facility
• Healthy aggregate leverage ratio of 37.3%
• Strong balance sheet with more than S$600 million of committed facilities available
7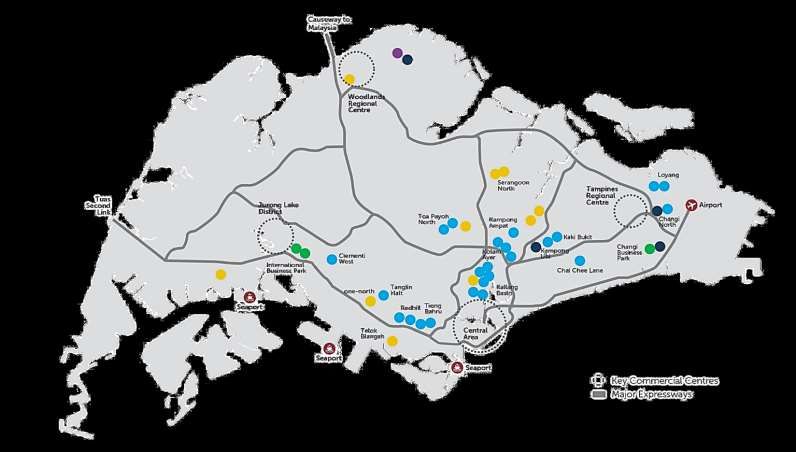
OVERVIEW OF
MAPLETREE INDUSTRIAL TRUST
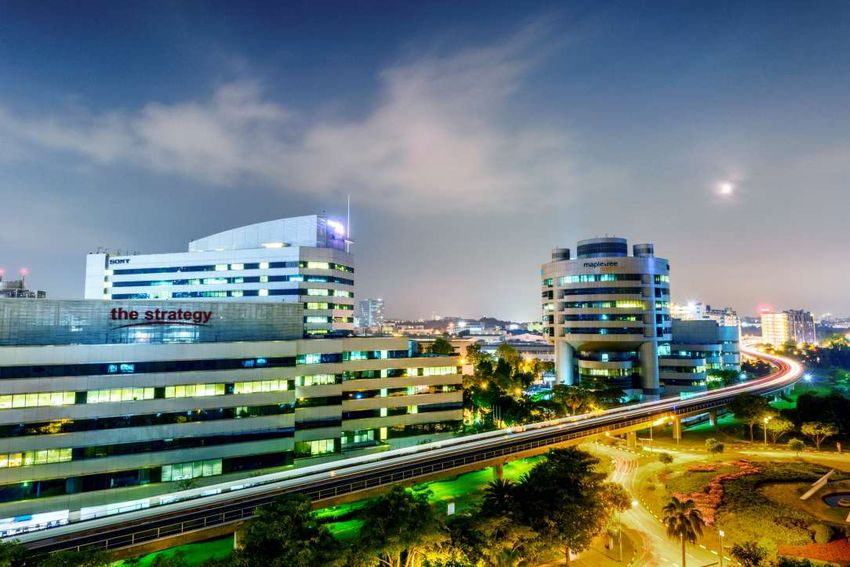
Hi-Tech Building, 18 Tai Seng
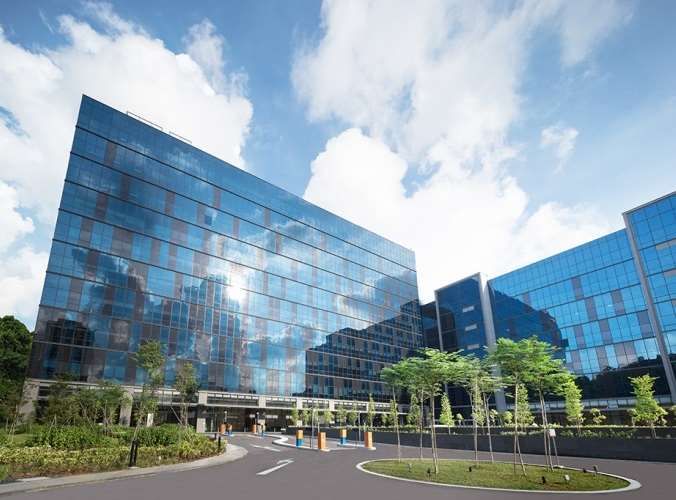
Overview of Mapletree Industrial Trust
                          Mapletree Investments Pte Ltd                                          Public & Inst
                                                                                                                                 MIPL
Sponsor                   (“MIPL”)                                                               Unitholders

                                                                                               72.7%                                27.3%
                          Owns 27.3% of MIT                                                                                                 Trustee

                          Focused on (i) industrial real estate
                          assets in Singapore, excluding                                                                                    Manager
Investment
                          properties primarily used for logistics
mandate
                          purposes and (ii) data centres
                                                                                                                 MIT Portfolio              Property
                          worldwide beyond Singapore                                                                                        Manager

                          111 properties valued at S$6.6 billion1
Portfolio
                          20.6 million2 sq ft NLA

                          Mapletree Industrial Trust
Manager                   Management Ltd.
                          100% owned by the Sponsor
                          Mapletree Facilities Services
Property                  Pte. Ltd. and Mapletree US
Manager                   Management LLC
                          100% owned by the Sponsor

Trustee                   DBS Trustee Limited
    1   Based on MIT’s book value of investment properties as well as MIT’s interest of the
                                                                                               AUM by geography
        joint venture with MIPL in three fully fitted hyperscale data centres and 10 powered
        shell data centres in North America and included MIT’s right of use assets of S$27.4
                                                                                               Singapore                                        68.3%
        million as at 31 Dec 2020.
    2   Excludes the parking decks (150 Carnegie Way and 171 Carnegie Way) at 180
                                                                                               North America                                    31.7%
9       Peachtree.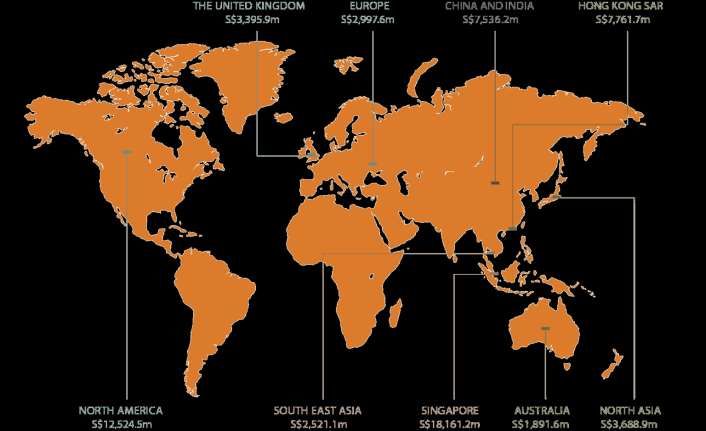
Diverse Portfolio of 111 Properties

       DATA CENTRES                                         FLATTED FACTORIES
       Facilities used primarily for the storage and        High-rise multi-tenanted industrial buildings
       processing of data. These include core-and-shell     with basic common facilities used for light
       to fully-fitted facilities, which include building   manufacturing activities.
       fit-outs as well as mechanical and electrical
       systems.

       HI-TECH BUILDINGS                                    STACK-UP/RAMP-UP
                                                            BUILDINGS
       High specification industrial buildings with
       higher office content for tenants in technology      Stacked-up factory space with vehicular
       and knowledge-intensive sectors. Usually             access to upper floors. Multi-tenanted space
       fitted with air-conditioned lift lobbies and         suitable for manufacturing and assembly
       common areas.                                        activities.

       BUSINESS PARK BUILDINGS                              LIGHT INDUSTRIAL
                                                            BUILDINGS
       High-rise multi-tenanted buildings in specially
       designated “Business Park zones”. Serve as           Multi-storey developments usually
       regional headquarters for MNCs as well as            occupied by an anchor tenant for light
       spaces for R&D and knowledge-intensive               manufacturing activities.
       enterprises.

10
Healthy Returns since IPO
COMPARATIVE TRADING PERFORMANCE SINCE IPO¹
MIT’s Return on Capital Distribution Total
Investment Appreciation Yield Return
Listing on 21 Oct 2010 to 29 Jan 2021 208.6%² 117.6%³ 326.2%4
¹ Rebased MIT’s issue price of S$0.930 and opening unit prices of FTSE ST REITs Index and FTSE Straits Times Index on
21 Oct 2010 to 100. Source: Bloomberg.
² Based on MIT’s closing unit price of S$2.870 on 29 Jan 2021.
³ MIT’s distribution yield is based on DPU of S$1.094 over the issue price of S$0.930.
11 ⁴ Sum of distributions and capital appreciation for the period over the issue price of S$0.930.84 Properties in Singapore
Total WALE Weighted Average Unexpired Occupancy
NLA (By GRI)1 Lease Term of Underlying Land1 Rate2
16.3m sq ft 3.3 years 35.5 years 92.2%
Data Centres
Hi-Tech Buildings
Flatted Factories
Business Park Buildings
Stack-up/Ramp-up Buildings
Light Industrial Buildings
1 As at 31 Dec 2020.
2 For 3QFY20/21.
1227 Data Centres Across North America
Total WALE Weighted Average Unexpired Occupancy
NLA1 (By GRI)2 Lease Term of Underlying Land3 Rate4
4.3m sq ft 6.3 years Freehold 97.6%
Ontario
1
Wisconsin
1
1
Michigan 1 Massachusetts
Pennsylvania
1
1
New Jersey
2
Denver 6 Virginia
1
California 1 2 North Carolina
Tennessee
1
Arizona 1 3
1 3
MRODCT Portfolio (13 data centres) Georgia
Texas
Mapletree Redwood Data Centre Trust
(“MRDCT”) Portfolio (14 data centres)
*Number of data centres indicated in the circles
1 Excluded the parking decks (150 Carnegie Way and 171 Carnegie Way) at 180 Peachtree, Atlanta.
2 As at 31 Dec 2020.
3 All properties are sited on freehold land, except for the parking deck (150 Carnegie Way) at 180 Peachtree, Atlanta and 2055 East Technology Circle, Phoenix.
13 4 For 3QFY20/21.Reputable Sponsor with Aligned Interest
About the Sponsor, Mapletree Investments
Leading real estate development, investment, capital and property management company
As at 31 Mar 2020, the Sponsor owns and manages S$60.5 billion of assets across Asia Pacific,
Europe, the United Kingdom and North America, of which S$12.5 billion is located in North America
Right of first refusal to MIT over future sale of 50% interest in Mapletree Rosewood Data Centre Trust
(“MRODCT”)
14PORTFOLIO
UPDATE
Hi-Tech Buildings, build-to-suit project for HPPortfolio Overview
Singapore North American Overall
Portfolio Portfolio Portfolio
Number of properties 84 27 111
NLA (million sq ft) 16.3 4.31 20.61
Occupancy (%) 1
3QFY20/21 92.2 97.6 93.12
2QFY20/21 91.5 98.0 92.32
SEGMENTAL OCCUPANCY RATES2
2 2
98.7% 98.2% 98.2% 98.3%
88.1% 89.7% 93.5% 92.9% 92.3%2 93.1%2
85.9% 85.9%
80.0% 80.4%
Data Centres Hi-Tech Buildings Business Park Flatted Factories Stack-up/Ramp-up Light Industrial Overall
Buildings Buildings Buildings Portfolio
Left Bar (2QFY20/21)² Right Bar (3QFY20/21)²
1 Excludes the parking decks (150 Carnegie Way and 171 Carnegie Way) at 180 Peachtree.
2 Based on MIT’s 50% interest of the joint venture with MIPL in three fully fitted hyperscale data centres and 10 powered shell data centres in North America
through MRODCT.
16Lease Expiry Profile
EXPIRING LEASES BY GROSS RENTAL INCOME1
As at 31 December 2020
WALE based on date of commencement of leases (years)2
Singapore Portfolio 3.3
North American Portfolio 6.3
Overall Portfolio1 4.1
34.0%
24.4%
18.5%
16.1%
2.6% 4.4%
FY20/21 FY21/22 FY22/23 FY23/24 FY24/25 FY25/26 &
Beyond
Data Centres (Singapore) Data Centres (North America) Hi-Tech Buildings Business Park Buildings
Flatted Factories Stack-up / Ramp-up Buildings Light Industrial Buildings
1 Based on MIT’s 50% interest of the joint venture with MIPL in three fully fitted hyperscale data centres and 10 powered shell data centres in
North America through MRODCT.
2 Refers to leases which commenced prior to and on 31 Dec 2020.
17Large and Diversified Tenant Base
TOP 10 TENANTS BY GROSS RENTAL INCOME1
As at 31 December 2020
7.5%
Over 2,000 tenants
6.6% Largest tenant contributes 7.5% of Portfolio’s Gross Rental Income
Top 10 tenants forms about 32.7% of Portfolio’s Gross Rental Income
Hi-Tech Buildings Data Centres
3.9% 3.8%
2.7%
2.3%
1.6% 1.5% 1.5% 1.3%
Global Social Global Fortune 25
IT Solutions
Media Colocation Investment
Provider2
Company2 Provider2 Grade-Rated
Company2
1 Based on MIT’s 50% interest of the joint venture with MIPL in three fully fitted hyperscale data centres and 10 powered shell data centres in
North America through MRODCT.
2 The identities of the tenants cannot be disclosed due to the strict confidentiality obligations under the lease agreements.
18Tenant Diversification Across Trade Sectors1
No single trade sector accounted >17% of Portfolio’s Gross Rental Income
By Gross Rental Income
As at 31 Dec 2020
1 Based on MIT’s 50% interest of the joint venture with MIPL in three fully fitted hyperscale data centres and 10 powered shell data centres in
19 North America through MRODCT.Singapore Portfolio Performance
Occupancy Gross Rental Rate
S$ psf/mth
100% $2.50
95.1%95.0%94.9%95.0%95.2%95.4%95.5% 94.7%94.6%
94.3%94.5% 93.9% 93.5%93.8%
93.2% 92.5% 93.0%92.5% 93.1%92.6%
92.3% 92.1% 92.2%
91.3%90.7%91.5%90.8% 90.7%90.2%91.5%
90.2% 90.4%90.1%
89.6% 89.8%90.5%90.2%90.5%
90% 87.8% 87.7%
86.2%
$2.12 $2.11
$2.10 $2.10
80% $2.01
$1.97 $2.11
$1.95 $1.94 $2.07 $2.08
$2.05 $2.04 $2.00
$1.90 $2.02 $2.03
$1.88 $1.89
$1.86
70% $1.94
$1.92 $1.92 $1.93
$1.75
$1.73
$1.71 $1.70 $1.84
$1.82 $1.83
60% $1.77
$1.54 $1.53 $1.55 $1.68
$1.52
$1.61
$1.59
50% $1.56 $1.50
$1.49
$1.45
40%
30%
$1.00
20%
10%
0% $0.50
3Q 4Q 1Q 2Q 3Q 4Q 1Q 2Q 3Q 4Q 1Q 2Q 3Q 4Q 1Q 2Q 3Q 4Q 1Q 2Q 3Q 4Q 1Q 2Q 3Q 4Q 1Q 2Q 3Q 4Q 1Q 2Q 3Q 4Q 1Q 2Q 3Q 4Q 1Q 2Q 3Q
FY10/11 FY11/12 FY12/13 FY13/14 FY14/15 FY15/16 FY16/17 FY17/18 FY18/19 FY19/20 FY20/21
20 Occupancy (LHS) Rental Rate (RHS)Rental Revisions (Singapore)
GROSS RENTAL RATE (S$ PSF/MTH)1
For Period 3QFY20/21
$4.40 Before Renewal
$3.96
$3.81 After Renewal
$3.67
New Leases
$3.20
$3.60 Passing Rent
$2.33 $2.29
$1.72 $1.67 $1.64
$1.32 $1.26 $1.29
$1.70
$1.24
Hi-Tech Buildings Business Park Buildings Flatted Factories Stack-Up/Ramp-Up Buildings
Renewal 10 Leases 4 Leases 75 Leases 7 Leases
Leases (31,198 sq ft) (19,806 sq ft) (192,243 sq ft) (88,028 sq ft)
7 Leases 4 Leases 62 Leases 6 Leases
New Leases
(49,576 sq ft) (23,519 sq ft) (143,976 sq ft) (65,930 sq ft)
1 Gross Rental Rate figures exclude short term leases; except Passing Rent figures which include all leases.
21Healthy Tenant Retention (Singapore)
LONG STAYING TENANTS RETENTION RATE FOR 3QFY20/21
Up to 1 yr
8.8%
>10 yrs
92.1%
30.8% >1 to 2 yrs
10.4%
73.4%
69.4%
66.0%
4 yrs or
less 51.7%
More than 35.9% > 2 to 3 yrs
4 yrs 10.1%
64.1%
>3 to 4 yrs
6.6% N.A. N.A.
Data Hi-Tech Business Flatted Stack-up / Light Singapore
>5 to 10 yrs >4 to 5 yrs Centres Buildings Park Factories Ramp-up Industrial Portfolio
27.5% 5.8% (Singapore) Buildings Buildings Buildings
As at 31 Dec 2020 Based on NLA.
By number of tenants. Not applicable as there were no leases due for renewal.
64.1% of the tenants have leased the properties for more than 4 years
Tenant retention rate of 69.4% in 3QFY20/21
22Proposed Acquisition – Data Centre in Virginia
Proposed acquisition of a data centre and office in Virginia, United States as
part of strategic expansion in the resilient data centre sector
Leased to a high-quality tenant on a triple net lease structure and minimal
capital expenditure commitments
Provides income stability with its long WALE and freehold land component
Data Centre in Virginia, United States1
Proposed acquisition of a data centre and office in Virginia,
Description
United States
Fully leased on a triple net basis with a balance lease term
Lease Term of more than five years to a multinational company with
strong credit standing
Purchase Consideration Between US$200.6 million and US$262.1 million2
Valuation Between US$205.0 million and US$266.0 million3
Completion 1Q2021
1 Due to confidentiality reasons, additional details relating to the proposed acquisition will be released in due course upon finalisation of the purchase
consideration of the proposed acquisition.
2 Subject to calibration of terms.
3 Independent valuations by Cushman & Wakefield of North Carolina, Inc. (“C&W”) conducted as at 31 Aug 2020. C&W’s valuations are respectively 2.2%
and 1.5% higher than the purchase considerations.
23Proposed Divestment – 26A Ayer Rajah Crescent1
Sale Price GFA Completion
S$125.0 million 384,802 sq ft 2Q2021
Exercise of option to purchase 26A Ayer Rajah
Crescent by Equinix Singapore2
Seven-storey data centre developed by MIT for
Equinix in Jan 2015
30-year land lease commenced on 22 May 2013
Sale Price is 23.3% above development cost of
S$101.4 million and in line with valuation of
S$125.0 million3
Contributed about 2.2% to MIT’s portfolio gross
revenue in FY19/20
Use of sale proceeds to fund committed investments,
reduce existing debt and/or make distributions to
26A Ayer Rajah Crescent unitholders
1 Subject to approval by JTC Corporation.
2 Refers to the exercise of option to purchase 26A Ayer Rajah Crescent within the Lease Agreement between MIT and Equinix dated 1 Mar 2015. 26A Ayer Rajah
Crescent is the only property in MIT’s portfolio with such option to purchase being granted to the tenant.
3 Based on latest annual valuation as at 31 Mar 2020.
24Redevelopment – Kolam Ayer 2
Property GFA Plot Ratio
Kolam Ayer 2 Cluster Two Flatted Factories and an amenity centre 506,720 sq ft 1.5
New Hi-Tech Buildings, including a
After Redevelopment 865,600 sq ft 2.5
seven-storey BTS Facility for Anchor Tenant
Redevelopment of Kolam Ayer 2 Flatted Factory Cluster
into a new high-tech industrial precinct at total project cost
of S$300 million1
Secured pre-commitment from a global medical device
company headquartered in Germany (the “Anchor
Tenant”) for about 24.4% of enlarged GFA (~211,000 sq ft)
BTS Facility is 100% committed by Anchor Tenant for
lease term of 15 + 5 + 5 years2 with annual rental
escalations
74 out of 108 existing tenants committed to new leases at
Artist’s impression of MIT’s new high-tech industrial alternative MIT clusters
precinct with BTS Facility on the left
Commenced construction for two industrial buildings in
late Nov 2020; Construction contract of third industrial
building to be awarded at a later date
Completion in 2H2022
1 Includes the book value of the Kolam Ayer 2 Cluster at S$70.2 million as at 31 Mar 2019 prior to the commencement of the redevelopment.
2 Includes a rent-free period of 6 months distributed over the first six years. Anchor Tenant is responsible for all operating expense and property tax of the BTS Facility.
253Q & YTD FY20/21
FINANCIAL HIGHLIGHTS
Business Park Buildings, The Strategy and The SynergyStatement of Profit or Loss (Year-on-Year)
3QFY20/21 3QFY19/20
/ ()
(S$’000) (S$’000)
Gross revenue 123,685 102,610 20.5%
Property operating expenses (24,756) (20,705) 19.6%
Net property income 98,929 81,905 20.8%
Borrowing costs (15,508) (12,072) 28.5%
Trust expenses (10,987) (7,082) 55.1%
Share of joint ventures’ results1 9,571 6,848 39.8%
Effects from deemed disposal of investments in
(15,662) - *
joint venture2
Profit before income tax 66,343 69,599 (4.7%)
Income tax expense (475) (49) >100.0%
Profit for the period 65,868 69,550 (5.3%)
Net non-tax deductible items 6,545 (6,812) *
Distributions declared by joint ventures 8,661 6,698 29.3%
Amount available for distribution 81,074 69,436 16.8%
Distribution per Unit (cents) 3.28 3.16 3.8%
* Not meaningful
1 Share of joint ventures’ results relates to MIT’s equity interest in the joint ventures with Mapletree Investments Pte Ltd (“MIPL”). The results of
the joint ventures were equity accounted at the Group level. With effect from 1 Sep 2020, upon completion of the acquisition of the remaining
60% interest, financial results of the 14 data centres in the United States previously held under Mapletree Redwood Data Centre Trust
(“MRDCT”) had been consolidated.
2 Effects from deemed disposal of investments in joint venture refer to remeasurement of the Group’s 40% equity interest in MRDCT to its fair
value at acquisition date. This is in accordance with the accounting standards where carrying amount of investment is remeasured to its fair
value and amounts previously recognised in other comprehensive income are reclassified to the Consolidated Statement of Profit or Loss.
27Statement of Profit or Loss (Year-on-Year)
YTD FY20/21 YTD FY19/20
/ ()
(S$’000) (S$’000)
Gross revenue 326,141 304,057 7.3%
Property operating expenses (66,958) (64,244) 4.2%
Net property income 259,183 239,813 8.1%
Borrowing costs (38,091) (33,990) 12.1%
Trust expenses (30,048) (24,970) 20.3%
Share of joint ventures’ results1 35,593 15,609 >100.0%
Effects from deemed disposal of investments in
(15,662) - *
joint venture2
Profit before income tax 210,975 196,462 7.4%
Income tax expense (676) (49) >100.0%
Profit for the period 210,299 196,413 7.1%
Net non-tax deductible items (15,831) (14,531) 8.9%
Distributions declared by joint ventures 30,048 14,302 >100.0%
Amount available for distribution 224,5163 196,184 14.4%
Distribution per Unit (cents) 9.253 9.39 (1.5%)
* Not meaningful
1 Share of joint ventures’ results relates to MIT’s equity interest in the joint ventures with MIPL. The results of the joint ventures were equity accounted at the
Group level. With effect from 1 Sep 2020, upon completion of the acquisition of the remaining 60% interest, financial results of the 14 data centres in the
United States previously held under MRDCT had been consolidated.
2 Effects from deemed disposal of investments in joint venture refer to remeasurement of the Group’s 40% equity interest in MRDCT to its fair value at
acquisition date. This is in accordance with the accounting standards where carrying amount of investment is remeasured to its fair value and amounts
previously recognised in other comprehensive income are reclassified to the Consolidated Statement of Profit or Loss.
3 Amount available for distribution includes tax-exempt income amounting to S$7.1 million withheld and not included in the 40th distribution (equivalent to
distribution per unit of 0.32 cent). Had the tax-exempt income distribution been included, DPU for YTD FY20/21 would be 9.57 cents.
28Statement of Profit or Loss (Qtr-on-Qtr)
3QFY20/21 2QFY20/21
/ ()
(S$’000) (S$’000)
Gross revenue 123,685 103,350 19.7%
Property operating expenses (24,756) (21,748) 13.8%
Net property income 98,929 81,602 21.2%
Borrowing costs (15,508) (12,015) 29.1%
Trust expenses (10,987) (9,724) 13.0%
Share of joint ventures’ results1 9,571 12,274 (22.0%)
Effects from deemed disposal of investments in
(15,662) - *
joint venture2
Profit before income tax 66,343 72,137 (8.0%)
Income tax expense (475) (201) >100.0%
Profit for the period 65,868 71,936 (8.4%)
Net non-tax deductible items 6,545 (10,992) *
Distributions declared by joint ventures 8,661 11,940 (27.5%)
Amount available for distribution 81,074 72,884 11.2%
Distribution per Unit (cents) 3.28 3.10 5.8%
* Not meaningful
1 Share of joint ventures’ results relates to MIT’s equity interest in the joint ventures with MIPL. The results of the joint ventures were equity
accounted at the Group level. With effect from 1 September 2020, upon completion of the acquisition of the remaining 60.0%, financial
results of the 14 data centres in the United States previously held under MRDCT had been consolidated.
2 Effects from deemed disposal of investments in joint venture refer to remeasurement of the Group’s 40% equity interest in MRDCT to its fair
value at acquisition date. This is in accordance with the accounting standards where carrying amount of investment is remeasured to its fair
value and amounts previously recognised in other comprehensive income are reclassified to the Consolidated Statement of Profit or Loss.
29Statement of Financial Position
31 Dec 2020 30 Sep 2020 / ()
Total assets (S$’000) 6,167,895 6,255,220 (1.4%)
Total liabilities (S$’000) 2,181,378 2,272,950 (4.0%)
Net assets attributable to Unitholders
3,986,517 3,982,270 0.1%
(S$’000)
Net asset value per Unit (S$)1 1.70 1.69 0.6%
1 Net tangible asset per Unit was the same as net asset value per Unit as there were no intangible assets as at reporting dates.
30Strong Balance Sheet
31 Dec 2020 30 Sep 2020
Total debt (MIT Group) S$1,949.3 million S$2,026.3 million
Weighted average tenor of debt 3.2 years 3.2 years
Aggregate leverage ratio1 37.3% 38.1%
Strong balance sheet to pursue growth opportunities
‘BBB+’ rating with Stable Outlook by Fitch Ratings
100% of loans unsecured with minimal covenants
1 In accordance with Property Funds Guidelines, the aggregate leverage ratio includes proportionate share of aggregate leverage as well as
deposited property values of joint venture. As at 31 Dec 2020, aggregate leverage including MIT’s proportionate share of joint venture is
S$2,500.4 million.
31Well Diversified Debt Maturity Profile
DEBT MATURITY PROFILE
As at 31 December 2020
No debt maturing in FY20/21
More than S$600 million of committed facilities available
(including inaugural S$300 million sustainability-linked facility)
28.4%
22.2%
18.8%
15.2%
509.1
373.1
9.0%
367.1
295.0 6.4%
175.0
125.0
45.0 60.0
FY20/21 FY21/22FY22/23 FY23/24 FY24/25 FY25/26 FY26/27 FY27/28 FY28/29
MTN Bank Loans
Amounts in S$ million
Weighted Average Tenor of Debt = 3.2 years
32Risk Management
31 Dec 2020 30 Sep 2020
Fixed as a % of total debt 96.2% 93.8%
Weighted average hedge tenor 3.0 years 3.2 years
Weighted average all-in funding
2.9% 2.7%
cost for the quarter
Interest coverage ratio for the
6.4 times 7.0 times
quarter
Interest coverage ratio for the
7.2 times 7.3 times
trailing 12 months1
~73% of 4QFY20/21 net US$ income streams have been hedged into S$
1 Calculated in accordance with Property Funds Guidelines dated 16 Apr 2020
33OUTLOOK AND
Data Centres, 7337 Trade Street,
San Diego
STRATEGYSingapore Industrial Property Market
DEMAND AND SUPPLY FOR MULTI-USER FACTORIES DEMAND AND SUPPLY FOR BUSINESS PARKS
Total stock for factory and business park space: 38.9 million sq m
Potential net new supply of 2.2 million sq m in 20211, of which
• Multi-user factory space accounts for 0.9 million sq m
• Business park space accounts for 0.2 million sq m
• Moderation in quantum of industrial land released through Industrial Government Land Sales
Programme since 2013
Median rents for industrial real estate for 4Q20201
• Multi-user Factory Space: S$1.72 psf/mth (1.8% q-o-q)
• Business Park Space: S$4.00 psf/mth (1.3% q-o-q)
35 1 JTC J-Space, 28 Jan 2021Outlook
Singapore
Challenging operating environment in view of uncertainty over trajectory of economic recovery
from COVID-19 pandemic
• Singapore economy contracted by 3.8% y-o-y in the quarter ended 31 Dec 2020, an improvement
from 5.6% contraction in the preceding quarter1
• While business sentiment among local firms in 1Q2021 has improved for two consecutive quarters, it
is expected to remain volatile for 1H20212
Impact on Singapore Portfolio
• Continue to support tenants, especially small and medium-sized enterprises (“SME”) tenants who
have been affected by supply chain disruptions and fall in business volume as a result of the
pandemic. As at 31 Dec 2020, about 54% of the Singapore Portfolio (or 40% of the Overall Portfolio)
(by gross rental income) are SME tenants
• Rental reliefs of about S$9.0 million had been extended to tenants across three quarters of FY20/21
with additional rental reliefs to be given in 4QFY20/21, which comprises MIT’s COVID-19 Assistance
and Relief Programme and mandated rental reliefs under the COVID-19 (Temporary Measures) Act
2020. This will affect MIT’s distributable income for FY20/21
• As at 31 Dec 2020, rental arrears of more than one month remained the same at 1.4% of previous
12 months’ gross revenue as compared to 30 Sep 2020
1 Source: Ministry of Trade and Industry (Advance Estimates), 4 Jan 2021.
36 2 Source: Singapore Commercial Credit Bureau, 1Q2021.Outlook
North America
Resilient asset class with growth opportunities
• According to CBRE3, the absorption in primary North American data centre markets totalled
134.9 megawatts (“MW”) in 1H2020 and the strong demand is set to continue in 2021
• There will be continued demand for high-quality and highly connected data centre space, driven by
5G adoption, edge computing and the increasing trend of enterprise clients leveraging on hybrid IT
solutions to satisfy their remote working mandates. However, the growth of the demand drivers for
data centres will begin to plateau in 2021 as the pressures created from the pandemic begins to
subside
3 Source: CBRE 2021 US Real Estate Market Outlook, 11 Nov 2020.
37Diversified and Resilient
Anchored by large and diversified tenant base with low dependence
Stable and
on any single tenant or trade sector
Resilient Portfolio
Focus on tenant retention to maintain a stable portfolio occupancy
Enhanced Aggregate leverage ratio of 37.3% provides sufficient headroom for
Financial investment opportunities
Flexibility Committed facilities of more than S$600 million available
Redevelopment of the Kolam Ayer 2 Cluster remains on track for
Growth by
completion in 2H2022
Acquisitions and
Acquisition of a data centre located in Virginia, United States to be
Developments
slated for completion in 1Q2021
38End of Presentation For enquiries, please contact Ms Melissa Tan, Director, Investor Relations, DID: (65) 6377 6113, Email: melissa.tanhl@mapletree.com.sg
You can also read