Augmented Reality (AR) Predictive Maintenance System with Artificial Intelligence (AI) for Industrial Mobile Robot - SAS
←
→
Page content transcription
If your browser does not render page correctly, please read the page content below

Paper 3628-2019

   Augmented Reality (AR) Predictive Maintenance System with Artificial
              Intelligence (AI) for Industrial Mobile Robot
 Yee Yang Tay, Kai Woon Goh, Marvin Dares, Ye Sheng Koh, and Che Fai Yeong, Universiti
Teknologi Malaysia; Mark Chia, SAS Institute; Ping Hua Tan, DF Automation and Robotics Sdn
                                            Bhd

ABSTRACT

Modern machines are equipped with a plethora of sensors, generating plenty of data.
However, without the necessary analytical tools and work flow in place, the readings of
these sensors often leave plenty of untapped potentials on the table. In addition, a factory
could possibly deploy machines of different varieties and makes, which leads to increased
complexity of maintenance, and an increased need for technical know-how. The lack of
these would hamper maintenance efforts as well as prolong downtime.

Thus, with the onset of Industry 4.0, the ubiquity of sensors leading to large volume of data
together with the advancements made in artificial intelligence, will lead to increased
productivity as well as enabling the automation of systems. This project aims to
demonstrate the concept of predicting machine faults by manipulating advanced data
analysis techniques and enhancing maintenance efforts through the use of Augmented
Reality. Relevant data with regards to the health and performance of the machines such as
current consumption, voltage, sectional vibration and others are collected and transmitted
through an Internet of Things (IoT) gateway to a centralized location, where the factory
guardians are in place to monitor in real-time.

This model allows maintenance sessions to be pre-planned so replacement parts and
resources can be made available and maintenance breaks to be executed efficiently. All of
which contribute to greatly increase the productive time of assets in a manufacturing
scenario.

INTRODUCTION
Globally, manufacturing continues to grow and this industry now accounts for approximately
16% of global gross domestic product (GDP) and 14% of employment. With the wave of
industry 4.0 revolution, this trend has escalated the need of industrial mobile robots in
manufacturing to enhance workplace efficiency. Mobile robots can move autonomously
inside the factories to automate indoor material handling. The benefits include reducing
dependency on manual handling and increasing efficiency with cost reduction, as outlined in
smart manufacturing concept.
In 2016, the total market in the global mobile robotics market was US$8.58 billion with
compound annual growth rate (CAGR) of 15.60% between 2017 and 2025. Figure 1 shows
the increment of mobile robotics market revenue in 2016. One of the recent takeover of
Teradyne on Mobile Industrial Robots (MiR) robot maker for $148 million highlighted the
importance of industrial mobile robot at this time.

                                             1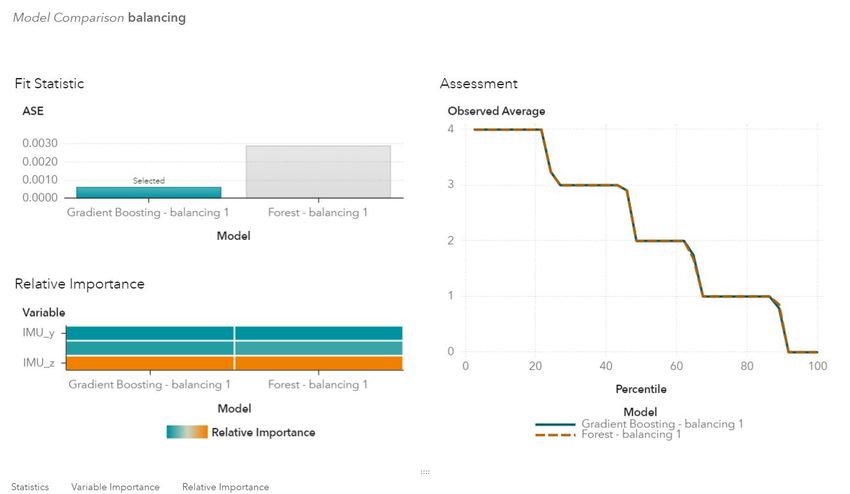
Figure 1. Prediction of Mobile Robotics Market Revenue by Analysts.
With the Industry 4.0 revolution, most of these mobile robots are interconnected with other
machines and infrastructure along the production chain, forming a continuous production
flow. Thus, these mobile robots cannot afford to break down and need to have scheduled
preventive maintenance at regular intervals. Too frequent maintenance causes loss in
productivity but too little maintenance may cause machine to breakdown unpredictably.
Ideally, production plants will want a maintenance schedule with minimum amount of
maintenance time, without jeopardizing machine performance. Prediction of machine
performance using analytic methods can help achieve this fine balance.
Predictive maintenance (PdM) and prognostics and health management are approaches that
use condition monitoring data to predict the future condition of the machine and make
decisions based on this prediction. Study proved that predictive maintenance is the
preferred maintenance method in 89% of cases. Besides, research concluded that predictive
maintenance increases equipment uptime by 10 to 20% while reducing overall maintenance
costs by 5 to 10% and maintenance planning time by 20 to 50%. It ensures better product
quality, allows just-in-time maintenance, minimise equipment downtime, and avoid
catastrophic failure. Implementation of effective prognosis for maintenance can yield a
variety of benefits including increased system safety, improved operational reliability,
increased maintenance effectiveness, reduced maintenance work and reduced life cycle cost.
With the prevalence of automation in industries, an unscheduled downtime caused by faulty
industrial machines and robots will result in a significant drop in productivity and efficiency
of the affected areas. Thus, maintenance, repair, and operation (MRO) is vital to reduce the
frequency of unscheduled downtime and reduce maintenance costs in the long run. MRO is
the process of maintaining, repairing, and replacing (if necessary) devices, equipment, and
machinery that are being used. An inadequate or lack of maintenance may cause accidents
to occur and contributes to unscheduled downtimes. Hence, it is crucial in ensuring the
safety of plant personnel and environment in addition to the timely delivery of quality
products in an environmentally responsible way.
The projects aims to develop an accurate and fast predictive maintenance using IoT with
predictive maintenance. Data can now be collected in volume due to the ubiquity of sensors

                                               2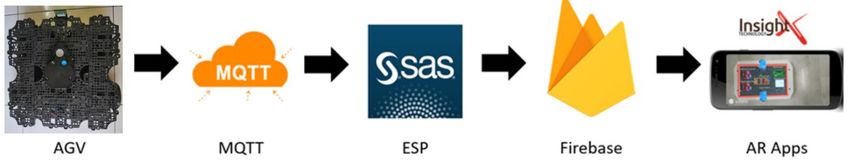
and triggers, in velocities never imagined before due to the connectedness of these devices.
It is now possible to analyse the wealth of data using modern machine learning methods at
speeds and intelligence that are now useful. These combined has made possible new
maintenance models going up the maturity curve and new value creation.

METHODOLOGY
SIMULATED AGV MODEL
Figure 2 shows the AGV model used in this project which is a Turtlebot 3 Waffle Pi. Inside
the simulated AGV model, the motion is facilitated by two differential navigation wheels
actuated with a DYNAMIXEL XM430-W210-T motor on each wheel. The performance of the
model is determined by motion sensor MPU9250, a System in Package (SiP) containing two
chips which are MPU-6500 and AK8963. The MPU-6500 incorporates a three-axis gyroscope,
a three-axis accelerometer and a Digital Motion Processor (DMP). The AK8963 is a three-
axis digital compass. The MPU-9250 is the inertial measurement unit (IMU) of the AGV.
OpenCR is a 32-bit ARM Cortex®-M7 microcontroller board used for extracting sensor data
and to control the AGV actuation. Kalman filter is applied on the data collected to increase
its accuracy. The data is then transmitted to cloud using a Raspberry Pi 3 Model B which
features a quad-core 64-bit ARM Cortex A53 clocked at 1.2GHz and it also includes on-
board 802.11n WIFI to work as a standalone IoT device. The other sensors included within
the AGV model such as the 360° LIDAR and the Raspberry Pi Camera are not used for this
project.

Figure 2. Top View of Simulated AGV Model

DATA FLOW
The raw data from IMU sensors of AGV is extracted using OpenCR and then passed to the
Raspberry Pi 3 board to transmit the data to MQTT, a lightweight messaging protocol. Then,
MQTT will push the data to SAS Event Stream Processing (ESP). The raw data is then
analysed in the analytical model loaded in ESP and the output data is then uploaded in the
Google Firebase database. The database is linked to the Augmented Reality (AR) Application
coded using Unity and Vuforia Engine. The entire flow of data is summarised in Figure 3.

                                             3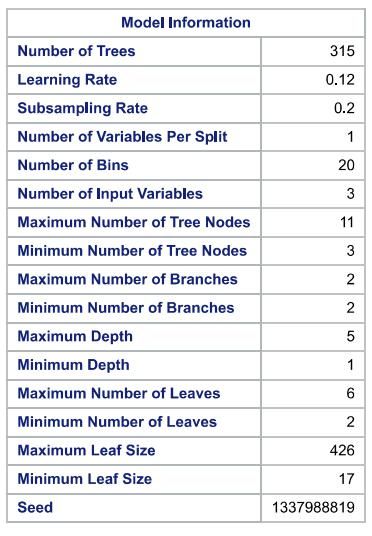
Figure 3. Flowchart of Project Data Flow

MODEL SELECTION
There are various analytical models available to be tested on the raw IMU sensors’ data
from AGV. Gradient Boosting and Forest model were deployed in SAS Visual Data Modelling
and Machine Learning (VDMML) for comparison to determine which model is more suitable
to the use case of tracking balancing of AGV.
Figure 4 illustrates the results of model comparison in VDMML. The results consist of Fit
Statistics, Relative Importance and Assessment between Gradient Boosting model and
Forest model. Relative Importance indicates the significance of a variable to a given model
in making prediction. From Figure 4, Relative importance reveals that for both models,
IMU_y variable has the highest significance followed by IMU_y and finally IMU_z. Further
details regarding the variables will be explained in the Discussion section. The Assessment
from Figure 4 is similar for both models. The graph in Assessment has a shape like a “5
steps” where at each steps represents different values of observed average. For this use
case, the observed average represent the fault conditions. For example, observed average
with value of 4 represents fault condition ‘4’ where AGV tilts to the left and observed
average with value of 2 represents fault condition ‘2’ where AGV tilts to the right. The
overall percentile of Fault condition ‘2’ and fault condition ‘0’ is lesser compared to the other
fault conditions, ‘4’, ‘3’ and ‘1’, implying that the model has lesser source data for fault
condition ‘2’ and ‘0’ compared to the other fault conditions. Fit Statistics from Figure 4
shows the Average Squared Error (ASE) between both models. Lesser ASE means better
prediction accuracy of the model as ASE represents the error rate of a prediction model.
Based on model comparison, Gradient Boosting model is selected and built in SAS code
because it has lower ASE. The built model is then extracted to be included into SAS ESP.

                                               4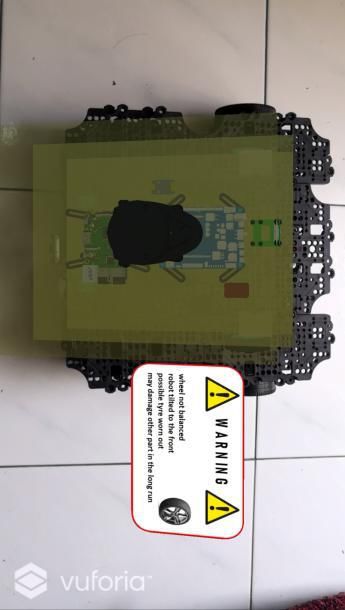
Figure 4. Comparison between Gradient Boosting and Forest

ESP
Firstly, preprocessing of data is performed via ESP to clean up the data. Data entries that
are outliers are filtered and removed as these are considered as errors during data
collection. Missing data is substituted with data obtained from imputation process where the
mean is used for interval variable and mode for categorical variable.
The machine learning model is deployed in ESP to detect the abnormalities or fault condition
of the model. Gradient Boosting machine learning model is selected to fit in this case to
classify the desired data output. Gradient Boosting is a supervised learning method for
classification and regression which ensemble weak prediction models to acquire a more
accurate and stable prediction. This technique is an improved version of the decision tree
learning model as it overcomes the underfitting problem and reduces error rate caused by
multi-variable and complicated data trends. Gradient Boosting focuses on two main
techniques, bagging and boosting. Bagging is also known as bootstrap aggregating where
numbers of a subset of data are separated based on the mean square error of predicted
data in the previous step in an iterative fashion. It is designed to improve the stability,
reduce variance and help to avoid overfitting. Boosting is a machine learning ensemble
meta algorithm for primarily reducing bias, and also variance in supervised learning.
The outcome of real-time analysis is then stored in a cloud database, Google Firebase while
the Augmented Reality (AR) Application created via Unity and Vuforia is linked with the
database to provide data visualization. Figure 5 shows the overall flow of data processing in
ESP.

                                             5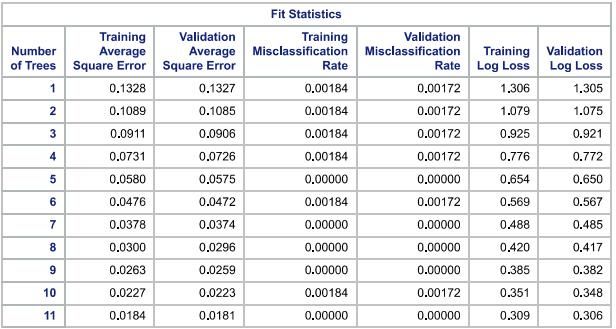
Figure 5. Data Flow in SAS ESP

DISCUSSION
The data collected from the simulated AGV model includes vibration along x, y, z-axis and
mean vibration along x, y, z-axis. The fault condition to be determined is the level of
balancing of the AGV. Table 1 listed out the information of the Gradient Boosting model built
using SAS code. The number of decision trees generated is 315 and the maximum leaf size
is 426.

                                             6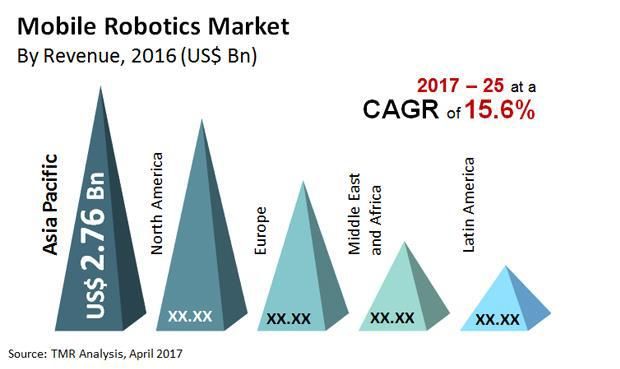
Table 1. Model Information
Table 2 shows the relative importance of the variables in tabulated form while Figure 6
shows in the bar chart form. IMU_x is the tilting angle of the AGV with respect to roll axis of
the AGV. IMU_y is the tilting angle of the AGV with respect to the pitch axis of the AGV.
IMU_z is the tilting of the AGV with respect to the yaw angle of the AGV. From Table 2 and,
variable IMU_y is the highest at 20.0667, followed by IMU_x at 18.4253 and finally IMU_z
at 11.8975. Data in Table 2 and Figure 6 suggests that IMU_y and IMU_x are more effective
on determining the the level of balancing for AGV compared to IMU_z. IMU_z is identified to
be more susceptible to noise during the initial data tabulation, hence its lack of importance.
The yaw angle of the AGV is more related to the turning of the AGV in navigation instead of
tilting of AGV.

Table 2. Variable Importance in Tabulated Form

                                                 7
Figure 6. Variable Importance in Graphical Form
Table 3 indicates that the ASE is lowest at 0.0184 and 0.0181 for training and validation
respectively. The ASE for training and validation becomes lesser as the number of trees
increases from 1 to 11. Figure 7 indicates the misclassification rate during validation and
training where the misclassification rate is the lowest on the 5th, 7th to 9th and the 11th
iterations. The abnormality of the misclassification rate graph as shown in Figure 7 is due to
the dataset used is less complicated. Hence, a larger dataset is required to obtain better
results. The trained machine learning model is then stored in SAS server as Astore file. The
Astore file is then extracted out via secure shell (SSH) session using MobaXterm and loaded
into ESP to be used to classify raw data.

                                                  8
Table 3. Fit Statistics
Figure 7. Misclassification by Number of Iterations (Validation vs. Training)
9Figure 8 represents the auto generated email notification received by the industry personnel
when the specific simulated AGV model encounters fault. This email will help the user to
locate the specific AGV model and explain the fault condition triggered besides stating out
the possible cause of the fault. After reading through this notification, the user can then
proceed on troubleshooting the AGV model by using the AR application.
Figure 8. Email Notification during Machine Fault Condition
Figure 9 shows circuitry of the AGV model and dialogue box in AR display. Dialogue box will
pop-up to indicate possible fault conditions.
Figure 9. Image of Augmented Reality Visual Indicator on AGV Model
10CONCLUSION
IMU data collected from AGV is processed and used to train machine learning model to
determine the level of balancing of the robot. With the trained machine learning model, the
state of the motor can be classified into fault conditions which will then appear on the
dialogue box in display of the AR application. The fault conditions are also sent via email as
alert notification.
The downtime of the machine can be greatly reduced by predicting the machine failures and
optimizing maintenance schedules. By knowing possible faults that could occur beforehand,
parts and resources could be prepared before the machine failures happen. Factory
personnel will be more prepared for machine maintenance and rectification works with
Augmented Reality providing visual assistance.
REFERENCES
Transparency Market Research. 2017. “Mobile Robotics Market (Type - Unmanned Ground
Vehicles, Unmanned Aerial Vehicles, Unmanned Surface Vehicles, and Autonomous
Underwater Vehicles; Application - Industrial and Service) - Global Industry Analysis, Size,
Share, Growth, Trends and Forecast 2017 - 2025.” Accessed on September 10, 2018.
https://www.transparencymarketresearch.com/mobile-robotics-market-2017-2025.html.
Frank Tobe. 2018. “Teradyne acquires MiR for $272M, continues robotics spree.” Accessed
on September 10, 2018. https://www.therobotreport.com/teradyne-acquires-mir-272m/
Hashemian, H. M. and Bean, W. C. 2011. "State-of-the-Art Predictive Maintenance
Techniques*." IEEE Transactions on Instrumentation and Measurement, 60, 3480-3492.
Deloitte. 2017. “Predictive Maintenance Taking pro-active measures based on advanced
data analytics to predict and avoid machine failure.” Retrieved on September 15, 2018.
https://www2.deloitte.com/content/dam/Deloitte/de/Documents/deloitteanalytics/Deloitte_
Predictive-Maintenance_PositionPaper.pdf
Robotis. 2019. “Turtlebot 3 Waffle Pi”. Retrieved on September 16, 2018.
http://www.robotis.us/turtlebot-3-waffle-pi/
InvenSense Inc.. 2014. MPU-9250 Product Specification Revision 1.0. Retrieved on
September 17, 2018.
https://store.invensense.com/datasheets/invensense/MPU9250REV1.0.pdf.
ACKNOWLEDGEMENTS
We would like to extend our heartfelt appreciation towards SAS Institute Malaysia who has
provided us the technical guidance, expertise, and software to build the machine learning
models in the project. This research is funded by Collaborative Research in Engineering,
Science and Technology (CREST) in which their contribution has helped to make the
development of this project possible. We would also like to thank DF Automation for
providing sensor data which is used to train the machine learning models in the project.
Lastly, we would like to thank Dr. Yeong Che Fai from Universiti Teknologi Malaysia, Dr.
Mark Chia from SAS Institute Malaysia, and Dr. NorAzmi Alias from CREST for sharing
invaluable advice and assistance throughout the duration of this project.
11CONTACT INFORMATION
Your comments and questions are valued and encouraged. Contact the author at:
Yee Yang Tay
Universiti Teknologi Malaysia
ahken05@gmail.com
Kai Woon Goh
Universiti Teknologi Malaysia
(+60)126403195
rikugkw@gmail.coml
Marvin Dares
Universiti Teknologi Malaysia
(+60)197087532
marvdares95@gmail.com
Ye Sheng Koh
Universiti Teknologi Malaysia
(+60)163278520
jasonkys35@gmail.com
Che Fai Yeong
Universiti Teknologi Malaysia
cfyeong@utm.my
Mark Chia
SAS Institute
mark.chia@sas.com
12You can also read