ENHANCEMENT OF VALIDATION STUDIES FOR REACTOR DOSIMETRY AND ACTIVATION PREDICTIONS WITH THE NUCLEAR DATA SAMPLING METHODOLOGY
←
→
Page content transcription
If your browser does not render page correctly, please read the page content below
EPJ Web of Conferences 247, 10021 (2021)                                                               https://doi.org/10.1051/epjconf/202124710021
PHYSOR2020

                        ENHANCEMENT OF VALIDATION STUDIES FOR
                     REACTOR DOSIMETRY AND ACTIVATION PREDICTIONS
                     WITH THE NUCLEAR DATA SAMPLING METHODOLOGY

                                      A. Vasiliev, M. Pecchia, D. Rochman, H. Ferroukhi

                                                      Paul Scherrer Institut
                                      Forschungsstrasse 111, 5232 Villigen PSI, Switzerland

                                      alexander.vasiliev@psi.ch, marco.pecchia@psi.ch,
                                  dimitri-alexandre.rochman@psi.ch, hakim.ferroukhi@psi.ch

                                                                   ABSTRACT

                 The CASMO/SIMULATE/MCNP/FISPACT-II calculation route has been established at the
                 Paul Scherrer Institute (PSI) for reactor dosimetry and activation studies. Furthermore, the
                 in-house tool NUSS is in use at PSI for nuclear data (ND) related uncertainties
                 quantifications with Monte Carlo neutron transport calculations. The use of randomly
                 sampled ACE-formatted ND files not only allows propagation of the ND uncertainties, but
                 also can serve for assessing the applicability of different types of experimental data for
                 validation of calculation predictions of parameters of interest. In the present work an
                 application of the PSI calculation scheme for analysis of activation reaction rates and the fast
                 neutron fluence (FNF), throughout the Swiss pressurised water reactor (PWR) and simplified
                 containment building models, is demonstrated. As particular examples of potentially
                 available experimental data, two kinds of the neutron flux monitors are considered: a) the
                 reactor pressure vessel scraping samples and detectors placed in the dosimetry channels,
                 mounted at the core barrel and designed for validation of FNF calculations, and b) the ex-
                 vessel dosimeters, specifically used by the Swiss waste management organisation (NAGRA)
                 for validation of bio-shield activation predictions. The calculations were done with the
                 ENDF/B-VII.1 library. The obtained results demonstrate importance of the ND uncertainties
                 for the dosimetry evaluations. The assessment of the applicability of the selected
                 experimental information for validation of the bio-shield irradiation calculations was done
                 based on evaluation of the ND-related Pearson correlation coefficients.

         KEYWORDS: Reactor dosimetry, Concrete bio-shield, Validation, Uncertainties, Correlations

                                                            1. INTRODUCTION

         Two topics related to reactor neutronics and radiation transport simulations have received attention within
         the last decade worldwide. One is related to optimization of decommissioning and dismantling processes,
         which becomes important for the aging light water reactor (LWR) park of generation II nuclear power
         plants (NPPs). Another one is in turn related to the concepts of significantly extending the originally
         designed reactor lifetimes for some of the reactors from the same generation II fleet in some countries.
         Both topics are currently actual for the Swiss nuclear electricity sector. Therefore, two relatively new
         calculation tasks became important at PSI for supporting Swiss nuclear industry needs. The first is the
         R&D on reactor structures activation for efficient radioactive wastes characterization. The second is an

  © The Authors, published by EDP Sciences. This is an open access article distributed under the terms of the Creative Commons Attribution License 4.0
  (http://creativecommons.org/licenses/by/4.0/).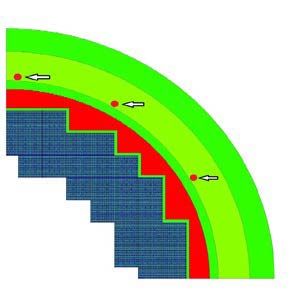
EPJ Web of Conferences 247, 10021 (2021)                                               https://doi.org/10.1051/epjconf/202124710021
PHYSOR2020

         enhanced prediction of the radiation doses received by reactor materials, for better assessment of the
         radiation-induced embrittlement, at the conditions of the extended reactor operation times. In the present
         paper, the recent developments realised at PSI towards simulation predictions in application to the two
         mentioned cases are outlined with primary focus given to the concrete reactor bio-shield (BS) irradiation.

         The reactor concrete BS traditionally did not belong to the list of reactor structures for regular irradiation
         assessments and even the interest to the BS activation simulations has started to grow only recently, in
         relation to the forthcoming decommissioning projects [1,2]. It shall be recognised that on the contrary to
         the activation reactions, which are primary induced by thermal neutrons, the reactor materials (steels,
         concrete, reinforced concrete) degradation under irradiation is mainly caused by fast neutrons (see details,
         e.g., in [3]). Therefore, even though the both types of calculations have many parts in common, different
         sources of experimental data can be appropriate for rigorous validation of each specific calculation
         methodology. In this context, it shall be noted that the validation studies typically aim at assessment of
         calculation biases and uncertainties associated with usage of a particular computation code and, which
         may be most important, a particular ND library. Furthermore, it is practically relevant not only to
         propagate ND uncertainties in the calculation simulations, but also to assess correlations between an
         application system and available experimental benchmarks [4], which shall help selecting the most
         appropriate benchmarks for the methodology validation.

         In order to address the above mentioned questions, the CASMO/SIMULATE/MCNP® 1 /FISPACT-II
         reference calculation methodology for LWR dosimetry applications, recently established at PSI [5,6], is
         now complemented with the capability for ND random sampling with the in-house tool NUSS [7]. The
         present work is done in application to a Swiss PWR reactor. The experimental data considered in this
         work includes: 1) the reactor pressure vessel ‘scraping samples’ and the ‘gradient probes’ detectors placed
         in the dosimetry channels, mounted at the core barrel and designed for validation of FNF calculations, and
         2) the ex-vessel dosimeters, specifically designed by NAGRA (Swiss national technical competence
         centre in the field of deep geological disposal of radioactive waste) for validation of the BS activation
         predictions. Assessment of the ‘representativity’ of the selected experimental information for validation
         of the BS irradiation calculations was done on the basis of the ND-related Pearson correlation coefficients
         (in a similar manner as commonly used in criticality safety with ORNL SCALE/TSUNAMI software, see,
         e.g., discussions in [4,8]). The calculations were done using the ENDF/B-VII.1-based ACE files library.

               2. PSI METHODOLOGY FOR LWR DOSIMETRY AND ACTIVATION ASSESSMENTS

         A detailed description of the CASMO/SIMULATE/MCNP calculation methodology originally established
         at PSI for LWR dosimetry applications can be found in [9]. The methodology is based on utilization of the
         dedicated ‘SOURCE4MC’ tool which allows translation of Studsvik's codes CASMO/SIMULATE
         calculation results on the power and nuclide concentrations’ spatial distributions into MCNP (SDEF card)
         pin-wise neutron source specifications [10]. Recently, the CASMO/SIMULATE/MCNP system has been
         linked at PSI with the FISPACT-II inventory code with the help of another PSI tool ‘COMPLINK’ [11].
         COMPLINK was designed for the representation of material data in MCNP (SERPENT) inputs. Thus, it
         allows automatized splitting of MCNP model cells on a user-defined 3-D mesh in the selected regions of
         interest, which facilitates coupling with 0-D FISPACT-II set of models for isotopic inventory calculations.
         The entire calculation scheme referred to as SOURCE4MC-X allows neutron fluxes normalization based
         on the actual operating history and their consequent transfer from the MCNP calculations to FISPACT-II
         for activation and dpa (displacement per atom) evaluations. The overall calculation route is demonstrated
         in Fig. 1. Finally, the ORNL code ADVANTG is applied for automatic generation of weight windows for
         efficient variance reduction for the MCNP deep penetration calculations [2,5,6], when the flux attenuation
         from the reactor core to the concrete BS can exceed ten orders of magnitude.

         1
             see https://mcnp.lanl.gov for details on the MCNP® software trademark.

                                                                   2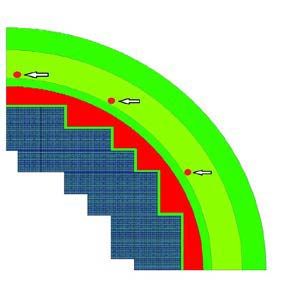
EPJ Web of Conferences 247, 10021 (2021)                                                                             https://doi.org/10.1051/epjconf/202124710021
PHYSOR2020

                                               Geometry            CASMO-5/SIMULATE-3
                                                Material            Core-follow calculation       - Source term
                                                                                                  - Time-dependent
                                           SOURCE4MC                                              total neutron
                                                                                                  source [n/s]
                                                                    MCNP model template

                                           SOURCE4MC-X
                                             ADVANTG                     COMPLINK
                                                WW                  MC model generator
                                             generation               (PSI in-house tool)
                                                      Automatic model                            Update isotopic
                                                          update                                    vectors
                                                          MCNP6                               FISPACT-II
                                                      Neutron transport                     Nuclide evolution
                                                           solver         Neutron flux            solver

                                                                     Final isotopic vectors
                                                                    Activity related outputs

                  Figure 1. PSI methodology for LWR structures irradiation & activation evaluations.

                   3. NUCLEAR DATA STOCHASTIC SAMPLING WITH THE PSI TOOL NUSS

         The NUSS tool was developed to allow random sampling of the ND in ACE formatted files (read the
         reference ACE file and modify its data), based on uncertainties (covariances) information provided in
         ENDF-type libraries. At present, the ND can be sampled assuming the multivariate normal distributions,
         as soon as no solid grounds to utilize other types of probability density functions could be identified so
         far. For that, ENDF/B files MF-31, -32, -33, -35 need at first to be processed with NJOY to generate
         group-wise covariance matrices, which then can be used in the random sampling procedure applied to the
         continuous-energy ND [7]. NUSS also takes into account correlations between different reaction channels
         or isotopes, when such information is available. Fig. 2 shows an illustration of the NUSS approach. Each
         individual block of the total correlation matrix (CM) on the left side of Fig. 2 consists of a G*G CM for
         individual reaction channel, where G is the number of energy bins. In the present study, 187 energy bins
         structure was applied, consistently with the studies reported in [8]. The right side of Fig. 2 illustrates a
         point-wise cross-section and its group-wise uncertainty. One can notice that NUSS represents a non-
         intrusive approach for Monte Carlo codes (MCNP, SERPENT, RMC, etc.), which allows consistent
         comparison to other stochastic or deterministic methods, as was demonstrated previously [12]. By present
         time, NUSS was tested primary in combination with MCNP and SERPENT codes and applied for both
         criticality safety [4] and dosimetry applications [8,13].

                               Figure 2. An illustration on the NUSS ND sampling approach
                   (left – the total CM; right – a cross-section and its group-wise standard deviation).

                                                                             3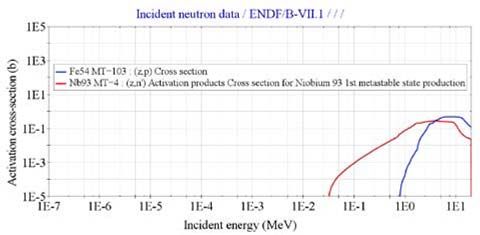
EPJ Web of Conferences 247, 10021 (2021) https://doi.org/10.1051/epjconf/202124710021
PHYSOR2020
4. THE SWISS PWR APPLICATION CASE
The present study was done in application to the Swiss ‘Pre-convoy’ 3-loops PWR at the Goesgen NPP
(Kernkraft Gösgen, KKG). The KKG MCNP model was originally developed at PSI for the Reactor
Pressure Vessel (RPV) FNF analysis with the primary focus on the belt-line RPV region [9,14] and
efficient FNF predictions [15] and later extended on the ex-core neutron detector responses analyses [16].
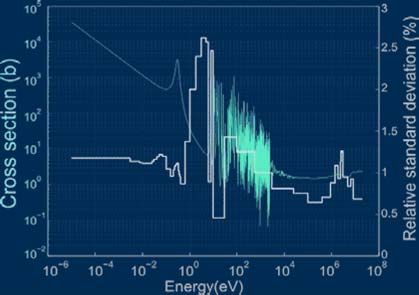
The present model covers the concrete BS parts, keeping however the axial elevation limited by the core
height and nearby ‘axial reflectors’. The MCNP model is illustrated on Fig. 3, where the correspondence
with the full-scale RPV scheme is also provided for clarity. It shall be noticed that for detailed materials
activation studies one needs to use a full-scale 3D model, as is the case in the dedicated simulations of
such type, performed at NAGRA [1,2]. However, for the sake of the given scoping study, it is considered
adequate to use the present ‘truncated’ MCNP model. The MCNP model was complemented with cycle-
specific coolant density specifications as well as with the 3D pin-wise neutron source specifications
generated on the basis of the CASMO/SIMULATE core-follow calculations [9,10]. The model was
validated using the experimental data available for the given PWR, as described in the next section.
Core barrel
RPV Insulation
Bioshield-1 Bioshield-2
(BS1) (BS2)
Figure 3. An illustration on the axial cross-section of the employed MCNP PWR model.
5. DATA AVAILABLE FOR VALIDATION
5.1 Ex-core Dosimetry Data from KKG PWR
The reference experimental information included the so called ‘scraping test’ (ST) data, which was
obtained from activity measurements for the RPV steel scraping samples extracted after 11 and 27
operation cycles [9,14] and also from activity measurements for the ‘gradient probes’ (GP) samples,
extracted after irradiation during the first 27 operation cycles of the given PWR [14]. Locations of the
considered samples within the used MCNP model are illustrated on Fig. 4. Detailed descriptions of the
realized validation studies and the experimental data can be found in [5,9,14]. The dosimetry reactions
used for experimental analysis were 54Fe(n,p)54Mn and 93Nb(n,n’)93mNb.
4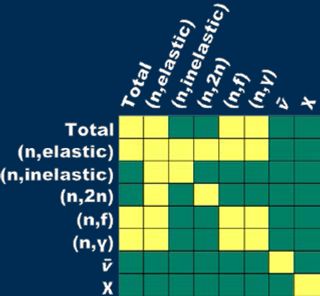
EPJ Web of Conferences 247, 10021 (2021)                                                              https://doi.org/10.1051/epjconf/202124710021
PHYSOR2020

                                                                                 Gradientprobe
                                                                                Gradient         Scraping test
                                                                                  probe            samples
                                                                         bypass
                                                                          bypass
                                                           Down-
                                                           comer

                                                                   RPV        Core

                                                   Core barrel
                                                                               Core

                                                                                                         RPV

            Figure 4. An illustration on the experimental data available for the FNF predictions validation.

         5.2 NAGRA’s Dosimetry Data for Validation of the BS Activation Simulations

         As concerns the data appropriate for validation of the ex-RPV calculations, NAGRA has realized in
         collaboration with the KKG NPP a dedicated experimental program [1]. The measurements were
         designed for validation of the activation calculations for the ex-vessel reactor materials, which are
         necessary for optimization of the future dismantling and decommissioning processes [2]. Namely, three
         types of dosimeters sensitive to different neutron energy spectrum parts had been used in the irradiation
         campaigns: 109Ag(n,J)110mAg, 59Co(n,J)60Co and 58Ni(n,p)58Co. The cross-sections of these dosimetry
         reactions are illustrated on Fig. 6, together with the cross-sections outlined in Section 5.1. The figure was
         produced with the OECD/NEA JANIS software (https://www.oecd-nea.org/janis/). Obviously, the
         58
            Ni(n,p) reaction is also appropriate for FNF validation studies, while the other two are more relevant for
         validation of the activation calculations primary induced by thermal neutrons.

         It shall be acknowledged that even though NAGRA’s experimental campaign was specifically focused on
         validation of the neutron transport and activation calculations at the concrete BSs, there were some
         technical limitations affecting the experimental setup and consequent measurements. At first, the
         dosimeters irradiation could only be done at a few (ten) locations (see Fig. 4. in [1]), all of them being
         above the core axial elevation, i.e. no experimental data could be obtained for validation of the concrete
         irradiation at the axial level of the maximum neutron flux amplitude. At second, the dosimeters were
         irradiated within only one reactor cycle and thus strictly speaking the measured data cannot be fully
         representative for a longer-time reactor operating history (note that the half-life of 58Co is only 70.8 days,
         meaning that the 58Ni detector is not well suitable for irradiation times above one reactor cycle). Thus, a
         pertinent question at the given circumstances is whether the experimental data employed at PSI for the
         RPV FNF validation could also be of relevance for validation of FNF at the concrete BSs.

         Figure 6. Dosimeters employed in Ref [1] for validation of the PWR BS activation simulations (left)
                     and in Ref [9,14] for validation of the PWR RPV FNF simulations (right).

                                                                          5
EPJ Web of Conferences 247, 10021 (2021) https://doi.org/10.1051/epjconf/202124710021
PHYSOR2020
6. RESULTS
The calculations of the described MCNP models were realized with ~250 random sets of the ACE-
formatted files for the relevant isotopes of the fuel, coolant and structural materials 2, generated with the
help of NUSS. The perturbed reactions included (n,n), (n,n’), (n,2n) and (n,J) cross-sections for non-
actinides and in addition (n,f), prompt neutron multiplicity തതത
ߥ and prompt fission neutron spectra ߯ for
actinides. ENDF/B-VII.1 library was used as the source of the underlying ND, including the related
covariance matrices. Typical computation time of a single MCNP run with 108 neutron histories using 20
cores of a high-performance PSI Linux cluster was ~1hour (wall clock). The calculation results were
processed to evaluate the ND-related uncertainties (see Table I) and the Pearson correlation coefficients,
together with associated 95% confidence intervals (see Table II). The data processing was done with the
help of the “PerformanceAnalytics” package for R software environment (see for details https://cran.r-
project.org/). The neutron flux results “)” (up to 20 MeV) were split in three energy bins with the
boundaries at 0.1 and 1.0 MeV. The labels BS1 and BS2 correspond to the two BS areas as illustrated on
Fig. 3. The 95% confidence intervals are given in Table II below the Pearson coefficients values.
Table I. ND-related calculation uncertainties and corresponding MCNP relative errors (VMC, %).
Dosimeter type / Location
GP/Barrel ST / RPV BS1 BS2
ND MC ND MC ND MC ND MC
Fe-54(n,p) 6.6 0.2 11.0 0.2
Nb-93(n,n') 7.0 0.1 10.8 0.1
Ag-109(n,J 10.2 0.2 16.7 0.3
Co-59(n,J) 10.3 0.2 16.4 0.3
Ni-58(n,p) 15.5 0.2 22.2 0.4
)_E0.1MeV 6.0 0.1 9.9 0.1 15.3 0.2 19.0 0.3
)_E>1MeV 7.4 0.1 11.5 0.1 10.4 0.1 16.9 0.3
dpa 6.5 0.1 10.3 0.1 11.6 0.2 18.4 0.3
Table II. ND-related Pearson correlation coefficients obtained for the considered models and parameters.
1.00 0.90 0.80 0.70 0.60 0.50 0.40 0.30 0.20 0.10 0.00
Dosimeter type / Location
GP/Barrel ST/RPV RPV BS1 BS2
Fe-54 Nb-93 Fe-54 Nb-93 FNF dpa Ag-109 Co-59 Ni-58 Ag-109 Co-59 Ni-58
)_BS1_E0.1MeV 0.71 0.60 0.90 0.83 0.82 0.85 0.83 0.81 0.93 0.99 0.97 0.89
[0.65, 0.77] [0.52, 0.67] [0.87, 0.92] [0.79, 0.87] [0.77, 0.85] [0.81, 0.88] [0.79, 0.87] [0.77, 0.85] [0.91, 0.94] [0.98, 0.99] [0.96, 0.98] [0.86, 0.91]
)_BS1_E>1MeV 0.70 0.77 0.76 0.90 0.69 0.86 0.82 0.81 0.75 0.82 0.82 0.64
[0.63, 0.76] [0.74, 0.83] [0.71, 0.81] [0.88, 0.92] [0.62, 0.75] [0.82, 0.89] [0.77, 0.86] [0.76, 0.85] [0.69, 0.80] [0.77, 0.85] [0.78, 0.86] [0.56, 0.71]
)_BS2_E>1MeV 0.69 0.56 0.90 0.81 0.78 0.82 0.79 0.77 0.95 0.97 0.94 0.94
[0.62, 0.75] [0.47, 0.64] [0.88, 0.92] [0.76, 0.85] [0.73, 0.83] [0.78, 0.86] [0.74, 0.83] [0.72, 0.82] [0.94, 0.96] [0.96, 0.97] [0.93, 0.95] [0.93, 0.96]
dpa_BS1 0.84 0.86 0.86 0.97 0.88 0.96 0.96 0.95 0.77 0.87 0.88 0.65
[0.80, 0.87] [0.83, 0.89] [0.83, 0.89] [0.96, 0.98] [0.85, 0.90] [0.95, 0.97] [0.95, 0.97] [0.94, 0.96] [0.71, 0.81] [0.85, 0.90] [0.84, 0.90] [0.58, 0.72]
dpa_BS2 0.70 0.58 0.90 0.82 0.80 0.84 0.81 0.79 0.95 0.98 0.96 0.93
[0.64, 0.76] [0.50, 0.66] [0.88, 0.92] [0.78, 0.86] [0.75, 0.84] [0.80, 0.87] [0.77, 0.85] [0.74, 0.84] [0.93, 0.96] [0.97, 0.98] [0.95, 0.97] [0.91, 0.94]
The obtained results at first demonstrate a significant impact of the ND uncertainties on the dosimetry
calculations, especially at the distant BS locations (note that the present ND uncertainty estimations can
be significantly underestimated [17]). Secondly, they show that the reaction rates of NAGRA’s
dosimeters can be highly correlated with the BSs’ FNF and dpa calculation predictions, meaning that
2
The list of the most relevant isotopes treated by NUSS, in the MCNP ZAID format, included: 1001, 5011, 8016, 12024, 12025, 12026, 13027, 14028, 14029, 14030, 19041, 22046, 22047,
22048, 22049, 22050, 24050, 24052, 26054, 26056, 26057, 27059, 28058, 28060, 40090, 40091, 40092, 40094, 40096, 42092, 42094, 42095, 42096, 42097, 42098, 47109, 92235, 92238, 94239.
6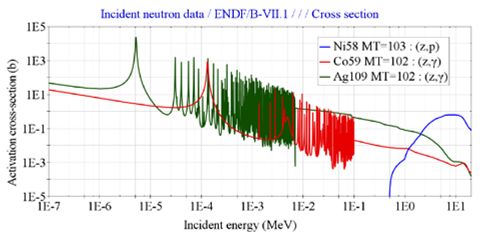
EPJ Web of Conferences 247, 10021 (2021)                                              https://doi.org/10.1051/epjconf/202124710021
PHYSOR2020

         NAGRA’s data is relevant for validation of not only the activation calculations, but also the FNF/dpa
         ones. At the same time, some combinations of the results on )_BS1_E>1MeV, )_BS2_E>1MeV,
         dpaBBS1, dpaBBS2 and the GP, ST dosimeters’ reaction rates also have relatively high correlations, which
         makes the GP and ST experimental data applicable for validation of the BS FNF and dpa calculations.
         One can also note that the GP and ST data is relatively highly correlated with the BS fluxes below
         0.1 MeV. Thus, the GP and ST experimental data potentially can also be appropriate for validation of the
         thermal neutron flux predictions in the BS concrete. To justify this proposition, a more detailed analysis
         with refined energy bins’ structure should be done. Note that the GP and ST locations correspond to the
         axial elevation of highest radiation doses, which are of major relevance for the BS activation studies.

                                                   7. CONCLUSIONS

         Apart from the problem of the RPV irradiation induced embrittlement, one of the concerns related to the
         extended reactor operation times is the behaviour of the (reinforced) concrete reactor structures, including
         those supporting the RPV, under high FNF (specifically -under low flux/long irradiation time) conditions
         [3]. Not only the lack of experimental data for the materials behaviour under extended radiation exposures
         complicates the situation, but also the accuracy of the calculation simulations needs revision since for the
         more distant than RPV ex-core locations, the calculation biases can be significantly amplified due to the
         complex radiation streaming paths and increased importance of the neutron scattering processes [17].
         Therefore, appropriate validation studies for the ex-vessel neutron transport simulations become an
         important task, in addition to the traditional RPV FNF assessments. The amount of high quality
         experimental data available for validation of the calculation methodologies and associated ND libraries is
         generally limited for majority of practical applications. This is also the case for such tasks as the reactor
         BS FNF, dpa and/or activation predictions. Therefore, different kinds of available measurements, even if
         originally designed for other purposes, shall be re-assessed from the viewpoint of their applicability for
         validation of, e.g., the above listed types of simulations.

         In the present work, the representativity of the available measured data for validation of the calculation
         parameters of interest was realised on the basis of the ND-related Pearson correlation coefficients
         assessment. The correlations between the calculation parameters (e.g., FNF) and measured data (specific
         activities) were analysed by applying the NUSS tool to randomly sample the ND used for the neutron
         transport simulations. Since the ND is one of the most important sources of uncertainties in the reactor
         dosimetry calculations, the obtained Pearson correlation coefficients can be considered as quantitative
         measures of similarity between the application type calculations and the validation studies, i.e. as a
         measure of representativity of the experimental data for the given application case.

         The obtained results indicate that for the validation of the PWR BS FNF or dpa assessments, both the
         experimental data obtained at NAGRA for the activation-oriented dosimeters, as well as the data
         originally obtained for the RPV FNF assessments and used for validation studies at PSI [9,14] are valid.
         Noting the limited amount of the dosimeters and the FNF monitors irradiated at different locations, one
         can actually conclude that the available sets of the experimental data should be complementing each
         other. For future works, it is proposed to extend the study by inclusion into analysis of publicly open
         OECD/NEA Sinbad benchmarks and to verify their applicability for validation of simulations of LWR
         concrete BS irradiation. As well, extension of the random calculations’ sample size and testing other ND
         libraries (ENDF/B-VIII.0 and JEFF-3.3) should be considered.

                                                 ACKNOWLEDGMENTS

         This work was partly supported by swissnuclear, the association of the Swiss nuclear power station
         operators, through the PSI/SN R&D project LRT-01 (2018-2019). The authors are grateful to the
         anonymous reviewers for their valuable suggestions.

                                                              7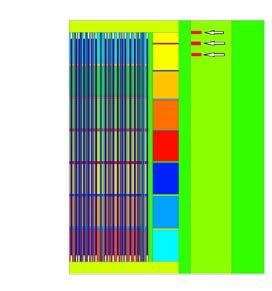
EPJ Web of Conferences 247, 10021 (2021)                                           https://doi.org/10.1051/epjconf/202124710021
PHYSOR2020

                                                    REFERENCES

         1. B. Volmert, M. Pantelias, R.K. Mutnuru, E. Neukaeter, and B. Bitterli, “Validation of MCNP NPP
             Activation Simulations for Decommissioning Studies by Analysis of NPP Neutron Activation Foil
             Measurement Campaigns,” EPJ Web of Conferences 106, 05010 (2016).
         2. V. Bykov, S. Mosher, B. Volmert, A. Scolaro, M. Pantelias, A. Pautz, “NAGRA Activation Analysis
             for the Optimization of NPP Decommissioning and Component Segmentation Strategy,” Proceedings
             of Int. Conf. PHYSOR 2018, Cancun, Mexico, April 22-26 (2018).
         3. I. Remec, T. M. Rosseel, K.G. Field & Y. Le Pape, “Radiation-Induced Degradation of Concrete in
             NPPs,” ASTM 16th International Symposium on Reactor Dosimetry (ISRD-16), Sante Fe, New
             Mexico, USA, 05.07.2017- 05.12.2017. doi:10.1520/STP160820170059 (2018).
         4. A. Vasiliev, D. Rochman, M. Pecchia, H. Ferroukhi, “On the options for incorporating nuclear data
             uncertainties in criticality safety assessments for LWR fuel,” Ann. Nucl. Energy 116, pp. 57–68
             (2018).
         5. B. Jung, “PWR structures activation forecasts using Monte Carlo neutron transport simulations,”
             Master Thesis, ETHZ/EPFL/PSI Master of Nuclear Engineering (2018).
         6. B. Jung, A. Vasiliev, M. Pecchia, H. Ferroukhi, “Optimization and sensitivity studies towards PWR
             structures activation characterization using the MCNP code,” ANS Students Conference 2018,
             University of Florida, Gainesville FL, USA, April 5-7, 2018 (2018).
         7. T. Zhu, A. Vasiliev, H. Ferroukhi, A. Pautz, “NUSS: A tool for propagating multigroup nuclear data
             covariances in pointwise ACE-formatted nuclear data using stochastic sampling method,” Ann. Nucl.
             Energy, 75, pp. 713-722 (2015).
         8. A. Vasiliev, D. Rochman, M. Pecchia, H. Ferroukhi, “Exploring Stochastic Sampling in Nuclear Data
             Uncertainties Assessment for Reactor Physics Applications and Validation Studies,” Energies 2016 (9,
             1039), pp. 1-18 (2016).
         9. A. Vasiliev, H. Ferroukhi, M.A. Zimmermann, R. Chawla, “Development of a CASMO-
             4/SIMULATE-3/MCNPX Calculation Scheme for PWR Fast Neutron Fluence Analysis and
             Validation against RPV Scraping Test Data,” Ann. Nucl. Energy 34(8), pp. 615-627 (2007).
         10. H. Ferroukhi, K. Hofer, J-M. Hollard, A. Vasiliev, M.A. Zimmermann, “Core Modelling and Analysis
             of the Swiss Nuclear Power Plants for Qualified R&D Applications,” Proceedings of Int. Conf.
             PHYSOR'08, Interlaken, Switzerland, September 14-19 (2008).
         11. M. Pecchia, J. J. Herrero, H. Ferroukhi, A. Vasiliev, S. Canepa, A. Pautz, “COMPLINK: A Versatile
             Tool for Automatizing the Representation of Material Data in MCNP Models,” Proceedings of Int.
             Conf. Nuclear Criticality Safety, ICNC 2015, Charlotte, NC, USA, September 13-17 (2015).
         12. D. Rochman, A. Vasiliev, H. Ferroukhi, T. Zhu, S.C. van der Marck, A.J. Koning, “Nuclear data
             uncertainty for criticality-safety: Monte Carlo vs. linear perturbation,” Ann. Nucl. Energy, 92, pp.
             150-160 (2016).
         13. A. Vasiliev, H. Ferroukhi, T. Zhu, A. Pautz, “Nuclear Data Library Effects on Fast to Thermal Flux
             Shapes around PWR Control Rod Tips,” Nuclear Data Sheets 118, pp. 575-578 (2014).
         14. A. Dupré, A. Vasiliev, H. Ferroukhi, A. Pautz, “Towards modeling and validation enhancements of the
             PSI MCNPX fast neutron fluence computational scheme based on recent PWR experimental data,”
             Ann. Nucl. Energy 85, pp. 820–829 (2015).
         15. A. Vasiliev, H. Ferroukhi, E. Kolbe, M.A. Zimmermann, “On the use of importance factors from
             Monte Carlo calculations for efficient fast neutron fluence prediction,” Proceedings of Int. Conf.
             PHYSOR'08, Interlaken, Switzerland, September 14-19 (2008).
         16. M. Pecchia, A. Vasiliev, H. Ferroukhi, A. Pautz, “A methodology for evaluating weighting functions
             using MCNP and its application to PWR ex-core analyses,” Ann. Nucl. Energy 105 pp. 121-132
             (2017).
         17. A. Vasiliev, D. Rochman, M. Pecchia, H. Ferroukhi, “On the Importance of the Neutron Scattering
             Angular Distributions for the LWR Fast Neutron Dosimetry,” Proceedings of Int. Conf.
             PHYSOR 2018, Cancun, Mexico, April 22-26 (2018).

                                                            8
You can also read