P5.14 ADVANCED TORNADO DETECTION ALGORITHM USING SUPER-RESOLUTION AND POLARIMETRIC DATA
←
→
Page content transcription
If your browser does not render page correctly, please read the page content below
P5.14         ADVANCED TORNADO DETECTION ALGORITHM USING SUPER-RESOLUTION
                              AND POLARIMETRIC DATA

                                        Yadong Wang1 ,2 ,∗ and Tian-You Yu1 ,2
        1
            School of Electrical and Computer Engineering, University of Oklahoma, Norman, Oklahoma, USA
               2
                 Atmospheric Radar Research Center, University of Oklahoma, Norman, Oklahoma, USA

1. INTRODUCTION                                                   ative) differential reflectivity (ZDR ) were first observed
                                                                  by Ryzhkov et al. [2005] using a S-band research polari-
The hook shape reflectivity feature has been docu-                metric radar. Kumjian and Ryzhkov [2008] and Bluestein
mented as an indicator of tornadoes [Fujita, 1958], how-          et al. [2006] further identified TDS during tornadic super-
ever more than half of the tornadoes have been reported           cell storms using a S-band and a mobile X-band dual-
not associated with apparent hook signature. Tornado              polarization Doppler radar. The polarimetric upgrade
vortex signature (TVS) defined as the azimuthal velocity          of the WSR-88D network, supported by the National
difference at a constant range is a parameter to quantify         Weather Service (NWS), the Federal Aviation Adminis-
the tornado feature based on pulsed Doppler radar ob-             tration (FAA) and Air Force Weather Agency is undergo-
servation [Burgess et al., 1975]. The basic idea of the           ing. With the polarimetric capability, the TDS can be in-
current tornado detection algorithm (TDA) is to search            corporated into WSR-88D developing tornado detection
for strong and localized azimuthal shear in the field of          algorithm. In this work, an advanced tornado detection
mean radial velocities [e.g., Crum and Alberty, 1993;             algorithm using super-resolution and polarimetric data
Mitchell et al., 1998]. However, because of the smooth-           is proposed. The neuro-fuzzy framework is adopted by
ing effect caused by the radar resolution volume, the             this advanced tornado detection algorithm, and the in-
shear signature can be significantly degraded if the size         puts parameters and rule inference are further modi-
of tornado is small and/or the tornado is located at far          fied. The performance of proposed algorithm is demon-
ranges [Brown and Lemon, 1976]. Recently, a neuro-                strated using abundant real tornado cases. This paper
fuzzy tornado detection algorithm (NFTDA) has been                is organized as follows. An overview of the upgraded
developed by Wang et al. [2008] within atmospheric                NFTDA in section 2. The performance of the advanced
radar research center (ARRC) of the university of Ok-             NFTDA using legacy-, super-resolution and polarimetric
lahoma. Tornado shear signature and tornado spectral              data are evaluated in section 3. Finally, a summary and
signatures (TSS) are combined in this algorithm, and              conclusions are given in section 4.
the performance shows significant improvement. Con-
ventionally, Weather Surveillance Radar-1988 Doppler
(WSR-88D) provides legacy resolution with reflectivity            2. UPGRADED NEURO-FUZZY TORNADO DETEC-
data on a 1 km-by-1 o polar grid and Doppler data (radial            TION ALGORITHM
velocity and spectrum width) on a 250 m-by-1 o grid. Su-
per resolution proposed to be adopted by the WSR-88D              2.1. Review of NFTDA
can provide reflectivity data and Doppler data on a 250
m-by-0.5o grid[e.g., Torres and Curtis, 2007]. The bene-          In the NFTDA developed by Wang et al. [2008], five
fit of super resolution data can be fully realized through        parameters of velocity difference (∆v ) spectrum width
finer range and azimuthal sampling in conjunction with            (σv ), spectral flatness (σs ), phase of the radially inte-
a narrower effective antenna pattern (i.e.,a smaller ef-          grated bispectrum (P ), and eigenratio (χR ) are inte-
fective beamwidth) [Brown et al., 2002; Torres and Cur-           grated by a fuzzy logic framework. Initially, the S-shape
tis, 2007]. Brown et al. [2002] have shown that tornado           and Z-shape membership functions were used to con-
hook and vortex signatures can be more pronounced                 vert the five crisp inputs into fuzzy membership degrees.
from super-resolution data. Tornado debris signatures             Subsequently, a rule strength was set by the maximum
(TDS) defined as high reflectivity (Z ), anomalously low          of the product of the input fuzzy variables. The mem-
cross-correlation coefficient (ρhv ) and very low (or neg-        bership functions were initialized based on the results
                                                                  of statistical analysis, and fine-tuned through a train-
   ∗ Corresponding author address: Yadong Wang, University
                                                                  ing process with a neural network. The performance of
of Oklahoma, School of Electrical and Computer Engineering,
University of Oklahoma, Norman, Oklahoma 73019; e-mail:           NFTDA was demonstrated using Level I data collected
wyd@ou.edu                                                        by the research WSR-88D (KOUN) operated by the Na-

                                                              1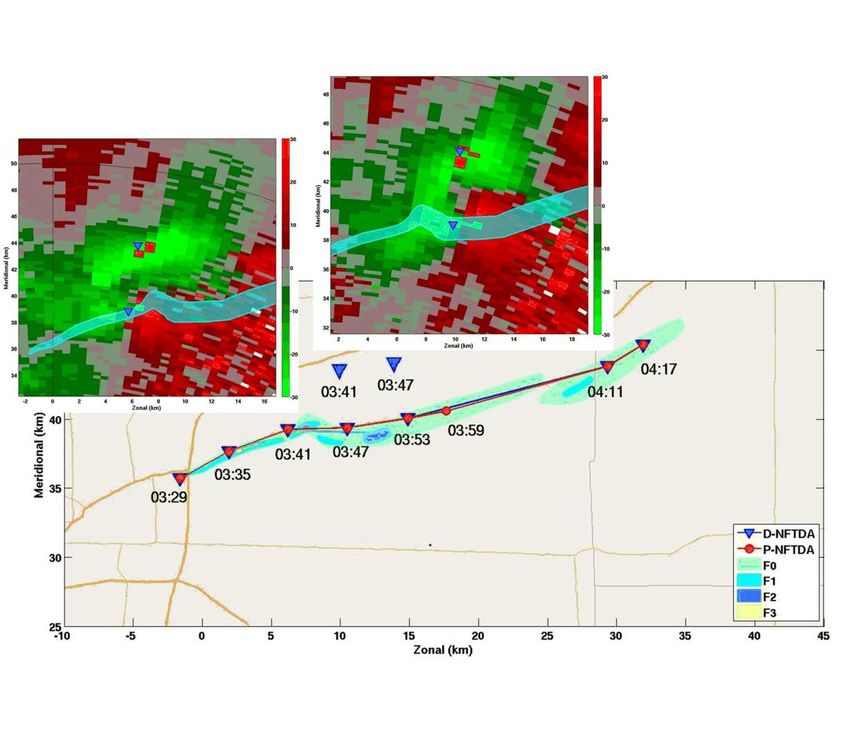
P5.14                                                                                                                     2

tional Severe Storms Laboratory (NSSL) during two tor-         thought of as “OR” and “AND” operation on those fuzzy
nadic events. These results show the performance of            inputs. Therefore when TDS or Doppler signatures are
conventional TDA can be improved significantly using           not existing simultaneously, using weighted average rule
NFTDA in term of probability of detection (POD), false         inference can still provide robust detection results, but
alarm ratio (FAR), critical success index (CSI), and max-      multiplication is likely failed under this situation.
imum detection range.
                                                               The output of NFTDA is a cluster of radar gates. Qual-
                                                               ity control (QC) procedure is implemented to eliminate
2.2. Doppler moment based NFTDA (D-NFTDA) and                  the cluster associated with nonvortex azimuthal shear,
     polarimetric moment based NFTDA (P-NFTDA)                 such as gust fronts. If the aspect ratio, defined as the
                                                               cluster’s radial extent over azimuthal extent, exceeds a
                                                               predefined threshold ( set as four in this work ), this clus-
Although the original NFTDA has shown enhanced de-
                                                               ter is discarded as an nonvortex cluster. The remained
tection, three input parameters of σs , P and χR are de-
                                                               clusters are assumed associated with tornadic vortex,
rived from level I time series data which are not avail-
                                                               and the center of cluster which is designated to be the
able for operational WSR-88D radar. In order to engage
                                                               tornado center needs to be determined. In this work,
with operational products with the provision of polarimet-
                                                               the subtractive clustering method (SCM), an extension
ric upgrade, the NFTDA has been modified to take in
                                                               of the mountain clustering method proposed by Yager
only Doppler moment data or polarimetric with Doppler
                                                               and Filev [1994] is used to finalize the vortex center.
moment data. Doppler moment data, specified as σv
                                                               Unlike other clustering method such as fuzzy c-means
and ∆v in this work, are the parameters incorporated
                                                               (FCM) technique, which finds the cluster center with pre-
into the Doppler moment based NFTDA (D-NFTDA).
                                                               defined cluster number, SCM can estimate the number
σv defined as second moments of a Doppler spectrum
                                                               of clusters and determine the clusters centers simulta-
[Doviak and Zrnić, 1993], can be estimated using the
                                                               neously. This advantage of SCM is especially important
periodogram method [Bringi and Chandrasekar, 2001],
                                                               when more than one tornado presents in a given data
or autocovariance method [Doviak and Zrnić, 1993]. ∆v
                                                               set. In SCM, each data point is initially assumed to be
is defined as velocity difference between two adjacent
                                                               a potential cluster center. Then a measurement of the
azimuthal gates. Since 99 % tornadoes in the northern
                                                               likelihood that each data point would define the cluster
hemisphere are cyclonic direction [Davies-jones, 1984],
                                                               center is calculated based on the density of surrounding
∆v is calculated using the radial velocity on higher az-
                                                               data points. The data with highest potential is set as the
imuthal angle minus the lower one in this work. The
                                                               first cluster center, and all the data points in the vicinity
TDS continently observed within tornadic storm can be a
                                                               (as determined by a predefined radii) of the first cluster
tornado indicator, especially when velocity and spectral
                                                               are removed. Iterating of this process until all of the data
signature is not obvious. The polarimetric with Doppler
                                                               is within radii of a cluster center.
moment based NFTDA (P-NFTDA) which incorporates
both TDS, σv and ∆v , has potential in decreasing the
FAR caused by velocity aliasing or nonvortex shear such
as squall line.                                                3. PERFORMANCE EVALUATIONS

                                                               In order to evaluate the performance of D-NFTDA,
2.3. Architecture of upgraded NFTDA                            a library of tornado events with both radar data
                                                               and tornado locations was established.         49 tor-
A schematic diagram is shown in Fig. 1 to demon-               nado events occurred during 1993 to 1999 for legacy
strate the working procedure of the upgraded NFTDA             resolution and 13 events during March 11th 2008
(including D-NFTDA and P-NFTDA). Three components              to September 30th 2008 for super resolution are
of fuzzification, rule inference and defuzzification consist   currently included in this tornado library.         The
the fuzzy logic system. In fuzzification, S shape and Z        number and time period of tornadoes are based
shape membership functions are applied to the input pa-        on the NCDC record (http://www4.ncdc.noaa.gov/cgi-
rameters as in [Wang et al., 2008]. Input xi can be spec-      win/wwcgi.dll?wwEvent Storms). All these tornadoes
ified as two ( σv and ∆V ) or four ( σv , ∆V , ZDR and         events are associated with: (1) the tornado’s life time
ρhv ) depending on the availability. Moreover, the input       is more than 3 minutes, (2) the quality of radar data
parameters can be in either Legacy or super resolution.        is sufficient and (3) all the tornadoes located within
Unlike the previous NFTDA, the rule inference has been         150 km from the radar as suggested by Mitchell
modified to use weighted average instead of multiplica-        et al. [1998]. The corresponding WSR-88D Level
tion. The weighted average and multiplication can be           II data were also obtained from the NCDC website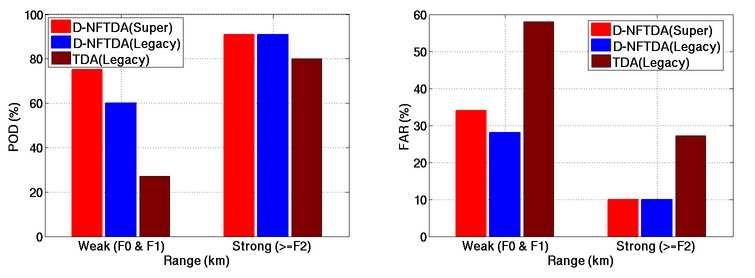
P5.14                                                                                                                 3

Figure 1: The schematic diagram of upgraded NFTDA. The framework is flexible enough to take in 2 or 4 parameters.
n = 2 represents D-NFTDA, where spectrum width (σv ) and velocity difference (∆V ) are two input parameters; n =
4 represents P-NFTDA, together with σv and ∆V , differential reflectivity (ZDR ), and cross correlation coefficient
(ρhv ) are the four inputs. A neural network is used to adjust the fuzzy logic membership functions, and the output of
the neuro-fuzzy system is cluster of radar gates. Those gates associated with non-vortex are eliminated by quality
control (QC), and the tornado center is determined using a subtractive clustering method (SCM).

(http://www.ncdc.noaa.gov/nexradinv/). Some of these         termining the locations. These locations were further
cases were also used for the evaluation of the opera-        adjusted by carefully examining the location of hook-
tional WSR-88D Tornadic Vortex Signature Detection al-       signature, strong azimuthal shear, and large spectrum
gorithm (TDA) developed by NSSL [Mitchell et al., 1998].     width. Similar methodology of adjustment in time and/or
In this work, the NSSL’s Warning Decision Support            location is also adopted by Mitchell et al. [1998] and Witt
System- Integrated Information (WDSSII) was used to          et al. [1998]. For each volume scan, a right detection
produce TDA results [Lakshmanan et al., 2007], which         defined as ”hit” is obtained when the detection is within
will be used to compare with NFTDA detection.                the close vicinity (< 1 km) of the tornado right location.
                                                             Other detections are defined as ”false”. In addition, a
                                                             missed detection is obtained if the tornado is present
3.1. D-NFTDA for legacy-resolution data                      but the algorithm produces no detection. To quantify
                                                             the performance, the time window scoring method de-
                                                             scribed in [Witt et al., 1998] was applied. Algorithms
The 49 tornado events are divided into two groups for
                                                             run within the time windows which starts from 15 min-
training and testing. The training groups is used to train
                                                             utes prior to the beginning time of the tornado to 5 min-
the membership functions and the testing group is used
                                                             utes after the ending time of each tornado [Witt et al.,
to assess the performance. Parameters implemented
                                                             1998]. The time, location, radar, volume number, hit,
in membership functions are initialized from statistical
                                                             miss, and false detection of each tornado events are
analysis, and further tuned with a neural network. Level
                                                             itemized in Table 2. The POD, FAR, are defined by
II moments data from 9 tornado events associated with
                                                             POD = a/(a + c), FAR = b/(a + b), , where a, b and c
21 volume scans are used in training the fuzzy logic
                                                             represent hit, false and miss, respectively.
membership functions. Various Fujita scales (F0 ∼ F3)
tornadoes from close range (0 ∼ 50 km), median range         The POD and FAR for D-NFTDA and NSSL’s TDA are
(50 ∼ 100 km) and far range (100 ∼ 150 km) are in-           shown in Fig. 2 for different Fujita scales. It is evi-
cluded In the training data set, and listed in Table 1.      dent that for weak tornadoes of F0-scale the D-NFTDA
                                                             shows significant improvement from conventional TDA
The location of a tornado associated with each radar
                                                             with much higher POD (from 6.7% to 47%) and lower
volume scan was determined from the ground damage
                                                             FAR (from 91% to 30%). Moreover, the D-NFTDA can
path when it is available. Otherwise, the tornado’s start-
                                                             extend the detection range of F0 tornadoes from 36 km
ing, ending locations and the width of ground damage
                                                             to approximately 60 km. For stronger tornadoes (F1-
obtained from the storm report are used in helping de-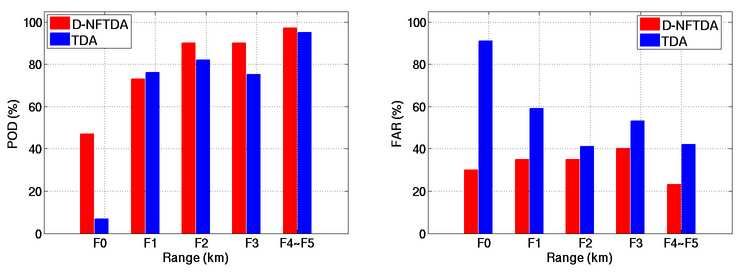
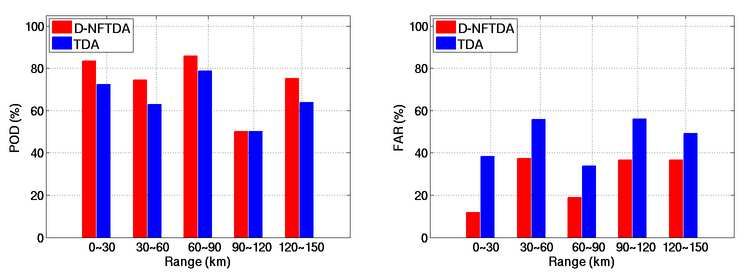
P5.14                                                                                                               4

Figure 2: Statistical performance of POD (left) and FAR (right). The results are from 49 tornado events. The detection
results of D-NFTDA are indicated by red bars, and the detections results of TDA generated by WDSSII are indicated
by blue bars. The abscissa is the intensity of tornado in Fujita Scale.

Figure 3: Similar as Fig. 2, but the abscissa is the distance from tornadoes to radars in very close range (0 ∼ 30
km), close range (30 ∼ 60 km), median range (60 ∼ 90 km), far range (90 ∼ 120 km) and very far range (120 ∼ 150
km).
P5.14                                                                                                               5

     Date         Radar             County, State           #Volume       Range (km)              Maximum EF-
                                                                                                  Scale
     04/15/94     KLSX              St.Louis, MO            2             0–50                    F0
     10/07/96     KTBW              Tampa Bay Area, FL      2             50–100                  F0
     03/24/98     KHNX              Hanford, CA             5             100–150                 F0
     01/21/90     KLZK              Little Rock, AR         4             0–50                    F2
     07/03/90     KAPX              Gaylord, MI             1             50–100                  F2
     02/23/98     KMLB              Melbourne, FL           1             100–150                 F2
     05/31/96     KABR              Aberdeen, SD            1             0–50                    F3
     05/17/95     KDDC              Dodge City, KS          2             50–100                  F3
     02/23/98     KMLB              Melbourne, FL           3             100-150                 F3

          Table 1: Tornado events used in the training of D-NFTDA parameters for legacy-resolution data.

F5), the D-NFTDA offers comparable or slightly higher       Due to the limitation of available cases, tornadoes with
PODs compared to TDA. It is worth of noting that D-         Fujita scale of F0 and F1 are referred as week tornadoes
NFTDA has significantly lower FAR. For example, for F4      and others are categorized as strong tornadoes. More-
and F5 tornadoes, both algorithms produce comparable        over, the NSSL’s WDSSII was used to simulate/convert
PODs of higher than 95%, but the NFTDA can more ef-         Doppler moments from super resolution to the legacy
fectively suppress false detection to produce of FAR of     resolution, which were then fed to the D-NFTDA and
23%, while the FAR of TDA is 42%. The performance           conventional TDA. The POD and FAR from the three ap-
of D-NFTDA and TDA are also compared for different          proaches are presented in Fig. 4 For the legacy resolu-
ranges, and the results are presented in Fig. 3.            tion, the D-NFTDA exhibits higher POD and lower FAR
                                                            than TDA, which is consistent with previous results. It is
Within the range of 150 km, D-NFTDA shows higher (or
                                                            interesting to note that for weak tornadoes the super-
comparable) POD (83% vs. 72% at 0∼30 km, 74% vs.
                                                            resolution D-NFTDA has enhanced POD of 75% and
62% at 30∼60 km, 85% vs. 78% at 60∼90 km, 50%
                                                            slightly decrease FAR of 33%, compared to the legacy
vs. 50% at 90∼120 km and 75% vs. 63% at 120∼150
                                                            D-NFTDA with POD of 60% and FAR of 28.3%.
km) and lower FAR than TDA (11% vs. 38% at 0∼30
km, 37% vs. 55% at 30∼60 km, 18% vs. 33% at 60∼90
km, 36% vs. 55% at 90∼120 km and 36% vs. 49% at                 3.3. P-NFTDA for legacy-resolution
120∼150 km).

                                                            An example is used to demonstrate the debris signa-
                                                            tures within a tornado in Fig. 5. A tornado is indicated
                                                            with a while circle, where apparent shear signatures,
3.2. D-NFTDA for super-resolution data                      high value of σv , low value of ZDR and ρhv can be ob-
                                                            served. Similar values of σv and ∆V can also be found
                                                            at approximately 4 km northeast of the circle. How-
In this work, the membership functions are retrained
                                                            ever, at the same location ZDR and ρhv show apparent
using super-resolution data, and the performance of
                                                            different value from the place associated with tornado.
super-resolution version D-NFTDA is evaluated. For the
                                                            TDS becomes particularly important when a radar’s am-
purpose of evaluation, 13 tornado cases associated with
                                                            biguous velocity is low, using C-band radar for example,
Fujita scale from EF0 to EF3 with super-resolution mo-
                                                            which can not provide obvious tornado velocity and/or
ments were initially identified out of 1470 tornado cases
                                                            spectral signatures. Since current WSR-88D radars are
achieved in the NCDC record from 11 March 2008 to
                                                            upgrading into polarimetric model, even the P-NFTDA is
30 September 2008. Tornado life duration(longer than 3
                                                            only tested on research prototype radar, it has the po-
minutes), distance to an available WSR-88D radar(less
                                                            tential to be implemented in future.
than 150 km) and data quality are the three criteria used
in the data selection. Radar data from two volume scans     To demonstrate the capability of TDS in facilitating tor-
on a F0 tornado case recorded by KFTG, and three vol-       nado detection especially in eliminating false detection,
ume scans on a F1 tornado case recorded by KDVN are         detection results from D-NFTDA and P-NFTDA on three
used in the training procedure. Tornado cases used in       tornadic events are compared, and the results are pre-
testing are listed in Table 3.                              sented in Fig. 6.
P5.14 6
Number Detection (NFTDA / TDA)
Date Radar County, State #Tornado #Volume Hit Miss False
05/31/96 KABR Aberdeen, SD 1 29 7/5 3/5 4/7
05/22/95 KAMA Amarillo, TX 1 10 1/2 0/1 0/1
07/03/99 KAPX Gaylord, MI 1 13 4/4 0/0 0/0
05/21/98 KCYS Cheyenne,WY 1 85 0/0 5/5 0/0
05/16/95 KDDC Dodge City, KS 1 71 3/3 0/0 3/3
05/27/97 KEWX Austin, TX 9 81 17/11 9/15 3/1
03/29/98 KFSD Sioux Falls, SD 2 87 25/9 0/16 1/4
05/07/95 KFWS Dallas/Fort, TX 2 41 12/8 5/9 3/1
05/12/95 KGLD Goodland, KS 3 72 12/12 0/0 1/2
11/16/93 KHGX Houston, TX 5 67 4/2 6/8 2/2
04/07/98 KILX Lincoln, IL 4 137 6/6 5/5 2/3
01/02/99 KLCH Lake Charles, LA 9 74 12/12 5/5 17/22
04/15/94 KLSX St. Louis, MO 2 49 3/2 6/7 3/9
05/28/96 KLVX Louisville, KY 2 33 13/13 1/1 4/10
03/29/98 KMPX Minneapolis, MN 2 36 15/15 3/3 9/20
01/29/98 KNKX San Diego, CA 1 12 0/0 5/5 0/0
04/03/99 KSHV Shreveport, LA 1 32 12/11 9/10 7/17
09/02/98 KTBW Tampa Bay, FL 2 45 5/4 8/9 1/0
Table 2: Tornado events used in the testing of D-NFTDA parameters for legacy-resolution data.
Number Detection (NFTDA / TDA)
Date Radar County, State #Tornado #Volume Hit Miss False
07/02/08 KDMX Des Moines, IA 1 25 3/3 6/6 3/3
07/10/08 KDVN Davenport, IA 2 14 7/0 7/14 8/2
08/24/08 KFTG Denver, CO 1 9 0/0 6/6 0/0
06/04/08 KIND Indianapolis, IN 2 14 8/6 2/4 6/10
07/14/08 KLNX North Platte, NE 2 14 4/0 8/12 0/0
08/02/08 KLWX Sterling, VA 2 14 4/0 8/12 0/0
05/08/03 KOUN Norman, OK 1 6 2/0 0/2 2/3
05/10/03 KOUN Norman, OK 3 12 9/5 0/4 2/3
Table 3: Tornado events used in the testing of D-NFTDA parameters for super-resolution data.
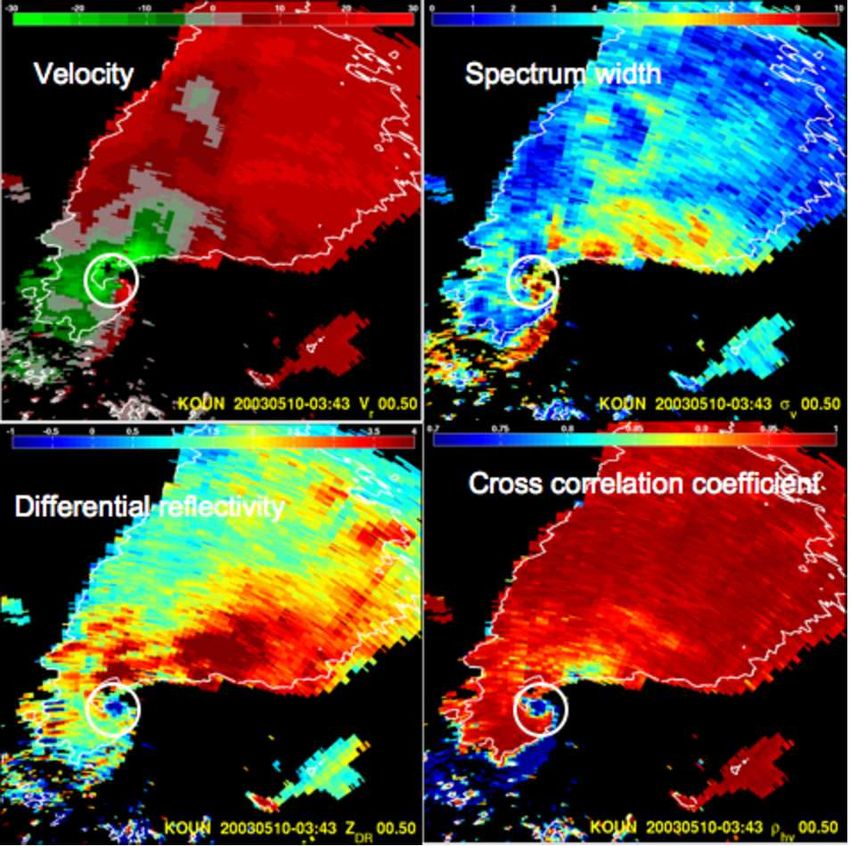
These three events occurred on center Oklahoma on 10 4. SUMMARY AND CONCLUSIONS
May 2003, and radar data are recorded using research
prototype polarimetric radar WSR-88D KOUN. Detail The enhanced detection capability of original NFTDA
damage path from ground survey is available which in- has been shown through simulation results and real
serted in Fig. 6 as one reference. Both D-NFTDA and cases analysis. However, three parameters σs , P and
P-NFTDA can detect the tornado all the time, except χR defined as tornado spectral signature (TSS), are de-
two false detections at 03:41 and 03:47 from D-NFTDA rived from level I time series data, which are not avail-
existing on the north of the damage path. The veloc- able for current operational WSR-88D radar. In order
ity at these two moments are presented in Fig. 6, from to engage with operational products and increase the
where obvious velocity aliasing can be observed. False commercial value of the algorithm, the NFTDA needs
detections come out if they are not/incorrectly dealias- to be modified to take in parameters available currently
ing. However, ρhv and ZDR does not show obvious low or in future. Advanced neuro-fuzzy tornado detection
value at these two locations, and no TDS can be identi- algorithm is developed in this work. Through the eval-
fied. Therefore, even large velocity difference and spec- uation on the real tornado events, the performance of
trum width can be observed, they still can be eliminated. this Advance tornado detection algorithm shows signif-
icant improvement. Even more, the performance usingP5.14 7
Figure 4: Similar as Fig. 2, but for super resolution data.
super-resolution data shows further improvement than WSR-88D data with enhanced resolution. J. Atmos.
legacy resolution data. With the incorporation of polari- Oceanic Technol., 19, 1759–1771.
metric data, false detections caused by nonvortex shear,
Burgess, D. W., L. R. Lemon, and R. A. Brown, 1975:
such as velocity aliasing can be eliminated.
Tornado characteristics revealed by doppler radar.
Geophys. Res. Lett., 183-184.
5. ACKNOWLEDGMENT Crum, T. D., and R. L. Alberty, 1993: The WSR-88D and
the WSR-88D operational support facility. Bull. Amer.
This work was supported by the Enterprise Electron- Meteor. Soc., 74, 1669–1687.
ics Corporation (EEC) and WSI Corporation under the
Davies-jones, R., 1984: Streamwise vorticity: the origin
project of advanced tornado detection. The authors
of updraft rotation in supercell storm. J. Atmos. Sci.,
would also like to thanks the NSSL staff for the collection
20, 2991–3006.
of Level I data.
Doviak, R. J., and D. S. Zrnić, 1993: Doppler Radar and
Weather Observations. Academic Press, San Diego,
References Calif., 130 pp.
Bluestein, H. B., M. M. French, and L. R. Tanamachi, Fujita, T., 1958: Mesoanalysis of the illinois tornadoes
2006: Close-range observations of tornadoes in su- of 9 April 1953. J. Atmos. Sci., 15, 288–296.
percells made with a dual-polarization, X-band, mo-
bile Doppler radar. Mon. Weather Rev., 135, 1522– Kumjian, M. R., and A. V. Ryzhkov, 2008: Polarimetric
1543. signatures in supercell thunderstorms. J. Appl. Mete-
orol., 47, 1940–1961.
Bringi, V. N., and V. Chandrasekar, 2001: Polarimetric
Doppler Weather Radar Principles and Applications. Lakshmanan, V., T. Smith, G. J. Stumpf, and K. Hondl,
Cambridge University Press, Cambridge, UK. 2007: The warning decision support system - inte-
grated information (WDSS-II). Wea. Forecasting, 22,
Brown, R. A., and L. R. Lemon, 1976: Single Doppler 592–608.
radar vortex recognition. part ii: Tornadic vortex sig-
natures. Prepr. Radar Meteor. Conf., 104-109. Mitchell, E. D., S. V. Vasiloff, G. J. Stumpf, A. Witt, M. D.
Eilts, J. T. Johnson, and K. W. Thomas, 1998: The
Brown, R. A., L. R. Lemon, and D. W. Burgess, 1978: National Severe Storms Laboratory tornado detection
Tornado detection by pulsed Doppler radar. Mon. algorithm. Wea. Forecasting, 13, 352–366.
Weather Rev., 106, 29–38.
Ryzhkov, A. V., T. J. Schuur, D. W. Burgess, and D. S.
Brown, R. A., V. T. Wood, and D. Sirmans, 2002: Im- Zrnic, 2005: Polarimetric tornado detection. J. Appl.
proved tornado detection using simulated and actual Meteorol., 44, 557–570.P5.14 8 Figure 5: The Doppler velocity (top left), σv (top right), ZDR (bottom left) and ρhv (bottom right). Tornado location is indicated by a white circle, and reflectivity with 30 dB is indicated using white contour.
P5.14                                                                                                           9

Figure 6: Comparisons of the detection results from D-NFTDA and P-NFTDA, which are denoted by blue triangles
and red circles respectively, for tornadoes on 10 May 2003.The detection of ”hit” from each approach is connected
by a solid line to show the time continuity. Ground damage path with Fujita scales are depicted by color-shaded
contours. The Doppler velocity plot at 03:41 and 03:47 are inserted. False detection at these two moments are 3, 4
km away from the damage path, respectively.
P5.14                                                        10

Torres, S. M., and C. D. Curtis, 2007: Initial imple-
  mentation of super-resolution data on the NEXRAD
  network. in 23th Conference on interactive infor-
  mation processing systems (IIPS) Ffor meteorology,
  oceanography, and hydrology. AMS.

Wang, Y., T.-Y. Yu, M. Yeary, A. Shapiro, S. Nemati,
 M. Foster, and J. D. L. Andra, 2008: Tornado detec-
 tion using a neurofuzzy system to integrate shear and
 spectral signatures. J. Atmos. Oceanic Technol., 25,
 1136–1148.

Witt, A., M. D. Eilts, G. J. Stumpf, E. D. Mitchell, J. T.
  Johnson, and K. W. Thomas, 1998: Evaluating the
  performance of WSR-88D severe storm detection al-
  gorithms. Wea. Forecasting, 13, 513–518.

Yager, R., and D. Filev, 1994: Generation of fuzzy rules
  by mountain clustering. J. Intelligent Fuzzy Sys., 2,
  209–219.
You can also read