Emissions from agriculture and forest land - Global, regional and country trends 1990-2019
←
→
Page content transcription
If your browser does not render page correctly, please read the page content below

ISSN 2709-0078 [Online]
                                      ISSN 2709-006X [Print]
       FAOSTAT ANALYTICAL BRIEF 25

Emissions from agriculture
     and forest land
Global, regional and country trends
              1990–2019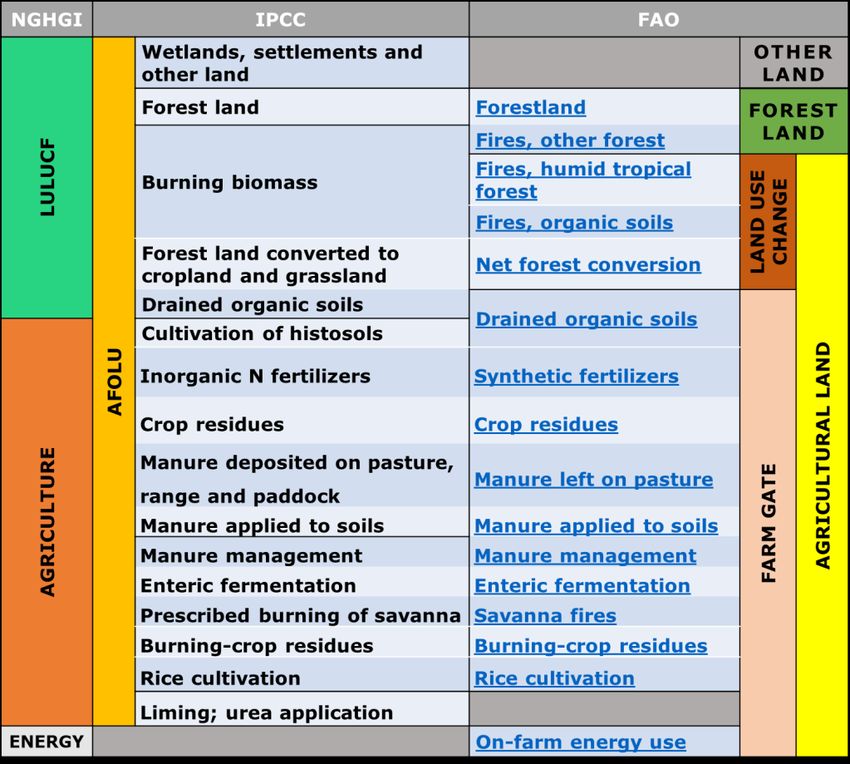
Emissions from agriculture and forest land. Global, regional and country trends 1990–2019
FAOSTAT Analytical Brief 25
HIGHLIGHTS
In 2019, global emissions from agriculture (farm gate and land use change processes) were
nearly 11 billion tonnes of CO2 equivalent (CO2eq), having remained largely constant for
the last 30 years, due to a balance of increasing emissions within the farm gate and
decreases from land use change.
Regional emissions in 2019 were the largest in Asia on an absolute basis (4 billion tonnes),
and in Oceania and Latin America on a per capita basis (4–6 tonnes/cap). The largest
increase since 1990 was in Africa (30 percent), while the largest decrease was in Latin
America (20 percent).
Brazil, Indonesia and China represented more than 50 percent of global emissions from
agriculture. Emissions from deforestation and from peat fires dominated the national
emissions from agriculture in Brazil and Indonesia, respectively, whereas farm-gate
emissions were the larger contributor in China.
Non-CO2 (methane and nitrous oxide) and CO2 emissions within the farm gate contributed
in 2019 more than 7 billion tonnes CO2eq, a 9 percent increase since 1990. Two-thirds of
the non-CO2 emissions were related to livestock.
Land use change added 3.5 billion tonnes CO2eq, mostly as CO2 from carbon losses via
deforestation and peatland fires. The former decreased by roughly 30 percent since 1990,
while the latter increased by nearly 60 percent.
Fossil fuel energy use within the farm gate emitted 0.5 billion tonnes CO2 in 2019, with a
significant decrease since 1990 of over 30 percent, largely due to a shift to electricity
generated off-farm.
Estimates of activity data and GHG emissions were disseminated for the first time together
with data officially reported by countries to the UN Framework Convention on Climate
Change (UNFCCC), to facilitate analysis and validation in line with the guidelines of the
Intergovernmental Panel on Climate Change (IPCC).
Estimates of activity data and GHG emissions were disseminated for
the first time alongside the data officially reported by countries to the
UN Framework Convention on Climate Change (UNFCCC), showing
close agreement. The comparison of FAO and UNFCCC data facilitates
FAOSTAT EMISSIONS FROM AGRICULTURE AND FOREST LAND
analysis and validation of national GHG inventory data, in line with the
latest provisions of the guidelines of the Intergovernmental Panel on
BACKGROUND
Climate Change (IPCC).
is a significant contributor to climate change, in addition to being one of the economic sectors
Agriculture
most at risk from it. Greenhouse gas (GHG) emissions due to agriculture are generated both within the
farm gate by crop and livestock production activities, and through land use change processes at the
conversion boundary between natural ecosystems and agricultural land. Together they contribute about
20 percent of total emissions from all human activities (IPCC, 2019a; Tubiello et al., 2021).
The FAOSTAT Emissions database provides estimates at the country, regional and global levels,
including methane (CH4) and nitrous oxide (N2O) emissions from crop and livestock production, as well
as carbon dioxide (CO2) emissions and removals from land use, land use change and fossil fuel energy
use. This analytical brief extends previous FAO analyses to the period 1990–2019, mapping relevantemissions within and across the farm-gate/land use production boundaries. The new mapping provided is useful to compare the Food and Agriculture Organization of the United Nations (FAO) estimates to the country data officially reported to the United Nations Framework Convention on Climate Change (UNFCCC) under the ‘’agriculture’’ and ‘’land use, land use change and forestry (LULUCF)’’ sectors of national GHG inventories. To this end, the 2021 FAOSTAT update allows for the first time to visualize jointly FAO and UNFCCC data, the latter sourced from the most recently available greenhouse gas national inventories (NGHGI), national communications and biennial update reports (BURs). The IPCC (2019b) guidelines, which regulate country reporting to the UNFCCC, already promote the use of FAOSTAT emissions data for quality assurance/quality control (QA/QC) and validation processes in support of NGHGI development. Furthermore, a recent meeting of UNFCCC Annex I Lead Reviewers highlighted the “usefulness of the [FAO] data sources for supporting GHG inventory reviews, and requested the secretariat to explore ways of incorporating the FAO data resources as an authoritative supporting data source for reviews in the 2021 cycle and beyond.” In the following analyses, emissions from agriculture are divided into emissions generated within the farm gate and those generated at the land use change boundary between farms and natural ecosystems. The same are mapped to categories used for UNFCCC reporting of NGHGI and IPCC categories, with a mapping provided in the explanatory notes section of this report (see Figure 13). RESULTS: GLOBAL TRENDS, 1990-2019 In 2019, total emissions from agriculture, i.e. generated within the farm gate and at the farm boundary with natural ecosystems, were 10.7 billion tonnes of carbon dioxide equivalent (Gt CO2eq). These emissions remained fairly constant over the entire 1990–2019 period, with no statistically significant trend (Figure 1), considering that the underlying data uncertainty is around 30 percent1 (Tubiello et al., 2013). Emissions generated within the farm gate and those associated to land use change were nonetheless characterized by opposite trends, which tended to cancel each other out. Specifically, the former increased by about 10 percent over the period 1990–2019, from 6.6 to 7.2 Gt CO2eq, while the latter decreased by 25 percent, from 4.7 to 3.5 Gt CO2eq. Whereas total emissions from agriculture remained virtually unchanged over the last 30 years, they decreased on a per capita basis, by nearly 35 percent, from 2.1 to 1.4 t CO2eq per capita, as a result of improvements in the efficiency of agricultural production processes and of reductions in land conversions, especially deforestation (Figure 2). 1Overall uncertainty stems from uncertainties in both the activity data and in the emissions factors coefficients applied for the emissions estimates.
Emissions from agriculture and forest land. Global, regional and country trends 1990–2019

FAOSTAT Analytical Brief 25

                    Figure 1. Global absolute and per capita emissions from agriculture, detailing farm-gate and
                                             land use change components, 1990–2019

                              12                                                                                                  2.4

                              10                                                                                                  2.0

                                                                                                                                         t CO2eq per capita
                               8                                                                                                  1.6
                   Gt CO2eq

                               6                                                                                                  1.2

                               4                                                                                                  0.8

                               2                                                                                                  0.4

                               0                                                                                                  0.0
                                   1990          1995           2000            2005            2010         2015
                                                        Farm gate             Land use change           Per capita

             Source: FAOSTAT, 2021.

                  Figure 2. Emissions in absolute and per capita levels from agriculture, by Annex I (developed
                           countries, according to the UN Climate Convention) and Non-Annex I countries
                                                       (developing)2 1990–2019

                                                                                                                      of which 63% in Farm
                              10
                                                                                                                              gate

                                                                                                                                   2.0
                               8

                                                                                                                                   1.5
                               6                                                                                                          t CO2eq per capita
                 Gt CO2eq

                               4                                                                                                   1.0

                               2                                                                                                   0.5
                                                                                                        of which 88% in
                                                                                                           Farm gate
                               0                                                                                                   0.0
                                   1990          1995            2000            2005           2010          2015
                                   Annex I – Emissions on agricultural land                Non-Annex I – Emissions on agricultural land
                                   Annex I – Per capita emissions                          Non-Annex I – Per capita emissions

             Source: FAOSTAT, 2021.

             2   The list of the type of parties reporting to the UN Climate Convention is available at
             https://unfccc.int/process/parties-non-party-stakeholders/parties-convention-and-observer-states.
             For corresponding FAOSTAT area codes, please see the tab ‘Country Group’ in the FAOSTAT Definitions and
             Standards http://www.fao.org/faostat/en/#definitions.
Of the 7.2 Gt CO2eq generated within the farm gate in 2019, methane (CH4) emissions from enteric fermentation in digestive systems of ruminant livestock were the largest contributor (2.8 Gt CO2eq), followed by emissions from the use of fertilizers on agricultural soils. The latter were in the form of nitrous oxide (N2O) emissions, totalling 1.5 Gt CO2eq arising from applications of livestock manure (0.9 Gt CO2eq) – either left on pasture by grazing animals or used as organic fertilizer – and of synthetic fertilizers (0.6 Gt CO2eq). The third most important process was the drainage of organic soils and peatlands (Conchedda and Tubiello, 2020), generating 0.8 Gt CO2eq in 2019, largely as CO2 gas, followed by methane emissions from rice (0.6 Gt CO2eq) and CO2 emissions from fossil fuel energy use (0.5 Gt CO2eq) for farm operations (Figure 3). Forest conversion (a proxy for deforestation) generated 2.9 of the 3.5 Gt CO2eq emissions from land use change (Figure 3). Fires in tropical peatlands in South-eastern Asia, part of a cycle of drainage and deforestation processes, were the second largest source of land use change emissions (0.4 Gt CO2eq) in 2019. Overall, the new estimates show that enteric fermentation and net forest conversion alone, each emitting about 3 Gt CO2eq in 2019, represented more than 50 percent of all emissions on agricultural land. Together with emissions from fertilizers and drained organic soils, these four components emitted over three-quarters of the total emissions on agricultural land. While agriculture generated net emissions into the atmosphere, forest land instead generated net removals in 2019 and in general over the entire 1990–2019 study period (see also: Tubiello et al., 2021). Specifically, removals on forest land were about 2.9 Gt CO2eq in 2019, nearly counterbalancing emissions from net forest conversion. At the same time, fires in other forests added a relatively small amount of non-CO2 emissions, in the order of 0.2 Gt CO2eq in 2019. Of the emissions components discussed above, nitrogen-related emissions from synthetic fertilizers and crop residues showed the largest growth since 1990 (+44 and +42 percent respectively), reflecting growth in crop production over the same period. At the same time, emissions from deforestation saw significant decline (-31 percent), in connection with more stringent regulation in key countries. In terms of land use change, emissions from fires in organic soils increased strongly (+31 percent), reflecting the ongoing conversion of these natural ecosystems to agriculture, especially in South-eastern Asia. Results also indicate that removals of CO2 by forests, i.e. their sink strength in partially counterbalancing emissions, decreased significantly in the past 30 years, by 24 percent, albeit forests remain an overall carbon sink today (Figure 3).
Emissions from agriculture and forest land. Global, regional and country trends 1990–2019

FAOSTAT Analytical Brief 25

              Figure 3. Emissions from agriculture and forest land for the year 2019, by component. Percent
                  values represent changes with respect to reference emissions levels in 1990 (except for
                                                  energy use, set to 1992)

             Source: FAOSTAT, 2021.

             REGIONAL

             The global trends discussed above mask significant differences among regions (Figure 4).
             First, results show that in the last decade 2010–2019, global emissions from agriculture were dominated
             by Asia (4 Gt CO2eq), followed by Latin America (comprising of Central and South America) and Africa
             (2.3 Gt CO2eq each), Europe (0.9), Northern America (0.7) and Oceania (0.3).
             By comparing the most recent decade to the early 1990s, in Asia and North America total emissions
             from agriculture have remained rather stable over the last 30 years. Conversely, and while showing
             similar values in the most recent decade, emissions in Africa increased by a significant 30 percent since
             the 1990s, while they decreased in Latin America by more than 20 percent – the latter largely in relation
             to well-documented decreases in deforestation particularly in South America (FAO, 2020).
             The most significant decreases in emissions over the study period were computed for Europe
             (-25 percent), linked to reductions of farm-gate emissions, and Oceania (-15 percent).
Figure 4. Trends in regional emissions from agriculture (1990, 2000, 2019)
4
10
8
Gt CO₂eq
3 6
4
2
Gt CO₂eq
2 0
World
1
0
Africa Northern Latin America Asia Europe Oceania
America 1990 2000 2019
Source: FAOSTAT, 2021.
Furthermore, farm-gate production and land use change processes contributed differently to total
emissions in the regions analysed (Figure 5). In 2019, emissions within the farm gate contributed more
than two-thirds of the agriculture total in Oceania (78 percent), Europe (74 percent), North America
(67 percent) and Asia (67 percent). Emissions from land use change processes were conversely the
largest contributor of emissions from agriculture in Africa (55 percent) whereas farm-gate and land use
change emissions contributed equally in Latin America.
In 2019, global per capita emissions due to agriculture averaged 1.4 t CO2eq per person, down nearly
35 percent from 2.1 t CO2eq per capita in 1990. Per capita emissions varied significantly across regions,
although they declined consistently over time (Figures 5 and 6). Per capita emissions in Latin America
and Oceania, at 3.8 and 5.6 t CO2eq per capita respectively in 2019, were two and three times the world
average, despite having both more than halved from 1990 values. Per capita values for North America
and Africa (1.6–1.7 t CO2eq per capita) were slightly higher than the global average and remarkably
similar, with no significant trend over the period 1990–2019. The same similarity and lack of trends
characterized per capita emissions in Europe and Asia, albeit with values about half of the global
average (0.7–0.9 t CO2eq per capita).Emissions from agriculture and forest land. Global, regional and country trends 1990–2019
FAOSTAT Analytical Brief 25
Figure 5. Regional per capita emissions from agriculture, detailing farm-gate and land use
change components, 2019
6
5
4
t CO2eq per capita
3
2
1
0
Africa Northern Latin America Asia Europe Oceania
America
Farm gate Land use change
Source: FAOSTAT, 2021.
Figure 6. Trends in regional per capita emissions from agriculture, 1990–2019
14
12
10
t CO₂eq per capita
8
6
4
2
0
1990 1995 2000 2005 2010 2015
Africa Northern America Latin America Asia Europe Oceania
Source: FAOSTAT, 2021.COUNTRY
The list of the top ten emitters from agriculture naturally correlates with countries characterized by a
large area and population (Figure 7). In 2019, Brazil, Indonesia and China represented more than
50 percent of world emissions from agriculture. The first two countries emitted each nearly 1 billion
tonnes of CO2eq. China and India had the largest emissions from within the farm gate (nearly
800 million tonnes of CO2eq each) while Brazil, Indonesia and the Democratic Republic of the Congo
had the largest contributions from land use change. A different set of countries, however, dominated per
capita emissions (Figure 8), with values ranging between 8–20 tonnes CO2eq/capita, i.e. 6 to 15 times
the world average in 2019. Among these, the highest per capita emissions were generated in countries
with small populations and high levels of land use change emissions. Conversely, high per capita
emissions values computed in New Zealand and Mongolia (around 10 tonnes CO2eq/capita) were
largely related to livestock activities.
Figure 7. Top ten countries by emissions from agriculture, including farm gate and land use
change components, 2019
Mt CO2eq yr-1
400 800 1,200
Brazil
53% Global
emissions on Indonesia
Agricultural land
China
India
Farm gate
Democratic Republic of the Congo
Land use change
United States of America
Pakistan
Argentina
Myanmar
Canada
Source: FAOSTAT, 2021.Emissions from agriculture and forest land. Global, regional and country trends 1990–2019
FAOSTAT Analytical Brief 25
Figure 8. Top ten countries by per capita emissions from agriculture, with farm gate and land
use change components, 2019
Guyana
Botswana
Suriname
Belize
Paraguay
Mongolia
New Zealand
Bolivia (Plurinational State of)
Central African Republic
Faroe Islands
0 4 8 12 16 20 24
t CO2eq per capita
Farm gate Land use change
Source: FAOSTAT, 2021.
COMPARISON TO UNFCCC DATA
The FAOSTAT emissions estimates were compared for the first time to data officially reported by
countries to the UNFCCC, using the most recently available NGHGI, national communications or BURs.
At the time of writing, data reported to UNFCCC were available up to 2018.
FAO emissions estimates and underlying activity data can be compared to official country data submitted
to the UNFCCC for main categories ‘’IPCC Agriculture’’ and ‘’Forestland’’, as well as for their sub-
domains (see mapping table in Explanatory Notes, Figure 13). In particular, ‘’IPCC Agriculture’’, which
is available as an aggregate in the FAOSTAT Emissions Totals domain, includes the non-CO2 emissions
generated from crop and livestock production activities covered by the IPCC (2006) guidelines. “Farm
gate” emissions, also available as an aggregate in the FAOSTAT Emissions Totals, include in addition
CO2 emissions from drained organic soils, as well as CO2 and non-CO2 emissions from on-farm energy
use. In the same vein, the category ‘’Forestland’’ corresponds to carbon emissions/removals on forest
land (FAO, 2020 and Tubiello et al., 2021). While the database offers the possibility to compare activity
data and emissions by country, we provide here for simplicity comparisons across the relevant aggregate
of Annex I parties to UNFCCC, composed largely of Organisation for Economic Co-operation and
Development (OECD) developed economies. Such comparisons are facilitated by the fact that UNFCCC
data for this group are complete, considering that Annex I countries are required to report their emissions
annually through national GHG inventories. For this group of countries there is close alignment between
the FAO estimates and UNFCCC data, for both IPCC Agriculture and forestland emissions categories,
over the entire available time series (Figure 9).
Conversely, for the non-Annex I country group, which is composed largely of developing countries,
significant data gaps exist due to incomplete and less regularly submitted country reports. Thecomparison of the complete set of FAO estimates to available UNFCCC country data underscores such a situation, thus highlighting the complementary importance of the FAO information to better characterize regional and country trends (Figure 10). Detailed comparisons for Brazil (Figure 11) and China (Figure 12) help to further document the usefulness of FAO information with respect to existing country data, i.e. for use in a range of QA/QC processes, as suggested by the relevant section of the most recent IPCC (2019b) Guidelines and UNFCCC Lead Reviewers’ recommendations with regards to FAOSTAT.
Emissions from agriculture and forest land. Global, regional and country trends 1990–2019

FAOSTAT Analytical Brief 25

              Figure 9. Comparison of FAOSTAT estimates to UNFCCC data, aggregated by Annex I parties,
                                             over the period 1990–2019

                                   2

                                   1

                                   0
                        Gt CO2eq

                                   -1

                                   -2

                                   -3
                                     1990       1995       2000           2005         2010            2015          2020

                               FAO, IPCC Agriculture   FAO, Forest land     UNFCCC, IPCC Agriculture      UNFCCC, Forest land

             Source: FAOSTAT, 2021.

                 Figure 10. Comparison of FAOSTAT estimates to UNFCCC data, aggregated by Non-Annex I
                                             parties, over the period 1990–2019

                        5

                        4

                        3

                        2
             Gt CO2eq

                        1

                        0

                    -1

                    -2

                    -3
                      1990                    1995         2000            2005             2010              2015
                               FAO, IPCC Agriculture   FAO, Forest land     UNFCCC, IPCC Agriculture      UNFCCC, Forest land

             Source: FAOSTAT, 2021.
Figure 11. Country example (Brazil): Country reported data and correspondence with FAO
estimates
600
400
200
0
Mt CO2eq
-200
-400
-600
-800
1990 1995 2000 2005 2010 2015
FAO, IPCC Agriculture FAO, Forest land UNFCCC, IPCC Agriculture UNFCCC, Forest land
Source: FAOSTAT, 2021.
Figure 12. Country example (China): Country reported data and correspondence with FAO
estimates
1.5
1.0
0.5
Gt CO2eq
0.0
-0.5
-1.0
-1.5
1990 1995 2000 2005 2010 2015
FAO, IPCC Agriculture FAO, Forest land UNFCCC, IPCC Agriculture UNFCCC, Forest land
Source: FAOSTAT, 2021.Emissions from agriculture and forest land. Global, regional and country trends 1990–2019
FAOSTAT Analytical Brief 25
EXPLANATORY NOTES
The FAOSTAT emissions database is composed of several data domains covering the categories of the
IPCC Agriculture, Forestry and Other Land Use (AFOLU) sector of the NGHGI to the UNFCCC. Energy
use in agriculture is additionally included as relevant to emissions from agriculture and as an economic
production sector under the International Standard Industrial Classification of All Economic Activities
(ISIC A) statistical classification. We recognize however that, in terms of IPCC, these emissions are
instead part of the energy sector of the national GHG inventory. Specifically, as depicted schematically
in Figure 13, UNFCCC reporting categories of the NGHGI, corresponding to IPCC (2006) categories of
AFOLU and a set of detailed reporting categories, can be mapped to FAO land use classes of agricultural
land (comprised of cropland and permanent meadows and pastures), forest land and other land. In turn,
activities on cropland and permanent meadows and pastures can be largely comprised within the farm
gate, while activities representing conversion of (largely) forest land to agriculture can be mapped onto
land use change activities (on agricultural land), such as deforestation and peat fires (see also Tubiello
et al., 2021).
Non-CO2 emissions from agricultural activities – i.e. methane (CH4) and nitrous oxide (N2O) emissions –
as well as CO2 emissions from the single domains are all summarized in Emissions Totals. This newly
constructed domain disseminates emissions aggregates in CO 2eq, computed applying the Global
Warming Potential from the Fifth Assessment Report of the IPCC (IPCC, 2014).
FAO emissions estimates are available over the period 1961–2019 for agriculture production processes,
i.e. crop and livestock activities. The activity data underlying these emissions are based on country data
officially reported to FAO (for instance, livestock numbers, harvested area, fertilizers use in agriculture).
Projections to 2030 and 2050 are also available. They are computed with respect to the 2005–2007
baseline, following Alexandratos and Bruinsma (2012).
Land use and land use change emissions and removals are instead generally available only for the
period 1990–2019. The activity data for forests are collected from FAO Forest Resources Assessments
(FRA) in five-year cycles. Geospatial data complement existing national statistics and provide the source
of activity data for emissions on drained organic soils, savanna, forest fires and fires in organic soils.
These emissions estimates are currently available for the period 1990–2019. Finally, data on energy
use are available for the period 1990–2019.
For emissions from fires in organic soils, in line with existing literature, only the emissions from South-
eastern Asian countries (e.g. Indonesia, Malaysia and Brunei Darussalam) were considered
anthropogenic. Conversely, emissions estimates for the other countries and territories provided in
FAOSTAT were not considered anthropogenic, to reflect the lack of evidence to this end in existing
literature. As a result, although the emissions from fires in organic soils are disseminated for all the
countries and territories where these fires occur, the values from countries in the FAOSTAT regional
aggregate ‘South-eastern Asia’ only contribute to relevant thematic, regional and world total aggregates.Figure 13. Correspondence between NGHGI, IPCC, FAO Land Use and FAOSTAT emissions
categories
Source: FAOSTAT, 2021.Emissions from agriculture and forest land. Global, regional and country trends 1990–2019
FAOSTAT Analytical Brief 25
REFERENCES
Alexandratos, N. & Bruinsma, J. 2012. World agriculture towards 2030/2050: the 2012 revision. ESA
Working paper No. 12-03. Rome, FAO. Available at: http://www.fao.org/docrep/016/ap106e/ap106e.pdf
Conchedda, G. & Tubiello, F.N. 2020. Drainage of organic soils and GHG emissions: Validation with
country data. Earth System Science Data Discussions 2020, 1–47. https://doi.org/10.5194/essd-2020-
202
FAO. 2020. Forest land emissions and removals. Global, regional and country trends 1990–2020.
FAOSTAT Analytical Brief Series No. 12. Rome. http://www.fao.org/3/cb1578en/cb1578en.pdf
Flammini A., Pan X., Tubiello F.N., Yue Qiu S., Rocha Souza L., Quadrelli R., Bracco S., Benoit P.
and Sims R. 2021. Emissions of greenhouse gases from energy use in agriculture, forestry and
fisheries: 1990-2019. Submitted to Earth Systems Science Data.
IPCC. 1997. Revised 1996 IPCC Guidelines for National Greenhouse Gas Inventories. OECD. Paris.
Available at: http://www.ipcc-nggip.iges.or.jp/public/gl/invs1.html
IPCC. 2000. Good practice guidance and uncertainty management in national greenhouse gas
inventories. In: J. Penman et al. (Eds.), IPCC National Greenhouse Gas Inventories Programme,
Technical Support Unit, Hayama, Japan. Available at: http://www.ipcc-
nggip.iges.or.jp/public/gp/english/gpgaum_en.html
IPCC. 2002. Background Papers, IPCC Expert Meetings on Good Practice Guidance and Uncertainty
Management in National Greenhouse Gas Inventories. IPCC-NGGIP, p.399-417. Available at:
http://www.ipcc-nggip.iges.or.jp/public/gp/gpg-bgp.html
IPCC. 2006. 2006 IPCC Guidelines for National Greenhouse Gas Inventories, Prepared by the National
Greenhouse Gas Inventories Programme, Eggleston H.S., Buendia L., Miwa K., Ngara T. and Tanabe
K. (Eds), IGES, Hayama, Japan. Available at: http://www.ipcc-nggip.iges.or.jp/public/2006gl/index.html
IPCC. 2014. Fifth Assessment Report Climate Change 2014. GWP values.
https://www.ipcc.ch/pdf/assessmentreport/ar5/wg1/WG1AR5_Chapter08_FINAL.pdf
IPCC. 2019a. “Summary for Policymakers. In: Climate Change and Land: An IPCC Special Report on
Climate Change, Desertification, Land Degradation, Sustainable Land Management, Food Security,
and Greenhouse Gas Fluxes in Terrestrial Ecosystems [P.R. Shukla, J. Skea, E. Calvo Buendia, V.
Masson-Delmotte, H.- O. Pörtner, D. C. Roberts, P. Zhai, R. Slade, S. Connors, R. van Diemen, M.
Ferrat, E. Haughey, S. Luz, S. Neogi, M. Pathak, J. Petzold, J. Portugal Pereira, P. Vyas, E. Huntley,
K. Kissick, M. Belkacemi, J. Malley, (Eds.)]. In Press.” Intergovernmental Panel on Climate Change.
Available at: https://www.ipcc.ch/site/assets/uploads/sites/4/2019/12/02_Summary-for-
Policymakers_SPM.pdf.
IPCC. 2019b. 2019 Refinement to the 2006 IPCC Guidelines for National Greenhouse Gas Inventories.
Available at: https://www.ipcc.ch/report/2019-refinement-to-the-2006-ipcc-guidelines-for-national-
greenhouse-gas-inventories/.
Prosperi, P., Bloise, M., Tubiello, F.N., Conchedda, G., Rossi, S., Boschetti, L., Salvatore, M. &
Bernoux, M. 2020. New estimates of greenhouse gas emissions from biomass burning and peat fires
using MODIS Collection 6 burned areas. Climatic Change 1–18.Tubiello, F.N. 2019. Greenhouse Gas Emissions Due to Agriculture. In: Ferranti, P., Berry, E.M.,
Anderson, J.R. (Eds.), Encyclopedia of Food Security and Sustainability, vol. 1, pp. 196–205. Elsevier.
ISBN: 9780128126875
Tubiello, F. N., Conchedda, G., Wanner, N., Federici, S., Rossi, S. & Grassi, G. 2021. Carbon
Emissions and Removals from Forests: New Estimates, 1990–2020. Earth System Science Data 13 (4):
1681–1691. https://doi.org/10.5194/essd-13-1681-2021.
Tubiello, F. N., Rosenzweig, C., Conchedda, G., Karl, K., Gütschow, J., Xueyao, P., Obli-Laryea,
G., Wanner N., Yue Qiu S., De Barros J., Flammini A., Mencos-Contreras E., Souza L., Quadrelli
R., Halldórudóttir Heiðarsdóttir H., Benoit P., Hayek M. and Sandalow D. 2021. Greenhouse Gas
Emissions from Food Systems: Building the Evidence Base. Environmental Research Letters 16 (6):
065007. https://doi.org/10.1088/1748-9326/ac018e.
Wei, F., Wang, S., Fu, B., Brandt, M., Pan, N., Wang, C. & Fensholt, R. 2020. Nonlinear dynamics of
fires in Africa over recent decades controlled by precipitation. Global Change Biology.
This analytical brief was prepared by Francesco Nicola Tubiello, Giulia Conchedda and Griffiths Obli
Laryea. Data were produced and analysed by the authors. Xueyao Pan produced updated FAOSTAT on-
farm energy use data. All authors are staff of the Environment team, FAO Statistics Division.
Required citation: FAO. 2021. Emissions from agriculture and forest land. Global, regional and country
trends 1990–2019. FAOSTAT Analytical Brief Series No 25. Rome.
Cover photo: © FAO/Francesco N. Tubiello
CONTACTS
Statistics Division – Economic and Social Development
statistics@fao.org
www.fao.org/food-agriculture-statistics/en/
Food and Agriculture Organization of the United Nations
Rome, Italy
CB5293EN/1/06.21You can also read