UNDERSTANDING TV DATA - TAM Ireland
←
→
Page content transcription
If your browser does not render page correctly, please read the page content below
UNDERSTANDING TV DATA
CONTEN
                                                                                                                                           TS

           SOME ESSENTIAL TERMINOLOGY ...............................................................................3
           DEFINITION OF VIEWING ACTIVITY TYPES ..................................................................5
           DEFINITION OF KEY VIEWING STATISTICS ..................................................................6
           INTRODUCTION ..........................................................................................................9
           OVERVIEW ..................................................................................................................9
           ESTABLISHMENT SURVEY METHODOLOGY ................................................................ 10
           ESTABLISHMENT SURVEY RESULTS ............................................................................ 10
           RECEPTION CLASSIFICATION ...................................................................................... 11
           THE TELEVISION VIEWING PANEL ............................................................................... 12
           PANEL CONTROLS ....................................................................................................... 12
           WEIGHTING................................................................................................................. 13
           THE DAILY PROCESS .................................................................................................... 14
           SUMMARY OF DAILY PROCESS ................................................................................... 15

Copyright ©2017 The Nielsen Company                                      2                                             UNDERSTANDING TV DATA
SOME ESSENTIAL
TERMINOLOGY
TERM DESCRIPTION
Peoplemeter Electronic measurement system which monitors the channel that a TV set is tuned to and
the individuals present in the room while the TV set is switched on. Individual
demographics are measured through a complimentary specialised remote control. The
current Nielsen TV Audience Measurement peoplemeter is UNITAM.
Installed Panel Total panel sample comprising all TV homes equipped with peoplemeters to register TV
set status (i.e. which channel is being tuned to) and viewer presence. The panel is
designed and controlled to represent the population of television homes in the Republic
of Ireland.
In-tab Panel Homes that meet the quality control procedures and rules for inclusion in the daily
reported sample.
Census The Irish government Central Statistics Office (CSO) census is an exhaustive survey of all
households and individuals within those households, which takes place approximately
every five years. Characteristics measured in the census include age and gender of
individuals and size of household.
QNHS The Quarterly National Household Survey (QNHS) is a large-scale, nationwide survey of
households in Ireland, carried out by the CSO.
Universe or Target Refers to the total population of a particular audience category. Universes are based on
Audience television homes in Ireland (For example, Individuals = all persons aged 4 and-over who
live in a home with a working TV set and a standard reception type).
Cells When designing a sample, the universe of households and individuals is subdivided into
units based on a number of characteristics. Each mutually exclusive unit represents a
subsection of the universe and is referred to as a cell (e.g. males 4-6) .
Establishment Survey The Establishment Survey (ES) is a large scale face-to-face survey designed to define the
characteristics of the population to be represented, as well as providing a pool of
addresses from which potential homes for the panel are drawn.
Panel Control Demographic or other variables used for maintaining the representativeness of the panel
sample over time as homes leave the panel and are replaced by new panel homes. Panel
controls are based on characteristics which best explain TV viewing patterns (e.g.
reception type).
Copyright ©2017 The Nielsen Company 3 UNDERSTANDING TV DATASOME ESSENTIAL
TERMINOLOGY
TERM DESCRIPTION
Weighting Weighting of the daily data is performed along a similar selection of characteristics to
panel controls. A daily weight is assigned to each panel home and individual to ensure
the sum of weights over all characteristics match the universe figure derived from the ES.
All characteristics for which the Nielsen TAM panel are weighted are referred to as
weighting controls (e.g. if the ES National Adults 15+ universe for January 2017 is 3,352,
then the daily sum of weights for National Adults 15+ will be 3,352).
Iterative RIM Weighting Nielsen TAM use iterative Random Iterative Method (RIM) weighting, a method of
weighting that puts selected non-interlocking and grouped interlocking variables in
isolation through an iterative sequence of weighting adjustments. The sequence adjusts
for each RIM in turn and then repeats itself as many times as are required in order to
obtain convergence.
RIM Number and group that identifies the RIM weighting group to which the category
belongs.
Iteration A procedure in which repetition of a sequence of operations yields results successively
closer to a desired result.
Convergence Convergence is achieved when the sum of weights for each weighting cell is equal to the
universe estimate (within tolerance) within a limited number of iterations.
Weighted Data The weights applied to the Nielsen TAM panel for each day’s in-tab panel are multiplied
by viewing data minutes to form a processed figure used in reporting of TV viewing (e.g.
if the universes show that within households 12 % are women 15-34, a target is set in
the daily data production to ensure that no matter how many 15-34 women are in the
mix for that day, they amount to 12% of the total homes in the daily data).
Un-weighted Data An un-weighted viewing figure for a given day is the sum of viewing minutes over all
in-tab panel homes (i.e. an un-weighted viewing figure corresponds to the case where all
weights are set to equal 1).
Copyright ©2017 The Nielsen Company 4 UNDERSTANDING TV DATADEFINITION OF
VIEWING ACTIVITY TYPES
VARIABLE DESCRIPTION
Live Viewing to content watched live as it was broadcast
VOSDAL Viewing On Same Day As Live - Includes any time-shift viewing that took place within the
same day as the original broadcast
Live + VOSDAL Includes live viewing and time-shifted viewing that took place within the same day as the
original broadcast
Time-shift (TSV) Includes any viewing that takes place within 7 days (168 hours) of the original broadcast.
VOSDAL is included within the Time-Shift variable.
Time-shifted viewing has to be watched at normal speed in order to be included and
reported in the data, so if a viewer watches content in fast-forward mode, they are not
counted and they do not contribute to the reported viewing figures. Trick-mode activity
is also excluded (pause, rewind, fast-forward).
Time-shifted viewing is allocated back to the time of broadcast, rather than the time
when the content was viewed.
Time-shift includes viewing through a VCR, DVD, PVR, Games Console, Smart TV or any
other playback device. On-Demand content is included in Time-shift (VOD, Player) if the
content is matched back to content broadcast within the past 168 hours.
Consolidated Includes all viewing watched live or within 7 days of original broadcast (168 hours).
Playback The VOSDAL and time-shift activities allocate time-shifted viewing back to the original
broadcast, while the Playback activity reports time-shifted viewing levels linked to the
time at which the time-shift activity was happening.
As Consolidated is the agreed currency, only content viewed within 7 days of broadcast
is reported in time-shift.
Playback is a mode of viewing, and includes viewing to content matched within 28 days
of original broadcast (i.e. it is not linked to currency).
Copyright ©2017 The Nielsen Company 5 UNDERSTANDING TV DATADEFINITIONS OF KEY
VIEWING STATISTICS
VARIABLE DESCRIPTION
TVR The average of a target audience who have viewed a programme, day-part, spot or
minute expressed as a % of that target audience universe (e.g. an Adult TVR of 15 for a
programme indicates that on average 15% of all Adults available to watch TV at any
given time watched the programme). TVR figures are calculated minute-by-minute
across the programme duration, inclusive of the centre break. Similarly, break ratings
are calculated minute-by-minute across the duration of the break, while the spot rating
is based on the minute in which the spot aired.
000s The average target audience who have viewed a programme, day part, spot, minute, etc.
expressed in thousands. The 000s figure is linked to the TVR (e.g. an Adult TVR of 18 will
equate to a 000s figure of 603 - based on the National Adult universe of 3,352 January
2017)
Share This is the percentage of the viewing audience accounted for by a particular channel at a
specific point in time, i.e. of those people who are watching television, what proportion
are viewing channel X (e.g. an Adult Share of 30 for a programme indicates that of all
adults who were watching TV at the time, 30% of them watched the programme).
Reach % The percentage of the target audience who viewed for a defined period
(e.g. a 1+ reach % is the % of the audience who have viewed for at least 1 minute).
In all reports the default reach is set to 1+ consecutive minutes but this can be changed
to create other consecutive and non-consecutive reach criteria.
Reach 000s The total target audience who have viewed for a defined period.
(e.g. a 1+reach 000s is the total 000s who have viewed for at least 1 minute)
In all reports the default reach is set to 1+ consecutive minutes but this can be changed
to create other consecutive and non-consecutive reach criteria.
Reach % vs Reach 000s The % or 000s of a target audience who have viewed for a defined period
(e.g. Reach % is the % of the audience who have viewed for at least 1 minute).
Campaign R&F Indicates the Reach & Frequency of a campaign, showing the % of the target audience
1+ % … 10+ % who have seen at least one spot; at least two spots; at least three spots etc.
Commercial Impacts Indicates the total number of people within the target audience expressed in 000s who
have seen one or more spots of a campaign or on a channel. Each time a spot is viewed
it contributes to the total commercial impacts.
Profile The % of the base audience made up by your target audience (e.g. a profile of 23 for
Adults 15-34 means that 23% of your base audience were aged 15-34). The default base
audience for reports in Arianna is Individuals 4+.
Copyright ©2017 The Nielsen Company 6 UNDERSTANDING TV DATADEFINITIONS OF KEY
VIEWING STATISTICS
VARIABLE DESCRIPTION
Index A conversion figure between the base audience rating and the target audience rating,
allowing the user to compare audience performance for a spot / programme / day-part
(e.g. an index of 126 for Adults 15-34 against a base audience of Adults 15+, means 15-
34 performed 26% better than Adults 15+ for this time period)
AVE MIN/PN The average daily minutes viewed per person for the time period selected calculated
Average Minutes Per against the total universe of the target audience (e.g. Total TV average minutes per
Person person of 203 for Individuals, means Individuals in TV Homes watched an average of 203
minutes of TV per day).
AVE MIN/VW The average daily minutes viewed per person for the time period selected calculated
Average Minutes Per against only those viewing at the time (e.g. Total TV average minutes per viewer of 261
Viewer for Individuals, means Individuals who viewed TV during the time period selected,
viewed an average of 261 minutes per day).
Peak TVR Indicates the TVR for the highest-rating minute of a selected programme (e.g. a
programme may have achieved an average rating of 12 for the entire programme, but its
peak minute rating may have been 16).
Peak 000s Indicates the programme audience in 000s for the highest-rating minute (000s are linked
to the average TVR) e.g. a programme may have achieved an average of 366,000 adults -
TVR 12 - for the whole programme, but its peak minute 000s may have been 488,000 -
TVR 16.
Cumulative TVR Provides a build of ratings as each spot is added to a campaign. It is calculated based on
(CUM TVR) middle day panel and the figures are then adjusted (using NBD adjustment) to create the
ratings. These may differ from the individual spot ratings (calculated using panel on each
day) and should only be used as a guide to see how much each spot added to the ratings.
Cumulative 000s Provides a build of 000s as each spot is added to a campaign. It is calculated based on
(CUM 000s) middle-day sample and the figures are then adjusted (using NBD adjustment) to create
the ratings. These may differ from the individual spot 000s (calculated using panel on
each day) and should only be used as a guide to see how much each spot added to the
000s.
Average Frequency The average number of spots seen in a campaign.
1 + 000s Provides the total reach for a campaign, showing the total number of people for the
target audience in 000s who have seen one or more spots. This figure will build up as
spots are added.
Copyright ©2017 The Nielsen Company 7 UNDERSTANDING TV DATADEFINITIONS OF KEY
VIEWING STATISTICS
VARIABLE DESCRIPTION
30 SEC TVRs The ratings for all spots are totalled to provide a total TVR figure. In order to convert all
spots (10 sec, 20 sec, 30 sec, 60 sec etc.) to the same 30 second duration, a factor is
applied to each spot rating to produce 30 sec TVRs. This allows for like-with-like
comparison of ratings across channels.
30 SEC 000s The 000s for all spots are totalled to provide total commercial impacts. In order to
convert all spots (10 sec, 20 sec, 30 sec, 60 sec etc.) to the same 30 second duration, a
factor is applied to each spot 000s to produce 30 sec 000s. This allows for like-with-like
comparison of impacts across channels.
PIB Position in break a commercial spot occupied (indicates where each commercial spot
aired within the break)
% CUM Reach Shows the build up of reach across a number of programmes. The % reach will increase
as each programme adds new viewers. The default reach setting in Arianna is 1+ minutes
but this can be changed to create other reach criteria.
% New Viewer Shows the number of new viewers that the relevant programme has added to the overall
reach. This is calculated by subtracting the % cum reach figure for the programme from
the % CUM reach figure for the previous programme.
Cover Efficiency This gives an indication of the effectiveness of the particular spot in increasing cover. It is
calculated as follows:
Each respondent is allocated a weight, according to whether they saw this spot and this
spot only, this spot and one other spot, this spot and two other spots and so on...
NUMBER OF SPOTS SEEN WEIGHT
1 1.0
2 0.5
3 0.33
The sum of the weights is then divided by the number of respondents and multiplied by
100 to obtain the Cover Efficiency.
Copyright ©2017 The Nielsen Company 8 UNDERSTANDING TV DATAINTRODUCTION
Nielsen’s Television Audience Measurement Service (TAM) is the global industry
standard for quality data on television viewership worldwide.
Nielsen TAM employs advanced data collection methodologies and data measurement
science, to capture which channel is being watched, as well as who is watching and
when they are watching, inclusive of time-shifted viewing (TSV). TAM data is subject to
variable dynamics, which have implications for collecting, producing, reporting and for
the purposes here, understanding Nielsen data.
TH E P U R P OS E OF TH IS D OC U M E N T IS TO
PR O V I D E A N UN D E R S T A N D I N G O F T HE
BA S I C P R I N C I P L E S D R I V I NG T A M D A T A
QU A L I T Y .
OVERVIEW
The viewing data produced by Nielsen TAM is based on the television viewing behaviour
of 1, 050 panel homes. The Establishment Survey (ES), panel controls and weighting
determine the viewing panel composition and how viewing from panel homes is used to
determine ratings.
In the Republic of Ireland, each panel home represents approximately 1,500 TV
Homes1.
1 Based on January 2017 Nielsen TAM household universes and panel size
Copyright ©2017 The Nielsen Company 9 UNDERSTANDING TV DATAESTABLISHMENT SURVEY
METHODOLOGY
The TAM Establishment Survey Is a large-scale face-to-face survey designed to define the
characteristics of the TV population to be represented, as well as providing a pool of addresses
from which potential homes for the panel are drawn.
A total of 8,250 household surveys (8 times the panel size) are completed annually, with the sample
divided equally across two waves. The fieldwork is conducted from February to March and from
August to September with new universes introduced in January and July every year. The areas
covered by the questionnaire include ownership of TV-related equipment, method of TV reception
and demographics such as age and sex of individuals in the households questioned. The
questionnaire is modified each year to take account of new and growing technologies.
In order to correct for any non-response bias (e.g. a higher response rate among larger households
than smaller), the ES results are weighted to smoothed figures based on historical and recent
individual and household population estimates as published by the Central Statistics Office (CSO)
and Association of Irish Market Research Organisations (AIMRO) estimates for social class. The
individual-level database is also weighted by a number of characteristics (e.g. by age, by sex, by
region and size of household by region).
ESTABLISHMENT SURVEY
RESULTS
Once the Establishment Survey results are weighted, Nielsen TAM analyse the results and produce
the new household and individual universe estimates, which are introduced on 1st January and
1st July each year.
Targets for weighting and panel controls are directly derived from the ES and are updated following
each wave to ensure the population of television homes in Ireland is represented.
Copyright ©2017 The Nielsen Company 10 UNDERSTANDING TV DATARECEPTION
CLASSIFICATION
The Total TV universe includes all TV Homes by reception. Reception types are hierarchically
defined and mutually exclusive, based on the highest form of reception within television homes.
The hierarchy is based on channel line-up and availability within each household.
For example, Irish Digital Terrestrial (DTT) homes receiving up to ten Irish channels is the lowest
reception type, while Sky (receiving up to 600+ Irish and UK channels) is the highest reception type.
As the highest form of reception is considered, each household therefore has only one reception
type irrespective of the number of sets with different reception types within the home.
For example, a household with two sets, one with Irish DTT and another with Sky is included in the
Sky reception type.
THE CURRENT RECEPTION CLASSIFICATION AND HIERARCHY (FROM HIGHEST
TO LOWEST) IS AS FOLLOWS:
RECEPTION SUMMARY
1. Sky Homes with Sky as their highest form of television reception. A Sky home is currently
based on the possession of at least 1 Sky box with an active subscription. Sky subscribers
receive 600+ TV channels.
Sky homes may also have Cable; FTA Satellite; UK DTT or Irish DTT.
2. Cable Homes with either Cable or IPTV as their highest form of television reception. These
homes are mainly Virgin Media subscribing homes. Cable also includes homes where
IPTV (e.g. Eir / Vodafone) is the highest form of reception in the home. Cable homes
may also have FTA Satellite; UK DTT or Irish DTT.
3. FTA Satellite/WebTV Homes with Free-to-Air Satellite as the highest form of television reception (WebTV
homes are currently collapsed within FTA Satellite for panel controls & weighting). FTA
homes receive up to 400 FTA (or broadcast encrypted channels) via a satellite dish. FTA
homes may also have UK DTT or Irish DTT. WebTV homes have broadband1 and either a
Smart TV or peripheral2 attached to TV set.
4. UK DTT Homes which receive UK Freeview channels via an aerial (whether through a set-top box
or an integrated digital TV).
5. Irish DTT Homes which only receive any or all of the following Irish DTT channels:
RTÉ One, RTÉ One +1, RTÉ2, RTÉ News Now, RTÉjr, TV3, 3e, be3, TG4 and Oireachtas TV
via an aerial (whether through a set-top box or an integrated digital TV) or via Saorsat.
1 Broadband includes both fixed-line and mobile broadband
2 Peripheral devices include Games Console; PC/Laptop; Tablet; Google Chromecast; Apple TV; Roku Box or another Android device
Copyright ©2017 The Nielsen Company 11 UNDERSTANDING TV DATATHE TELEVISION
VIEWING PANEL
The Nielsen TAM peoplemeter panel is a household-based panel of 1,050+ installed homes, with
a daily minimum target of 945 reporting homes.
The panel is designed and controlled to represent the population of television homes in the
Republic of Ireland.
The ES respondents form a pool of potential recruits to the continuous viewing panel. Panel
recruitment is an on-going process designed to ensure that an adequate supply of different
household types are available to replace homes with similar characteristics who leave the TV panel.
Households are issued for recruitment on the basis of key household characteristics and the
current need for such homes.
PANEL CONTROLS
Panel controls represent a framework to monitor the panel profile to ensure the panel remains as
representative as possible. An effective panel control regime includes an optimal selection of TV
and demographic variables, which are estimated in our ES and coded on our panel. In keeping with
this, Primary controls (those which best explain Total TV viewing minutes) and Secondary controls
(used to ensure that the overall panel is correctly represented in other characteristics that affect
viewing, but may be less influential on Total TV viewing) are household-based while marginal
controls and Irish speaking controls are based on individuals.
Panel Management continuously review the status of the panel controls versus the current targets,
to ensure the panel fits within the controls deemed important for measuring TV viewing.
For more details on how the panel works, please watch our
video on the TAM Ireland website by clicking on the link
below:
The Panel
Copyright ©2017 The Nielsen Company 12 UNDERSTANDING TV DATAWEIGHTING
TV ratings data are produced from the viewing data collected from panel homes.
Weighting of the daily in-tab1 panel is performed to ensure robustness in the reported
viewing levels to changes in the day-to-day in-tab panel profile. The principle purposes of
panel controls and weighting are to ensure the panel is representative, while weighting can
also provide control for cells, particularly at an individual level, which due to small sample
sizes, could not reasonably be included as panel controls.
To ensure panel viewing data is representative of the viewing behaviour of all TV homes and
individuals, Nielsen TAM defines a series of demographic classifications (“controls”) and
weights the data to these.
The targets are based on ES universes and are determined to be those that correlate to TV
viewing, with all panel controls included as weighting controls at a household level, plus
additional targets at an individual level. Each home and individual panel member is assigned a
weight so that universe targets are reached for each control and therefore the proper
representation of all selected demographics is ensured. This process is completed every day
and each individual may receive different weights for each day that they are included in the
data.
FOR EXAMPLE, IF THE UNIVERSE INDICATES THAT WOMEN 15 - 34
REPRESENT 12% OF INDIVIDUALS 4 +, A TARGET IS SET IN THE DAILY DATA
PRODUCTION TO ENSURE THAT NO MATTER HOW MANY WOMEN 15 - 34 ARE
IN THE MIX FOR THAT DAY, THEY AMOUNT TO 12% OF TOTAL INDIVIDUAL S
4+ IN THE DAILY DATA .
For more details on weighting, please watch our video on the TAM Ireland
website by clicking on the link below:
Weighting and Audience Measurement
1 Homes which meet the quality control procedures and rules for inclusion in the daily reported sample
Copyright ©2017 The Nielsen Company 13 UNDERSTANDING TV DATATHE DAILY PROCESS
All eligible1 television sets in panel homes with a standard reception type are monitored by the
Nielsen TAM UNITAM peoplemeter, where all household residents and any guests aged 4+ register
their presence using a bespoke remote control.
The UNITAM meters are capable of measuring up to 11 Individuals and 16 guests viewing in each
home. Each UNITAM meter has a remote control handset, on which all household members have a
dedicated button and are registered by UNITAM accordingly. Guests follow a simple log on
procedure indicating sex and age for further analysis.
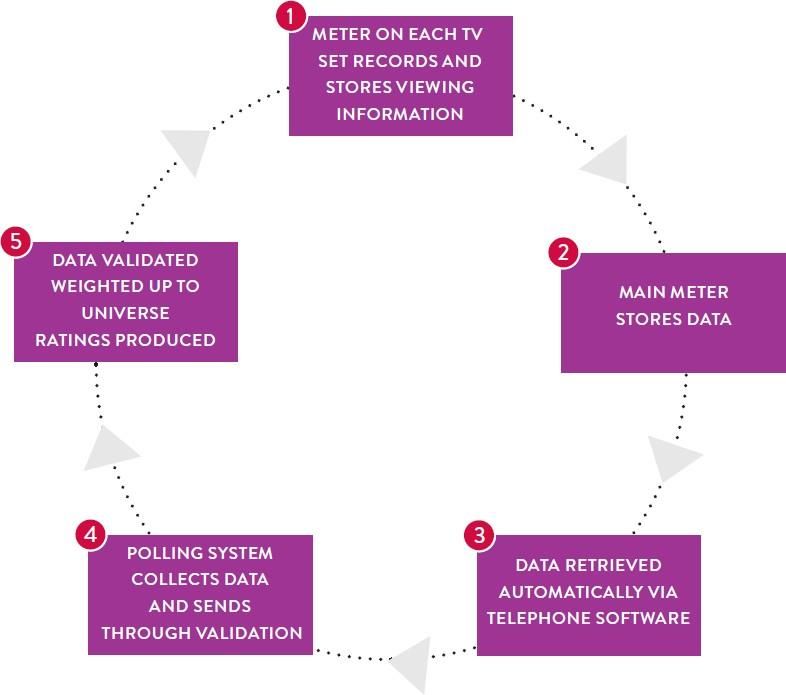
The UNITAM meter records and stores all information about viewing on sets (with a standard
reception type) within panel homes including:
• Whether the TV is switched on or off
• Who is watching
• The date and time they are watching
• The duration of their viewing session
• Audio signals and SID codes2 (Sky sources only)
Data collected by the UNITAM meters is retrieved automatically during ‘polling’ between 03:00 and
06:00 each morning using advanced telephone software.
A complex ‘content-matching’ process (matching the audio captured from the panel homes to the
Nielsen TAM reference site of TV channels) is used to measure and allocate Live, VOSDAL and Time-
shift viewing to individual channels.
The production system processes, validates, weights and produces the ratings. Once the data is
processed, the programme and commercial logs provided by broadcasters and ratings are
integrated.
Daily viewing data for the previous day is reported to clients by 9.30am each day from Tuesday to
Friday and by 12 noon on Monday.
Watch the following videos on the TAM Ireland website:
• The UNITAM Meter
• How the Meter Works
• The Reference Site
1Eligible sets include all those that fall within the current definition of a TV universe
2Sky Identification Codes, which identify the source of viewing, e.g. viewing from a specific channel
Copyright ©2017 The Nielsen Company 14 UNDERSTANDING TV DATASUMMARY OF DAILY
PROCESS
Watch our explanatory video on The Production Process on the TAM Ireland website
Copyright ©2017 The Nielsen Company 15 UNDERSTANDING TV DATAABOUT NIELSEN
Nielsen N.V. (NYSE: NLSN) is a global performance management company that
provides a comprehensive understanding of what consumers Watch and Buy.
Nielsen’s Watch segment provides media and advertising clients with Total
Audience measurement services across all devices where content — video,
audio and text — is consumed. The Buy segment offers consumer packaged
goods manufacturers and retailers the industry’s only global view of retail
performance measurement. By integrating information from its Watch and
Buy segments and other data sources, Nielsen provides its clients with both
world-class measurement as well as analytics that help improve
performance. Nielsen, an S&P 500 company, has operations in over 100
countries that cover more than 90 percent of the world’s population. For
more information, visit www. nielsen. com .
ABOUT TAM Ireland
TAM Ireland (Television Audience Measurement Ireland Ltd) oversees an
accurate and effective audience measurement system for the whole of the
television advertising industry.
TAM Ireland is made up of the majority of commercial broadcasters operating
in Ireland (RTÉ, TV3, TG4, Channel 4, SKY Ireland, be3, Viacom and eir Sport)
and the main Irish media buying agencies. TAM commissions Nielsen TV
Audience Measurement to carry out the actual measurement service.
TAM Ireland’s mission is to provide precise viewership data and promote the
power of television with a commitment to excellence, vision and adaptability.
For more information, visit www. tamireland. ie .
Copyright ©2017 The Nielsen Company 16 UNDERSTANDING TV DATANielsen •• •••• • •• AN UNCOMMON SENSE OF THE CONSUMER ™
You can also read