Estimation of Chlorophyll-a Phytoplankton in the Coastal Waters of Semarang and Jepara for Monitoring the Eutrophication Process using MODIS-Aqua ...
←
→
Page content transcription
If your browser does not render page correctly, please read the page content below
Journal of Ecological Engineering Received: 2020.09.10
 Revised: 2020.10.19
Volume 22, Issue 1, January 2021, pages 51–59 Accepted: 2020.11.05
 Available online: 2020.12.01
https://doi.org/10.12911/22998993/128874

Estimation of Chlorophyll-a Phytoplankton in the Coastal Waters
of Semarang and Jepara for Monitoring the Eutrophication
Process using MODIS-Aqua Imagery and Conventional Methods

Lilik Maslukah1, Riza Yuliratno Setiawan2, Nurjannah Nurdin3, Muhammad Zainuri1,
Anindya Wirastriya1, Muhammad Helmi1
1
 Department of Oceanography, Faculty of Fisheries and Marine Science, Diponegoro University, Indonesia
2
 Department of Fisheries, Faculty of Agriculture, Gadjah Mada University, Yogyakarta, Indonesia
3
 Research and Development Center for Marine, Coast and Small Island, Hasanuddin University
*
 Correspondent author’s e-mail: lilik_masluka@yahoo.com

Abstract
This study investigates the concentration of chlorophyll-a (chl-a) using the data of field observation and MODIS-
Aqua imagery. The field observation data were retrieved by using a conventional method and processed using
spectrometric analysis. This study covers the coastal and near land areas which have different levels of anthropo-
genic activity. The results showed that the coastal waters of Semarang with a high level of anthropogenic activity
persistently show a concentration of chlorophyll a (chl-a) twice as large as Jepara coastal waters. This comparison
value is obtained based on imagery and field data. Meanwhile, the ratio of chl-a field data in each region shows
a value of ±5 times greater than the MODIS data. Field observation data shows a higher value than the MODIS-
Aqua imagery data. The use of imagery data can be employed as a method of monitoring the eutrophication
process on the coast. On the basis of the chlorophyll a classification and field observations, the coastal water of
Semarang are classified as eutropic waters and Jepara is categorized as mesotropic category. The classification
results will be different if monitoring is carried out using the image data with a location far from the mainland, the
Semarang waters are included in the mesotropic category (> 2 mg·m-3) and Jepara is included in the oligotropic
water category (< 2 mg·m-3).

Keywords: chlorophyll a, eutrophic, spectrometry, satellite, MODIS-Aqua

INTRODUCTION caused an increase in the rate of supply of organic
 matter to the ecosystem. One indicator of the eu-
 The coastal waters represent only a small frac- trophication process is the increase in phytoplank-
tion of sea water on the planet, but the role they ton biomass. In coastal waters, the phytoplankton
play is of great importance from an ecological, biomass can be used as an important water quality
social, and economic perspective, by supplying parameter (Poddar et al., 2019) because it is re-
about 90% of global fish yield and accounting for lated to algal abundance, and can be used to deter-
about 25% of global marine (Colella et al., 2016). mine the level of eutrophication in certain water
At present, the coastal zone is one of the most bodies (Zheng & DiGiacomo, 2017).
endangered areas. Pollution, eutrophication, ur- The state of the phytoplankton biomass is typ-
banisation, over-fishing, and tourism continually ically quantified with a proxy, e.g., by measuring
threaten the future of marine coastal ecosystems. the concentration of chlorophyll-a (chl-a), which
The coastal waters are very sensitive to changes is a ubiquitous photosynthetic pigment present in
in nutrients input from the anthropogenic activi- all algal species. The measurements of (chl-a) can
ties on land or in the marine coast itself, which be made in situ (e.g., chlorophyll fluorometers),
can cause eutrophication. The terrestrial input has remotely (with optical radiometers) (Brewin et

 51
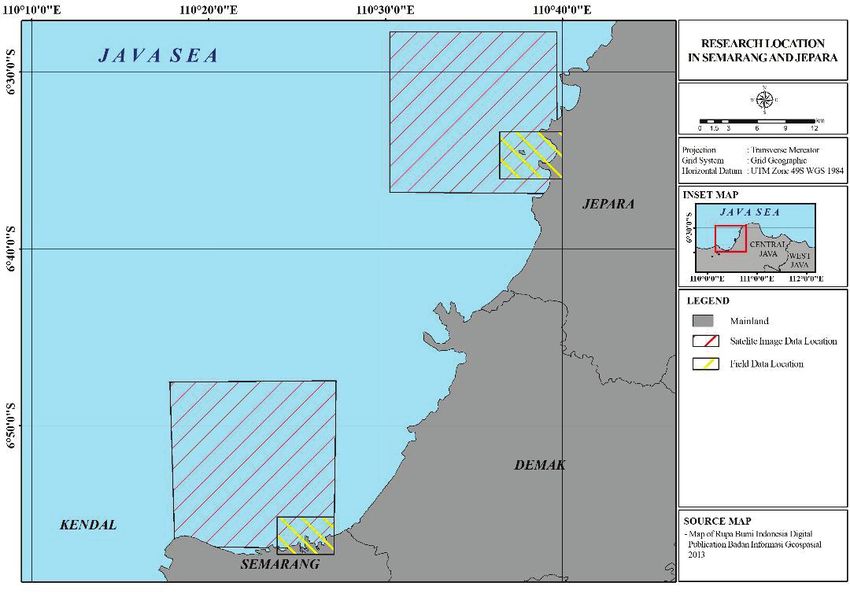
Journal of Ecological Engineering Vol. 22(1), 2021

al., 2019), as well as in the laboratory through the areas studied are different and are located in
the water sample analyses (Dickey et al., 2006). coastal waters with a narrow area, close to the
The conventional method of (chl-a) estimation mainland and have different levels of anthropo-
requires water sample collection and laboratory genic activity. The MODIS imagery data for four
analysis (Joint et al., 2000). This method, effort- years was used to observe the time series fluctua-
intensive and time consuming, is unsuitable for tions, while the field data was used to describe
large spatio-temporal scales. The temporal and the condition of chlorophyll a near the coast, due
spatial sampling strategies of chlorophyll a con- to the inexistence of image data in the areas near
centrations important to monitor eutrophication. the coast.
Instead, the satellite-based sensors can be used for
the assessment of (chl-a) at large spatial scales.
Currently, one operational ocean color sensor, MATERIAL AND METHOD
Moderate Resolution Imaging Spectroradiometer
(MODIS-Aqua), collects data with 1–2 days of The data used in this study is chlorophyll
temporal resolution. a, the results of field measurements using the
 The waters of the coast of Semarang and Jepa- spectrometry method and MODIS-aqua imag-
ra are part of the Java Sea and geographically the ery. The water sampling for (chl-a) analysis was
two coasts are in different parts. The Semarang conducted in May 2017, May 2018, February &
waters are on the north side of Java Island, while July 2019 (Maslukah et al., 2020) and November
Jepara is partly located on the west coast (west of 2019. The image data analyzed in this study was
Java Island). Semarang, which is located in the the result of four years of image recording (2015–
urban center of the capital, certainly has higher 2019), in 4×4 pixel. The location of the study is
anthropogenic activity than Jepara. In addition, presented in Figure 1. The satellite image used in
these waters are watersheds and bring material this study is MODIS-Aqua level III calibrated ra-
from the mainland to enter the waters (BPDAS dians, obtained from NASA at the web address:
Pemali Jeratun, 2009). Unlike the case of the Je- http://rafidfire.sci.gsfc.nasa.gov/realtime.
para waters which are affected by several rivers, The image analysis method involved ex-
such as Wiso river and Sapok river with smaller tracting the sea level reflectance values using
water discharge. The presence of the Australian- SeaDas software version 7.2.1, at the coordinate
Asian monsoon will affect the season and current points closest to the coast. The locations of this
patterns in both waters and affect the distribution study include the Semarang and Jepara coastal
pattern of nutrients and phytoplankton. waters at the latitudes -6.81° to -6.94° & lon-
 The study of the chlorophyll a concentra- gitudes 110.31–110.44° and latitudes -6.47° to
tion using remote sensing (MODIS and Landsat) -6.60° & longitudes 10.52–110.65°, respectively
in the north waters of Java has been conducted (Figure 1).
by several researchers including Siregar & Ko- The analytical methods for measuring
ropitan (2016); Shabrina et al. (2017); Subiyanto chlorophyll a in the field involved the (chl-a)
(2017); Wirasatriya et al. (2018). Likewise, the analysis using the trichromatic method (APHA,
study of the chlorophyll a concentration by taking 1992). A total of 1 liter of seawater was filtered
samples in the field has been carried out by Mas- with cellulose filter paper (millipore, 0.45 μm),
lukah et al. (2019). The research on chlorophyll extracted with 10 ml of 90% acetone, and incu-
a due to the influence of global climate has been bated in an refrigerator for 16 hours. The next
done, the analysis was carried out over a wide step is centrifuged with 4000 rpm rotation, and
area, but has never been discussed in terms of the the supernatant reads its absorbance values at
difference in the value of chlorophyll a in the ar- ƛ664, ƛ645 and ƛ 630. Absorbance at ƛ750 was
eas with different levels of anthropogenic activity used as turbidity control. The chlorophyll a con-
and it has never been studied how the concentra- centration was calculated using formula 1 and 2 :
tion of chlorophyll a results from the image data Chl-a = 11.85 (λ664) –1.54 (λ647) –
 (1)
and field data. – 0.008 (λ630)
 The purpose of this study was to investigate Concentration of chl-a (mg m-3) =
the variability pattern of chlorophyll a (chl-a) tem- (2)
 = Ca × /
porally, using field measurement data and remote where: λ664– value of absorbance at wavelength
sensing data (MODIS-Aqua). Geographically, 664 nm,

52
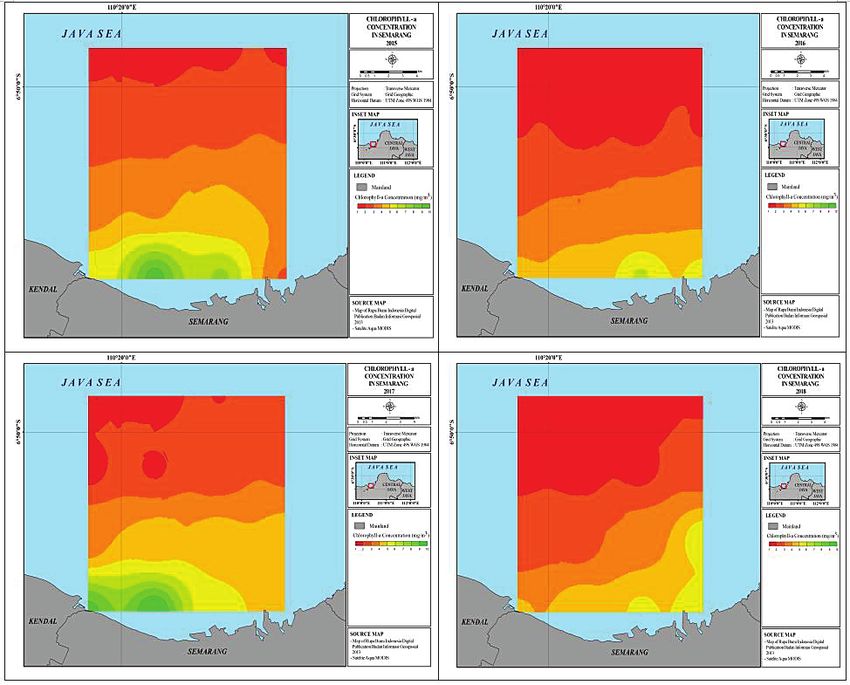
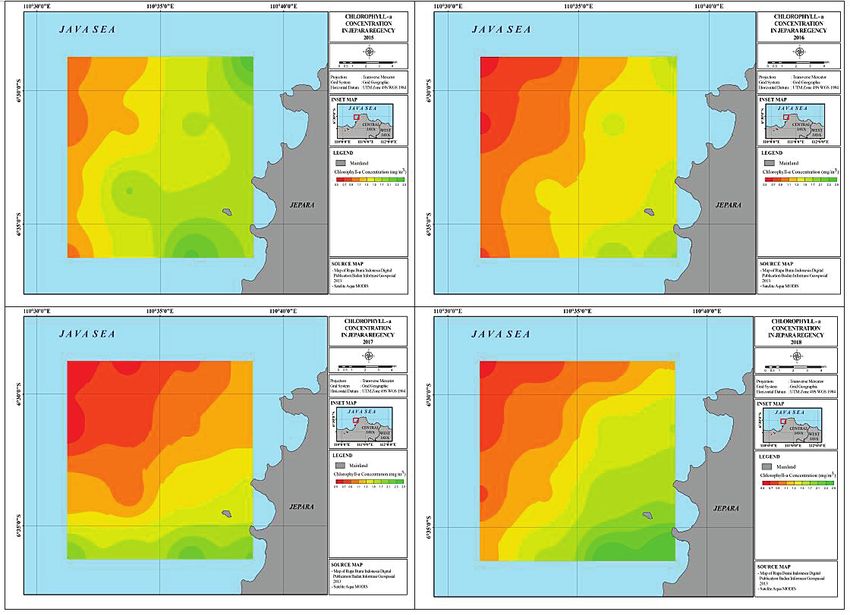
Journal of Ecological Engineering Vol. 22(1), 2021 Figure 1. Research location λ645 – value of absorbance at wavelength The climatological fluctuation pattern for 645 nm, five years can be seen in Figure 2 and the spa- λ630 – value of absorbance at wavelength tial distribution pattern is illustrated in Figures 3 630 nm, and 4. Figure 2 shows that the maximum chlo- v – volume of extract (liter), rophyll a value in April (3.85 mg·m-3) and vice V – volume of sample (m ). 3 versa, the Jepara waters occurred in February (1.75 mg·m-3). The pattern of fluctuations in the Semarang region is generally almost the same as RESULT AND DISCUSSION that of Shabrina et al. (2018) and this pattern is related to high temperatures in April-June and nu- Chlorophyll a in Modis-Aqua Imagery trients due to the rainy season runoff, which were produced in the previous month. The spatial pat- On the basis of the MODIS-Aqua imagery tern of climatology for four years was presented data, the chlorophyll a value of northern wa- in Figures 3 and 4. ters in Central Java is in the range of 0.45– Figure 3 shows that the distribution of chloro- 5.72 mg·m-3 (Table 1). The results of the analy- phyll a in the Semarang coastal waters from south sis for five years (2015–2019) indicate that the to north (except in 2018). This condition is differ- Semarang waters always show higher and more ent in the Jepara waters, which have a distribution fluctuating values compared to the Jepara waters, pattern from east to west. This distribution pattern with average (± standard deviation) of 2.77 ± is morphologically related to the land location. 1.06 mg·m-3 and 1.22 ± 0.57 mg·m-3, respectively. Figure 3 and 4 show that high concentrations are The ratio of the chlorophyll a value of the average sourced from the mainland and are getting small- five years of the Semarang waters to Jepara shows er towards the open waters. a ratio value of 2.2. The results of Siregar & Ko- ropitan (2016) using the Landsat data showed the The Field Measurements of the Chlorophyll a chlorophyll a concentration in the Semarang wa- Concentration ters between 0.6–2.1 mg m-3, while based on the results of MODIS-Aqua in the northern waters of The value of chlorophyll a concentration in Central Java showed a range of values between the field measurements, obtained using the spec- 0.5–1.0 mgv·m-3 (Shabrina et al., 2018). trometry method, shows that the chlorophyll 53
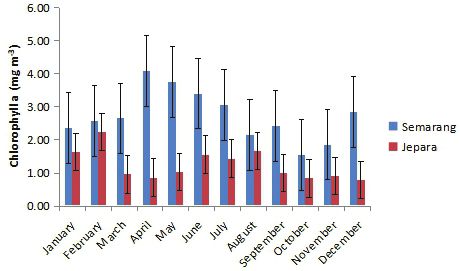
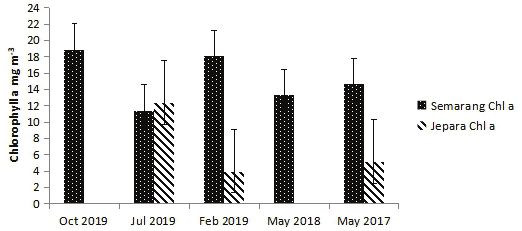
Journal of Ecological Engineering Vol. 22(1), 2021

Table 1. The monthly average of chlorophyll a in 2015–2019
 2019 2018 2017 2016 2015
 Month
 SMRG JPR SMRG JPR SMRG JPR SMRG JPR SMRG JPR
January 2.14 1.73 3.22 * 3.01 2.67 1.43 0.61 1.80 *
February 5.72 0.75 4.13 2.18 1.08 2.28 2.32 2.79 *
March 3.90 1.94 2.20 1.69 3.27 1.18 1.36 0.48 3.77 0.46
April 2.91 0.58 4.09 0.47 3.10 0.58 3.48 0.45 5.67 1.94
May 3.01 1.32 3.27 1.31 5.51 0.74 1.89 1.03 4.34 1.06
June 2.89 1.98 2.11 1.56 2.83 1.29 3.75 1.42 4.92 1.95
July 2.52 1.70 2.58 1.38 3.08 1.51 4.28 1.33 2.26 1.52
August 1.74 1.82 1.98 1.64 2.02 1.70 2.14 1.32 2.43 2.04
September 1.91 3.46 2.73 1.24 2.17 0.75 2.73 0.97 2.07 1.07
October 1.59 0.86 * 0.77 0.76 0.91 2.28 * 1.59 *
November 1.71 0.93 2.47 * * * 2.00 0.90 1.12 0.53
December * * * 0.35 4.17 1.44 2.50 1.87 0.60
Average 2.73 1.55 2.88 1.26 2.82 1.28 2.51 1.08 2.88 1.24
STD 1.16 0.77 0.74 0.55 1.27 0.58 0.87 0.53 1.39 0.61
SMRG: Semarang; JPR: Jepara; STD: standard deviation.

a value of the Semarang waters shows a higher The results of chlorophyll a chl-a measure-
value than the Jepara waters (Figure 5). The re- ments using the image and field data indicate that
sults of field measurements from May 2017 to the field data show values greater than the data
October 2019 show the values ranging from from images (Figure 6) and the value of the com-
11.41–18.81 mg·m-3 (average 15.25 ± 3.14) for parison ratio in 2019 was presented in Figure 7.
the Semarang waters and 3.95–12.34 mg·m-3 (av- The results of previous studies (Brando et al.,
erage 7.13 ± 4.54) for the Jepara waters. Maslu- 2006; Zheng & DiGiacomo, 2017; Yoon et al.,
kah et al. (2020a) explained that the high chloro- 2019) explained that the chlorophyll a concentra-
phyll a is related to the high concentration of dis- tion on the coast was underestimated due to the
solved phosphate (DIP) in the Semarang coastal influence of CDOM reflectance and bathymetry.
waters. In addition to the P nutrient input from The estimation result of chl-a derived from Geo-
river flows, the Semarang’s coastal sediment con- stationary Ocean Colour Imager (GOCI) using
tributes three times higher DIP than the Jepara several (chl-a) algorithms shows a relatively low-
sediment (Maslukah et al., 2020b). On the basis er mean value for the (chl-a) estimation (mean
of the mean value during the measurement of the range: 0.7–1.0 mg·m-3) compared to the value
field data, the ratio of chlorophyll a concentration chl-a in situ (Yoon et al., 2019).
of the Semarang coastal waters to Jepara shows a High chlorophyll a (chl-a) values from field
value ratio of 2.1. measurements were related to sampling closer to

 Figure 2. Chlorophyll a climatology fluctuations in the waters of Semarang and Jepara (2015–2019)

54
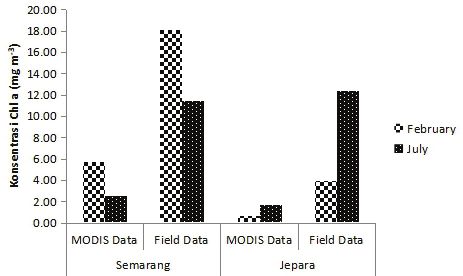
Journal of Ecological Engineering Vol. 22(1), 2021

the land no more than 3 km to the sea and in a as the value of chlorophyll a concentration mea-
narrower area, unlike the image data, obtained surements in the field.
from a wider area towards the high seas (approxi- On the basis of the results of imagery and field
mately 16 km from the coast). However, based on data, the value of chlorophyll a in the Semarang
the chlorophyll a values of the two study areas, waters always shows a high value. This illustrates
the measurement data through two methods (field that the waters of Semarang are more fertile than
measurements and image data), showed almost Jepara, due to the influence of high anthropogenic
the same ratio values. The ratio of the Semarang activity. High anthropogenic activity contributes to
waters to the Jepara waters uses image data in the the input of organic matter and nutrients into these
amount of 2.2 and based on field data of 2.1. The waters. The results of the study of Maslukah et al.
coastal waters of Semarang itself have a ratio of (2019) stated that the measured concentration of
field data to MODIS-Aqua imagery of 5.5 and Je- the P nutrient in the Semarang waters was higher
para is 5.5 (Table 2). Poddar et al. (2019), also (0.5 µM) than in the Jepara waters (±0.35 µM).
shows that in situ (field) data show a higher value
than MODIS and Landsat imagery. Trophic status classification by several
 On the basis of Table 2 it can be seen that the researchers
ratio obtained between the field data and the im-
age approaches the same value. Therefore, the Chlorophyll a can be used as a parameter of
use of remote sensing applications can be used water quality. Many indices have been proposed
in monitoring the chlorophyll a concentrations in for the classification of coastal waters into oligo-
waters and can facilitate assessing large areas in trophic. mesotrophic and eutrophic water types.
a short time. Prianto et al. (2013) explained that If the coastal waters have low productivity, they
the dynamics of the waters always change, so the are characterized as “oligotrophic”, whereas the
resulting image data will not always be the same waters are rich in algal biomass are characterized

 Figure 3. Distribution patterns of chlorophyll a, annual climatology values in the Semarang coastal waters

 55
Journal of Ecological Engineering Vol. 22(1), 2021 Figure 4. Distribution patterns of chlorophyll a, annual climatology values in the Jepara coastal waters Table 2. The average of chlorophyll a (mg·m-3) and On the basis of the MODIS-Aqua satellite ratio between MODIS-Aqua and field data in the (Table 1), the Semarang and Jepara waters have coastal waters of Semarang and Jepara values 10 mg·m-3 (mg·m-3 = μg·L- On the basis of the classification, the value 1 ), then there is abundance of phytoplankton in of chlorophyll a obtained from field observations the waters. Ignatiades (2005) classifies waters in the north coast of Java shows that the Sema- included in the oligotropic category for open rang coastal waters are classified as eutrophic and waters (Aegean Sea), if the chlorophyll a val- the Jepara waters in the mesotrophic category. ues range from 0.16 to 0.37 mg·m-3, mesotro- The results of the classification will be different phic ranges from 0.45 to 0.61 mg·m-3 (offshore if monitoring is performed using the image data. Saronikos Gulf water) and eutrophic from 1.16– The Semarang waters are in the mesotrophic cat- 1.84 mg·m-3 (inshore Saronikos Gulf Water). In egory (> 2 mg·m-3) and Jepara is oligotrophic wa- a review of marine systems, Smith et al. (1999) ters (
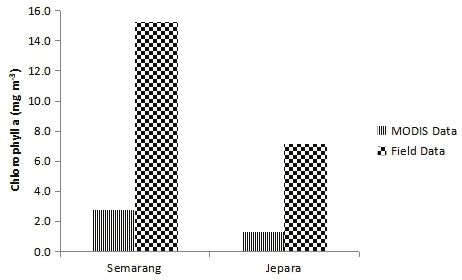
Journal of Ecological Engineering Vol. 22(1), 2021

 Figure 5. Chlorophyll a concentration based on the results of field measurements (spectrometry method)

 Figure 6. The average chlorophyll a in AQUA MODIS (2015–2019) and the field observation (2017–2019)

 Figure 7. The average chlorophyll a in AQUA MODIS and the field observation in 2019

a concentrations ranging from 1 to 3 µg L-1 and than the image data. The image data and the field
hypereutrophic at concentrations > 5 µg·L-1). measurement data of primary productivity val-
 ues (chlorophyll a) both show the ratio is close
 to twice the value. The Semarang waters with
CONCLUSION high anthropogenic activity levels have higher
 chlorophyll a than the Jepara waters. The results
 The results showed that the chlorophyll a of the MODIS-Aqua satellite and field measure-
concentration from the field measurements in ments for the waters of Semarang and Jepara
coastal waters showed a value five times higher are 2.8 and 15.2 mg·m-3 and 1.3 and 7.1 mg·m-3,

 57
Journal of Ecological Engineering Vol. 22(1), 2021

respectively. The MODIS-Aqua data in coastal 8. Ignatiades, L. 2005. Scaling the trophic status of
waters is often not available due to not being re- the Aegean Sea, eastern Mediterranean. Journal
corded. Thus, it is still necessary to monitor the of Sea Research 54(1): 51–57. DOI: 10.1016/j.
 seares.2005.02.010.
continuous field data and image data can be con-
sidered for monitoring on a wider scale and in a 9. Joint, I.; Groom, S.B. Estimation of phytoplankton
 production from space: Current status and future
long time. It is necessary to develop monitoring
 potential of satellite remote sensing. J. Exp. Mar.
of chlorophyll a in coastal areas using more ap- Biol. Ecol. 2000, 250, 233–255. [CrossRef].
propriate satellite data.
 10. Karydis, M. 2009. Eutrophication assessment of
 coastal waters based on indicators: a literature
Acknowledgments review. Global NEST Journal, 11 (4): 373–390.
 https://dx.doi.org/10.30955/gnj.000626.
 This study is funded by Selain APBN Uni- 11. Li, H. P., G.C. Gong dan T.M. Hsiung. 2002. Phy-
versitas Diponegoro Tahun 2020, under scheme toplankton pigment analysis by HPLC and its ap-
Program Penelitian Kolaborasi Indonesia (PPKI), plication in algal community investigations. Bot.
Contract no. 193.05/UN7.6.1/PP/2020. Aqua Bull. Acad. Sin 43: 283- 290.
MODIS level III calibrated radians, obtained 12. Maslukah, L., Zainuri, M., Wirasatriya, A & Salma,
from NASA at the web address: http://rafidfire. U. 2019. Spatial distribution of chlorophyll-a and
sci.gsfc.nasa.gov/realtime. its relationship with dissolved inorganic phosphate
 influenced by rivers in the North Coast of Java. Jour-
 nal of Ecological Engineering. 20 (7): 18–25
REFERENCES 13. Maslukah, L., Zainuri, M., Wirasatriya, A & Mai-
 syarah, S. 2020a. The Relationship among dis-
1. APHA. 1992. Standard method for the examination solved inorganic phosphate, particulate inorganic
 of water and wastewater. 18th edition. Washington, phosphate, and chlorophyll-a in different seasons in
 the coastal seas of Semarang and Jepara, Journal of
 pp. 252.
 Ecological Engineering, 21(3): 135–142.
2. BPDAS Pemali Jratun. 2009. Watershed manage-
 14. Maslukah, L., Zainuri, M., Wirasatriya, A & Widi-
 ment information system Central Java.
 aratih, R. 2020b. Kinetic study on adsorption and
3. Brando, V. Dekker, A., Marks, A., Qin, Y. & desorption ion phosphat (PO42-) in sediment Sema-
 Oubelkheir, K. 2006. Chlorophyll and suspended rang dan Jepara. J. Ilmu dan Teknologi Kelautan
 sediment assessment in a macrotidal tropical estuary Tropis, 12(2): 385–396. http://doi.org/10.29244/
 adjacent to the Great Barrier Reef: spatial and tem- jitkt.v12i2.32392.
 poral assessment using remote sensing. Cooperative 15. Palimirmo, F.S., Damar, A & Effendi, H. 2016.
 Research Centre for Coastal Zone, Estuary and Wa- Distribution dynamic of heterotrophic bacteria
 terway Management (Coastal CRC). Indooroopilly, in Jakarta Bay. JIPI, 21(1): 26–34. https://dx.doi.
 Australia. pp. 111. org/10.18343/jipi.21.1.26.
4. Brewin, R.J.W., Morán, X. A. G., Raitsos, D.E., Git- 16. Poddar, S., Chacko, N. & Swain, D. 2019. Esti-
 tings, J.A., Calleja, M.L., Viegas, M., Ansari, M.I., mation of chlorophyll-a in northern coastal bay of
 Al-Otaibi, N., Huete-Stauffer, T.M., & Hoteit, I. Bengal using landsat-8 OLI and sentinel-2 MSI sen-
 2019. Factors regulating the relationship between sors. Front. Mar. Sci, 6(598): 1–11. doi: 10.3389/
 total and size-fractionated chlorophyll a in coastal fmars.2019.00598.
 waters of the Red Sea. Front. Microbiol. 10:1964. 17. Prayitno, H & Afdal. 2019. Spatial distributions of
 doi: 10.3389/fmicb.2019.01964. nutrients and chlorophyll-a: a possible occurrence
5. Colella, S., Falcini, F., Rinaldi, E., Sammartino, M., of phosphorus as a eutrophication determinant of
 & Santoleri, R. (2016). Mediterranean ocean colour the Jakarta bay. Jurnal Ilmu dan Teknologi Kelau-
 chlorophyll trends. PLoS ONE, 11(6). https: //doi. tan Tropis, 11(1): 1–12. http://dx.doi.org/10.29244/
 org /10.1371/ journal.pone.0155756. jitkt.v11i1.21971.
6. Dickey, T., Lewis, M., Chang, G., 2006. Optical 18. Shabrina, B., Maslukah, L. & Wulandari, S.Y. 2018.
 oceanography: recent advances and future direc- Chlorophyll-a distribution and its relation with cur-
 tions using global remote sensing and in situ obser- rent pattern in Northern Waters of Central Java.
 vations. Rev. Geophys. 44.RG1001. Omni-Akuatika, 14 (1): 69–76.
7. Hakanson, L and A.C. Bryann. 2008. Eutrophication 19. Siregar, V. and Koropitan, A.F. 2013. Primary
 in the Baltic Sea present situation, nutrien transport productivity of Jakarta Bay in a changing envi-
 processes, remedial strategies. Springer-Verlag Ber- ronment: anthropogenic and climate change im-
 lin Heidelberg, pp. 261. pacts. BIOTROPIA, 20(2): 89–103. https://dx.doi.

58
Journal of Ecological Engineering Vol. 22(1), 2021

 org/10.11598/btb.2013.20.2.5. on the variability of SST and Chlorophyll a in Java
20. Smith, V. H. 1999. Cultural eutrophication of inland, Sea. IOP Conference Series: Earth and Environmen-
 estuarine and coastal waters. In: Pace, M. L. and tal Science, 116 (012063).
 P. M. Groffman (eds.). Successes, Limitation and 24. Wouthuyzen, S., M.S. Tarigan, E. Kusmanto, H.
 Frontiers in Ecosystem Science. Springer-Verlag, Indarto dan Sugarin. 2006. Pemantauan Kualitas
 New York, New York, pp. 7–49. Perairan Teluk Jakarta untuk Memprediksi Mark Al-
 gae dengan Satelit Terra dan Aqua MODIS. Laporan
21. Subiyanto, S. 2017. Remote sensing and water qual-
 Penelitian Kompetitif Jabopunjur-LIPI.
 ity indicators in the west flood canal sema¬rang city:
 spatio-temporal structures of lansat-8 derived chlo- 25. Yoon, J.-E., Lim, J.-H., Son, S., Youn, S.-H., Oh, H.-
 J., Hwang, J.-D., Kwon, J.-I., Kim, S.-S. and Kim,
 rophyll-a and total suspended sol¬ids. IOP Conf.
 I.-N,. 2019. Assessment of satellite-based chloro-
 Series: Earth and Environmental Science 98, 1–10.
 phyll a algorithms in eutrophic Korean coastal wa-
22. Tarigan, M.S & Wiadnyana, N.N. 2013. Monitoring ters: Jinhae Bay Case Study. Front. Mar. Sci. 6:359.
 of chlorophyll-a concentration using terra-aqua mo- doi: 10.3389/fmars.2019.00359.
 dis satelitte image in Jakarta Bay. Jurnal Nasional 26. Zheng, G.& DiGiacomo, P.M. 2017. Remote sens-
 Kelautan. 8(2), 81–89. ing of chlorophyll a in coastal waters based on the
23. Wirasatriya A, Prasetyawan I.B., Triyono, C.D., light absorption coefficient of phytoplankton. 201,
 Muslim and Maslukah, L. 2018. Effect of ENSO 331–341.

 59
You can also read