The CMEMS GlobColour Chlorophyll-a Product Based on Satellite Observation: multi-sensor merging and flagging strategies.
←
→
Page content transcription
If your browser does not render page correctly, please read the page content below
The CMEMS GlobColour Chlorophyll-a Product Based on Satellite
     Observation: multi-sensor merging and flagging strategies.
     Philippe Garnesson1, Antoine Mangin1, Odile Fanton d’Andon1, Julien Demaria1, Marine Bretagnon1
     1
         ACRI-ST, Sophia-Antipolis, 06904, France
     2
 5       Laboratory example, city, postal code, country
     Correspondence to: Philippe Garnesson (Philippe.garnesson@acri-st.fr)

     Abstract. This paper concerns the GlobColour merged chlorophyll-a products based on Satellite Observation (SeaWiFS,
     MERIS, MODIS, VIIRS and OLCI) and disseminated in the frame of the Copernicus Marine Environmental Monitoring
     Service (CMEMS).
10   This work highlights the main advantages provided by the Copernicus GlobColour processor which is used to serve the
     CMEMS with a long time series from 1997 to present at Global level (4 km of spatial resolution) and for the Atlantic level 4
     product (1 km).
     To compute the merged chlorophyll-a product, two major topics are discussed:
     •      The strategy for merging remote sensing data; for which two options are considered. On the one hand, a merged
15          chlorophyll-a product computed from a prior merging of the remote-sensing reflectance of a set of sensors. On another
            hand, a merged chlorophyll-a product resulting from a combination of chlorophyll-a products computed for each sensor.
     •      The flagging strategy used to discard non-significant observation (e.g. clouds, high glint…)
     These topics are illustrated by comparing the CMEMS GlobColour products provided by ACRI-ST (Garnesson et al., 2019)
     with the CCI/C3S project (Sathyendranath et al., 2018). While GlobColour is merging chlorophyll-a products with a specific
20   flagging, the CCI approach is based on a prior reflectance merging before chlorophyll-a derivation and uses a more
     constraints flagging approach.
     Although this work addresses these two topics, it does not pretend to provide a full comparison of the two datasets, which
     will require a better characterisation and additional inter-comparison with in situ.

25   1 Introduction

     The Copernicus Marine Environmental Service (CMEMS) provides regular and systematic reference information on the
     physical state and on marine ecosystems for the global ocean and for the European regional seas (temperature, currents,
     salinity, sea surface height, sea ice, marine optical properties, etc.).

                                                                       1
This capacity encompasses satellite and in situ observation-derived products, the description of the current situation
     (analysis), the prediction of the situation a few days ahead (forecast), and the provision of consistent retrospective data
     records for recent years (re-analysis).
     The Ocean Thematic Assembly Centre (OCTAC) is part of CMEMS and is dedicated to the dissemination of Ocean Colour
 5   (OC) products derived from Satellite Observation (Le Traon et al., 2015). The OCTAC provides Global and Regional
     (Arctic, Atlantic, Baltic, Black Sea and Mediterranean) products for the period spanning from 1997 to the present.
     For Global products, the Copernicus GlobColour processor is used operationally since 2009 to serve CMEMS and its
     precursors (a series of EU research projects called MyOcean).
     The GlobColour processor has been initially developed in the frame of the GlobColour project started in 2005 as an ESA
10   Data User Element (DUE) project to provide a continuous data set of merged L3 Ocean Colour products. Since the
     beginning of the project, the Copernicus-GlobColour has been continuously serving more than 600 users worldwide. This
     effort has been continued in the framework of CMEMS to derive (among others) the chlorophyll-a Ocean Colour core
     product.

15   Many algorithms have been published to retrieve chlorophyll-a from reflectances (RRS) observed by the satellite (e.g.,
     Muller Karger et al., 1990, Aiken et al., 1995, Morel 1997, O’Reilly et al., 1998, 2000). In CMEMS, the GlobColour
     chlorophyll-a product relies on a combination of different algorithms:
     •   for oligotrophic water (70% to 80% of ocean), the CI approach (Hu, 2012) is used,
     •   for mesotrophic water, the classical approach OCx (OC3, OC4, OC4Me depending the sensor),
20   •   for complex water, another major contribution is the use of empirical OC5 algorithm (Gohin et al., 2002) which is of
         specific interest for end users who should manage complex water along the coastal zone.
     The work presented here highlights the conceptual advantage of the CMEMS Copernicus GlobColour processor concerning
     flagging and merging of sensors. In the following sections, results are described and illustrated with comparison to the
     CCI/C3S products.
25   The comparison between GlobColour and CCI is especially relevant since the same chlorophyll-a algorithms (CI/HUE and
     OC5) are used by the two initiatives: it means the differences mainly come from the merging strategies and flagging scheme.

     2 Methods

     2.1 Merging approach

30   The CMEMS GlobColour merged chlorophyll-a product relies at present on the following sensors: SeaWiFS (1997-2010),
     MERIS (2002-2012), MODIS-Aqua (2002-present), VIIRS-NPP (2012-present) and OLCI-S3A (2016-present).

                                                                     2
It means that the long time series from 1997 to present relies on different sensors, observing the Earth at different spectral
     bands (and different bandwidth), with different acquisition time (so different atmospheric and sun conditions), and with
     different spatial resolutions from about 300 meters to 1 km at nadir (larger on the swath border). Main characteristics of the
     sensors/bands used for CMEMS are summarized in Table 1. VIIRS-NOOA20 and OLCI-S3B will be ingested in the
 5   operational products in 2019.
     It should be noted that the global chlorophyll-a product is at present provided at a 4km spatial resolution, but the objective in
     the coming years is to provide, at least along the coast, a chlorophyll-a product at 300 meters of resolution.
     All sensors used observe the Earth along a helio-synchronous orbit . One sensor is not able to provide the full Earth coverage
     for a given day (Maritorena et al., 2010, Figure 1). VIIRS provides a larger swath than the other sensors, but the coverage is
10   incomplete because of sun glint.
     When more than one sensor is available for the same period it is of interest to take benefit of the complementarity and
     redundancy of sensors. For instance, depending of sensing time, morning haze can impact one sensor or another (Toole et al.,
     2000).
     To compute a multi-sensors chlorophyll-a product, mainly two merging approaches exist.
15   •   A first approach (used by CCI) is based on merged Reflectance (RRS) computed in a prior step and then used to derive
         chlorophyll-a. Based on a band shifting and bias correction approach, merged RRS for the standard SeaWiFS
         wavelengths (412, 443, 490, 510, 555 and 670 nm) are provided. The blended chlorophyll-a algorithm used in the CCI
         v3.1 release attempts to weight the outputs of the best performing algorithms based on the water types in presence.
     •   Conversely, in a second approach (used by CMEMS GlobColour), the chlorophyll-a is computed in an initialisation step
20       for each sensor using specific characteristics of the considered sensor (spectral band, resolution), and then the mono-
         sensor chlorophyll-a products are resampled and merged. The continuity of the different algorithms was initially
         obtained using a water classification approach (Saulquin al., 2018). Beginning of 2018, a new approach has been
         adopted:
         o    First, the continuity of algorithms used for mesotrophic and complex water are guaranteed by the OC5 lookup
25            tables. The OC5 lookup table is initialized using the OC3 and OC4 coefficients from agencies and then empirically
              adjusted when the green band exceeds a threshold (see Gohin et al., 2002 for details).
         o    Then, the CI and OC5 continuity is based on the same approach as NASA. When the chlorophyll-a concentration is
              in the range 0.15 and 0.2 mg.m-3, a linear interpolation of OC5 and CI is used. This provides continuity between the
              two algorithms.
30

     2.2 Flagging approach

     Inputs of the Copernicus GlobColour processor are the level 2 products provided by the space agencies. To derive the
     chlorophyll-a map, the input level 2 reflectance (RRS) and input flags are used (level 2 provides flags/indicators about the

                                                                    3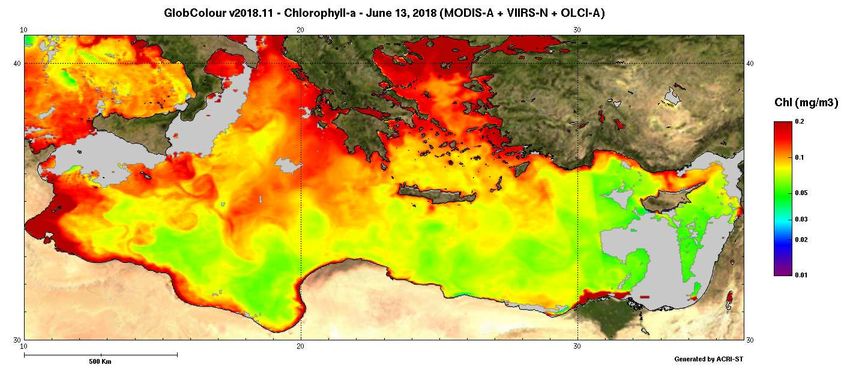
quality of the reflectance at pixel basis). For instance, a pixel can be impacted by a sun glint effect. In such case reflectance
     are available, but it is recommended by agencies to not use it in the processing. Each space agency publishes a flagging
     strategy which has been designed to guaranty the quality of its products. The drawback is that for complex water (especially
     along coastal area), the data are usually flagged, resulting in level 3 products with a limited coverage.
 5   One specificity of the OC5 algorithm (Gohin et al., 2002) is to use its own strategy to flag data (the algorithm was initially
     designed for coastal monitoring). It is based on part of the official flags plus empirical thresholds that have been tuned for
     each sensor (e .g. the OC5 sun zenith angle (SZA) is set to 78° instead 70°).
     The OC5 flagging is used by the GlobColour sensor approach but does not benefit to the CCI approach which uses a specific
     OC5 lookup table to be apply to the merged reflectance.
10
     Concerning CCI/C3S the flagging strategy for release v3.1 depends of the sensor. When the reflectances are based on the
     level 2 provided by the agency (SeaWiFS and VIIRS-SNPP) the official flags from the agencies are applied. When the
     POLYMER algorithm (Steinmetz et al. 2011) is used for atmospheric correction (MERIS and MODIS) a generic pixel
     identification and classification algorithm called Idepix is used (part of BEAM software) instead the standard POLYMER
15   flagging (which is too permissive).

     3 Results and Discussion

     3.1 The reflectance merging approach

     The reflectance merging approach is used by the C3S/CCI to derive the global Chlorophyll-a CCI timeseries and by the
     regional CMEMS products. As pointed by Volpe et al. (2019) for the regional Mediterranean products, the band merging
20   approach has the advantage of providing a homogeneous dataset of spectral reflectance from which can be derived, in full
     consistency for the long term, different environmental parameters, among them chlorophyll-a product but also light
     attenuation, Kd, Suspended Particulate Matter and others.
     However, the consistency of the long-time series provided by CCI suffers from some limitations. The CCI Product user
     guide (Figure 2) intercompares the different release of the CCI time series. It shows that the V2 release was strongly
25   impacted when the MERIS sensor has stopped in April 2012 (see Table 1). The V3 release demonstrate a trend depending of
     the sensors used: It increases for the period 2002-2010 (based on the contribution of SeaWiFS, MODIS and MERIS) and
     decrease for the period 2012-2017 (based on MODIS and VIIRS-SNPP).
     At regional scale, the figure 3 for the Arctic (derived from the CCI-products, source CMEMS OMI QUID) also demonstrates
     strong limitations about the consistency of the time-series and trends that are derived. During the first period until 2002, only
30   SeaWiFS is available, then in 2012 there is the end of the MERIS contribution and the starting of VIIRS-SNPP with the
     same trends as above.

                                                                     4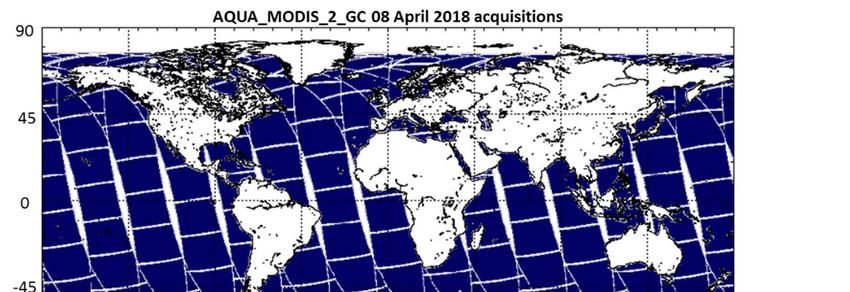
It is known that both MODIS and VIIRS instrument have major calibration issues starting at about 2012. VIIRS-SNPP
     degradation has been identified a few months after launch and MODIS designed for a lifetime of 7 years is now 17 years old.
     MODIS calibration has required regular modification to adjust the temporal trends (R2009.1, R2010.0 and especially
     R2012.0). At the end of year 2017, the NASA reprocessing (called R2018) has significantly improved these issues for VIIRS
 5   and especially the MODIS drift with a new procedure to regularly update the MODIS calibration (available about 3 months
     after acquisition).

     It should be noted that this new NASA processing (called R2018.1) does not yet benefit to the full CCI series (only for the
     recent CCI v3.1 extension until June 2018) but a new CCI v4 release is scheduled for 2019.
10   It should be also underlined that the R2018 still suffering from issues which will continue to impact the future reprocessing.
     and illustrate issues especially for VIIRS sensor wavelength at 443 and 488. Indeed, VIIRS RRS443 and RRS488 increase
     regularly since 2012 while MODIS is more stable. The Figure 4 shows the relative difference at RRS443 of VIIRS and
     MODIS (in %) based on the monthly NASA R2018 global products at 4km. VIIRS suffers from a significant drift since its
     launch as illustrated with January evolution for years 2012, 2016, 2019. In January 2012, 90 % of MODIS at global level
15   was higher than VIIRS-SNPP, while in January 2019 100% of VIIRS-SNPP pixels was higher than MODIS.
     Another major difficulty for merging RRS for the different sensors is that the observed bias varies according to the region
     considered, and the season and as previously shown with artificial trends along the years. The Figure 5 shows the inter-
     comparison of RRS at about 670nm between VIIRS-SNPP and OLCI-S3A compared to MODIS. It shows very important
     bias (e.g 82% of the pixels of OLCI exceeds a relative difference of 20%), and in the case of MODIS the equatorial zone has
20   a different behaviour than high latitude.
     Impact of such reflectance merging on chlorophyll-a is showed on the Figure 6. It shows for the year 2018, limitation to
     handle clear water (the color scale has been set to the range 0.01 to 0.2 mg/l): discontinuities between tracks of the sensor
     clearly appeared.
     The previous illustrations aim at demonstrating the limits about the assumption of the consistency along the OC-CCI time
25   series (and at daily basis Figure 6) but is clear that the GlobColour products are also impacted by the quality of input RRS
     upstream.
     Figure 7 shows at monthly basis the median computed at global level for OC-CCI and GlobColour monthly products. The
     oscillations of the median along the time should be carefully interpreted: it is due to a change of the spatial coverage linked
     to the sensors used, not due to a chlorophyll-a concentration change. To make the two datasets inter-comparable, statistics at
30   monthly basis are computed on common pixels. However, the spatial coverage varies when the sensors used are changed.
     For instance, until 2002 only SeaWiFS is contributing. It means, the gap at this date not corresponds to a change in the
     continuity of the time-series but a change of the pixels used to compute the median. It means potential trends should be only
     considered when same sensors are used (yellow sections on the plot shows the change of sensor combination). The higher
     values for CCI are probably linked to the NASA R2018 which is used by GlobColour but not yet by OC-CCI During this

                                                                   5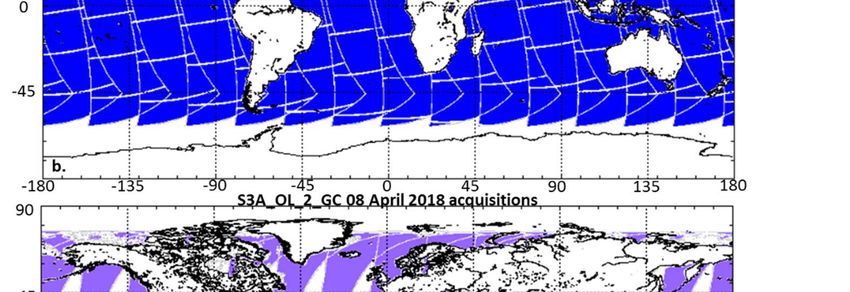
R2018 reprocessing, the MOBY (in situ data) and SeaWiFS calibration were also improved with a resulting decrease in
     chlorophyll of order 10% for all sensors.

 5

     3.2 The chlorophyll-a merging approach

     This approach is the one used by the GlobColour processor for the CMEMS products and is not proposed to solve the issues
     linked to the upstream data. However, the sensor approach (instead starting from merged RRS) have crucial advantages
10   compared to the previous one:
     •   When a new sensor (or when a new reprocessing of this sensor) is available, limited efforts are required because the bias
         correction is limited to the chlorophyll field of the considered sensor. For the merge reflectance approach, the bias
         correction of 5 reflectance and interpolation to simulate the band 510 is required (this band is not available for VIIRS-
         SNPP, VIIRS-JPPS1 and MODIS (see Table 1)).
15   •   For the CI-Hue algorithm, the GlobColour processor takes benefit of the efforts of the spatial agencies to adjust, for each
         sensor, the coefficients taking to take into account the high variability of the band 670 (see Figure 5).
     •   It should be noted that the chlorophyll-a algorithm is applied on the level 2 sensor grid while in the merging approach it
         is applied on the common grid required to merge the reflectance. The use of sensor level 2 grid guaranty that the
         algorithm is applied on reflectance with consistent time observations. On the opposite, when reflectance are re-projected
20       on a common grid, it results in mixing pixels observed with an observation shift that can of raise 4 hours (see Table 1) in
         the case of MODIS and VIIRS-JPSS1). This consideration is not fully relevant in the case of the Global product with a
         spatial resolution of 4 km but will become more sensitive when product will be provided with 300 meters of resolution.

     3.3 The flagging approach

25   Compared to the official agencies recommendations, the OC5 flagging strategy improves significantly the coverage of the
     product especially for NASA sensors. In the frame of CMEMS we have estimated that at sensor level, the coverage is
     improved with the following factors: VIIRS-NPP x3.2, MODIS-a x2.6, MERIS x1.6, SeaWiFS x2, OLCI-S3A x1.3
     As a consequence, for the merged product, it has been measured that GlobColour chlorophyll-a product coverage is
     improved by a factor 2.8 compared to CCI. For the period 2002-2012 the increase in coverage is limited to a factor 1.5
30   (Figure 8 and Figure 9 shows the result of the flagging strategy when bot SeaWiFS, MODIS and MERIS are used).
     The combination of the usage of the flagging strategy and OLCI permits to improve considerably the coverage without
     artefact (see Figure 10). At this date both products benefit of the last NASA R2018 processing.
                                                                    6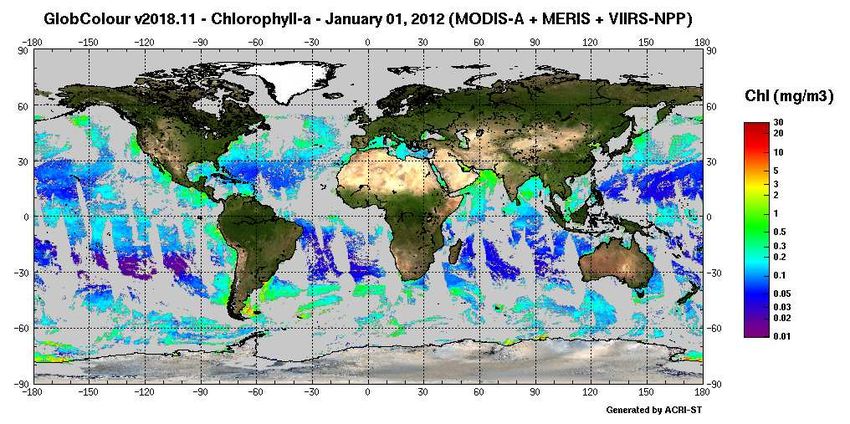
Note that in certain cases, the CCI coverage could be better than the GlobColour one (e.g. Figure 11). However, in this
     example the CCI approach is affected by an important noise, potentially due to cloud contamination. This noise might be due
     to level 2 inputs. Indeed, while GlobColour is using the level 2 from agencies, CCI starts from level 1, apply POLYMER
 5   algorithm to MERIS and MODIS plus a specific flagging.

     4 Conclusion

     This work presents different ways to merge sensors and different flagging strategies to estimate the chlorophyll-a field at
     daily basis.

     Compared to the chlorophyll-a merging approach, the major interest of the reflectance merging approach is to provide a
10   homogeneous dataset of spectral reflectance useful to derive the chlorophyll-a product using a common algorithm. It should
     lead to a better consistency for the long time series. However as illustrated in the previous section, this assumption is not true
     since the homogeneity of the spectral reflectance is at present not obtained (spatial and temporal discontinuities exist).
     It should be underlined that this limitation also exists with the sensor chlorophyll merging approach: in both approaches if a
     trend is observed along the time it should be carefully analysed.
15   The present findings illustrated in the previous sections highlight the advantage of a Chlorophyll-a per sensor merging
     approach compared to the reflectance merging approach:
         •    The sensor approach facilitates the ingestion of a new sensor or a new reprocessing. Consequently, the NASA
              R2018 and OLCI-S3A have been successfully introduced in April 2018 for the merged chlorophyll-a GlobColour
              chain but is not yet available in the other initiatives (CCI or CMEMS regional product). The addition of VIIRS-
20            NOOA20 (JPSS) and OLCI-S3B in the merged GlobColour chlorophyll-a product will occur during 2019.
         •    It should be noted that the reflectance merging approach provides a limited set of six common spectral bands based
              on SeaWiFS sensors. For more recent sensors (i.e. Modis, VIIRS-SNPP and VIIRS-JPPS1) only 5 native
              reflectance are available (see Table 1): the band at 510 nm is obtained by interpolation. Other extra bands from
              MERIS or MODIS or OLCI which are not part of the 6 bands are not usable in the reflectance merging approach
25            (because the spatial complementarity of the sensors cannot be used at daily level and for the full time series). For
              the chlorophyll merging approach, when extra bands are available (i.e. MERIS, MODIS and OLCI) they can be
              used to improve the algorithm in the future. This perspective is already investigated to retrieve PFT from OLCI (e.g.
              Xi, 2018).
         •    The sensor approach provides an improved daily spatial coverage when OC5 is apply on the sensor reflectance (not
30            on merged reflectance). For the period spanning from 2012 to present the spatial coverage is improved with an
              important factor (about 2.8) compared to the CCI product. Both open ocean and coastal area are improved. It is
              required for many users involved in the EU Water Framework and Marine Strategy Framework Directive. To

                                                                     7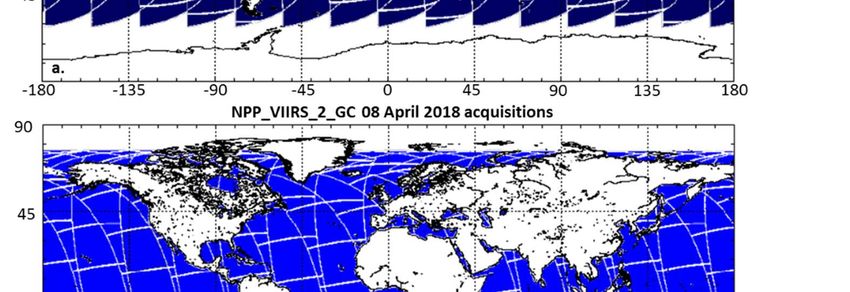
satisfy the user coastal community, a better spatial resolution (300 meters) is also required. From this point of view
              the chlorophyll-a merging approach is also more promising (algorithm can be applied on the level 2 track grid to
              limit the mixing of the pixels).
     A better spatial coverage is also a key point to guaranty the quality of the CMEMS GlobColour chlorophyll-a “cloud free”
 5   product (called daily L4 in the CMEMS catalogue) which is based on a spatial and temporal interpolation of daily
     level3level 3 product. A better daily coverage limits the risk of artefact due to interpolation.

     Acknowledgement

10   We thanks Emmanuel Boss and another anonymous referee for their constructive comments which allow to improve the
     quality of this manuscript.

     References

     Aiken, J., Moore, G. F., Trees, C. C., Hooker, S. B., & Clark, D. K.: The SeaWiFS CZCS-type pigment algorithm. In S. B.
15   Hooker, and E. R. Firestone (Eds.), SeaWiFS Technical Report Series, 29 : Goddard Space Flight Center 38 p., 1995

     Garnesson, P., Mangin A., Bretagnon M.: Quality User Guide, Ocean Colour Production Centre, Satellite Observation
     GlobColour-Copernicus Products, http://marine.copernicus.eu/, 2019

20   Gianluca Volpe et al. Mediterranean ocean colour Level 3 operational multi-sensor processing, Ocean Science Ocean Sci.,
     15, 127–146, 2019 https://doi.org/10.5194/os-15-127-2019, 2019

     Gohin, F., Druon, J.N. and Lampert, L.: A five channel chlorophyll concentration algorithm applied to SeaWiFS data
     processed by SeaDAS in coastal waters. International journal of remote sensing, 23(8), 1639-1661, 2002.
25   Hu, C., Lee, Z. and Franz, B.: Chlorophyll a algorithms for oligotrophic oceans: A novel approach based on three‐band
     reflectance difference. Journal of Geophysical Research: Oceans, 117(C1), 2012.

     Le Traon, P.Y., Antoine, D., Bentamy, A., Bonekamp, H., Breivik, L.A., Chapron, B., Corlett, G., Dibarboure, G.,
     DiGiacomo, P., Donlon, C. and Faugère, Y.: Use of satellite observations for operational oceanography: recent achievements
30   and future prospects. Journal of Operational Oceanography, 8(sup1), s12-s27, 2015.

                                                                     8
Maritorena, S., d'Andon, O.H.F., Mangin, A. and Siegel, D.A.: Merged satellite ocean color data products using a bio-optical
     model: Characteristics, benefits and issues. Remote Sensing of Environment, 114(8), 1791-1804, 2015.

     Morel, A.: Optical properties of oceanic case 1 waters revisited. In Ocean Optics XIII (Vol. 2963, pp. 108-115). International
 5   Society for Optics and Photonics, February 1997.

     Müller‐Karger, F.E., McClain, C.R., Sambrotto, R.N. and Ray, G.C. (1990). A comparison of ship and coastal zone color
     scanner mapped distribution of phytoplankton in the southeastern Bering Sea. Journal of Geophysical Research: Oceans,
     95(C7), 11483-11499, 1990.
10
     O'Reilly, J.E., Maritorena, S., Mitchell, B.G., Siegel, D.A., Carder, K.L., Garver, S.A., Kahru, M. and McClain, C.: Ocean
     color chlorophyll algorithms for SeaWiFS. Journal of Geophysical Research: Oceans, 103(C11), 24937-24953, 1998.

     O’Reilly, J.E., Maritorena, S., Siegel, D.A., O’Brien, M.C., Toole, D., Mitchell, B.G., Kahru, M., Chavez, F.P., Strutton, P.,
15   Cota, G.F. and Hooker, S.B.: Ocean color chlorophyll a algorithms for SeaWiFS, OC2, and OC4: Version 4. SeaWiFS
     postlaunch calibration and validation analyses, Part, 3, 9-23, 2000.

     Pardo, S., Brando, V., Taylor, B., Quality Information Document (QUID) of Ocean Monitoring Indicators (OMI) for
     OCTAC, Issue 1.0, 12. Sep. 2018.
20
     Sathyendranath, S.; Grant, M.and all (2018): ESA Ocean Colour Climate Change Initiative (Ocean_Colour_cci): Version 3.1
     Data. Centre for Environmental Data Analysis, 04 July 2018. doi:10.5285/9c334fbe6d424a708cf3c4cf0c6a53f5.
     Saulquin, B., Gohin, F. and Fanton d’Andon, O.: Interpolated fields of satellite-derived multi-algorithm chlorophyll-a
     estimates at global and European scales in the frame of the European Copernicus-Marine Environment Monitoring Service.
25   Journal of Operational Oceanography, 2018.

     Steinmetz F, Pierre-Yves Deschamps, P-Y, Ramon, D (2011) Atmospheric correction in presence of sun
     glint: application to MERIS, Optics Express, Vol. 19, Issue 10: 9783-9800. http://dx.doi.org/10.1364/OE.19.009783.
     Toole, D.A., Siegel, D.A., Menzies, D.W., Neumann, M.J. and Smith, R.C.: Remote-sensing reflectance determinations in
30   the coastal ocean environment: impact of instrumental characteristics and environmental variability. Applied Optics, 39(3),
     456-469, 2000.

     Vantrepotte, V. and Mélin, F.: Temporal variability of 10-year global SeaWiFS time-series of phytoplankton chlorophyll a
     concentration. ICES Journal of Marine Science, 66(7), 1547-1556, 2009.

                                                                    9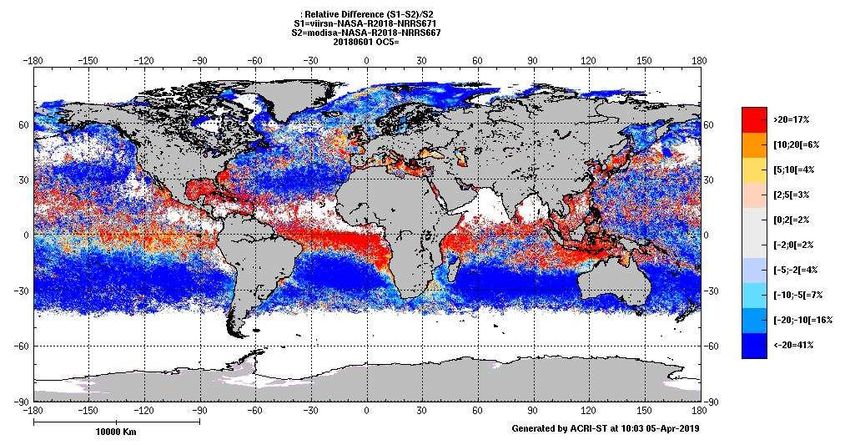
Xi, H. , Losa, S. N. ,   Mangin, A. ,     Soppa, M. A. ,    Garnesson, P. ,   Demaria, J. ,   d'Andon, O. H. F. and
    Bracher, A. (2018):      Global Retrieval Algorithms for Phytoplankton Functional Types (PFTs): toward the Applications
    to OLCI and GlobColour Merged Products , Ocean Optics Conference XXIV, Dubrovnik Croatia, 7 October 2018 -
5   hdl:10013/epic.e9a41e28-ef93-43bd-b20a-c613693bd5d8 , 12 October 2018 .

                                                               10
Figure 1: Swath of the different sensors used at present by CMEMS for a) MODIS-Aqua, b) VIIRS-NPP and c)
OLCI-S3A. In practice the effective swath coverage is reduced mainly due to clouds or sun glint effects.
Source: http:octac.acri.fr.
11Figure 2: Comparison of the Global Median chlorophyll-a concentration as function of time for v2.0, v3.0 and v3.1
using the monthly composite as input. Source: CCI Product User Guide, release 3.1.0, 24th of April 2017.
5 Yellow part shows change of sensor combinations (see Table 1)
12Figure 3 : Arctic time series and trend (1997-2017) from CCI product. The time series are derived from the regional
chlorophyll-a reprocessed (REP) products as distributed by CMEMS which, in turn, results from the application of
the regional chlorophyll-a algorithms with remote sensing reflectances (RRS) provided by the ESA Ocean Colour
5 Climate Change Initiative (ESA OC-CCI). Daily regional mean values are calculated by performing the average
(weighted by pixel area) over the region of interest. A fixed annual cycle is extracted from the original signal, using
the Census-I method as described in Vantrepotte et al. (2009). The deseasonalised time series is derived by
subtracting the seasonal cycle from the original time series, and then fitted to a linear regression to obtain the linear
trend. Source: CMEMS QUID.
10
13Figure 4: relative difference at RRS443 of VIIRS and MODIS (in %) based on the monthly NASA R2018 global
products at 4km). VIIRS suffers from a significant trend since it has been launched as illustrated with January
month evolution for years 2012, 2016, 2019.
14Figure 5: Relative difference between sensors [(S1-S2)/S2] of monthly NRRS (June 2018), for a) MODIS-NRRS667
and OLCI-NRRS665 and b) VIIRS-NRRS671 and MODIS-NRRS667. Source: these plots are part of the monitoring
done by the OCTAC and reported on http:octac.acri.fr.
15Figure 6: Inter-comparison of GlobColour product and OC-CCI during 2018 for Oligotrophic water (CI/HU
algorithm). the color scale has been set to the range 0.01 to 0.2 mg/l: discontinuities between tracks of the sensor
clearly appeared on the OC-CCI case at the top.
16Figure 7: Comparison of the Global Median chlorophyll-a concentration as function of time for CCI v3.1 and
GlobColour R2018.11. The discontinuities of the median along the time should be carefully interpreted: it is due to a
change of the spatial coverage linked to the sensors used, not due to a chlorophyll-a concentration change. It means
5 potential trends should be only considered when same sensors (see Table 1).
Yellow part shows change of sensor combinations (see Table 1)
17Figure 8: Chlorophyll-a concentration (15 Dec 2017), a) CCI level 3 product and b) GlobColour product.
The two initiatives are using MODIS-A, and VIIRS-SNPP at this date, in complement OLCI-S3A is also used by
GlobColour products
5
18Figure 9: Chlorophyll-a concentration (15 Dec 2017): a) CCI level 3 product, b) GlobColour product.
5 Figure 10: Chlorophyll-a concentration (1 Jan 2012), a) CI level3 product and b) GlobColour product.
19The two initiatives are using MODIS-A, MERIS and VIIRS-SNPP at this date.
5 Figure 11: Chlorophyll-a concentration (1 Jan 2012), a) CCI level3 product, b) GlobColour product.
20Table 1: Main characteristics of sensors/bands used for CMEMS.
Spatial Swath
Equate
Sensor RRS Wavelengths (nm) Resolution width Period
crossing time
At Nadir (km) (km)
SeaWiFS 412,443,490,510,555,670 1&4 1502 12:20 1997-2010
413,443,490,510,560,620,667,
MERIS 1 & 0.3 1150 10:00 2002-2012
681,709
412,443,469,488,531,547,555,
MODIS-Aqua 1 2330 13:30 2002-present
645,667,678
VIIRS-NPP 410,443,486,551,671 1 3040 10:30 2012-present
400,412,442,490,510,560,620,
OLCI S3A 1.2 & 0.3 1270 10:00 2016-present
665,674,681,709
VIIRS- Dec-2017-
411,445,489,556,667 0.75 3040 9:50
JPPS1/NOAA20 present
400,412,442,490,510,560,620,
OLCI S3B 1.2 & 0.3 1270 10:00 2018-present
665,674,681,709
5
21You can also read