Assessment of Community Noise Annoyance due to Transverse Rumble Strips Installation at Residential Areas - IOPscience
←
→
Page content transcription
If your browser does not render page correctly, please read the page content below

IOP Conference Series: Materials Science and Engineering

PAPER • OPEN ACCESS

Assessment of Community Noise Annoyance due to Transverse Rumble
Strips Installation at Residential Areas
To cite this article: N Darus et al 2021 IOP Conf. Ser.: Mater. Sci. Eng. 1144 012072

View the article online for updates and enhancements.

                               This content was downloaded from IP address 46.4.80.155 on 26/05/2021 at 13:05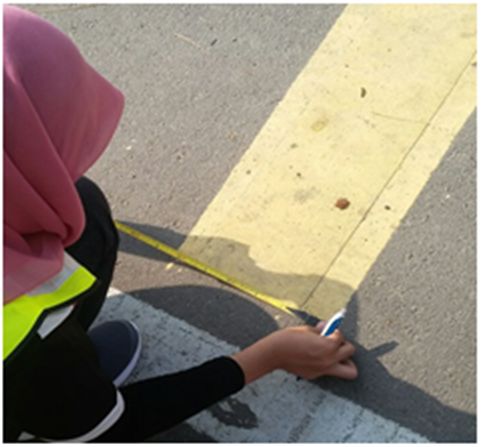
ISCEE 2020                                                                                                               IOP Publishing
IOP Conf. Series: Materials Science and Engineering              1144 (2021) 012072           doi:10.1088/1757-899X/1144/1/012072

Assessment of Community Noise Annoyance due to
Transverse Rumble Strips Installation at Residential Areas

                     N Darus1*, Z Haron1, K Yahya1, N Mashros2, M H Othman3, W N F Wan Hassan1
                     and K H Padil1
                     1
                       Department of Structure and Materials, School of Civil Engineering, Faculty of Engineering,
                     Universiti Teknologi Malaysia, 81310 Johor Bahru, Johor, Malaysia
                     2
                       Department of Geotechnics and Transportation, School of Civil Engineering, Faculty of
                     Engineering, Universiti Teknologi Malaysia, 81310 Johor Bahru, Johor, Malaysia
                     3
                       Faculty of Civil Engineering and Built Environment, Universiti Tun Hussein Onn Malaysia,
                     86400 Batu Pahat, Johor, Malaysia
                     *Corresponding author: nadirahdarus@utm.my

                     Abstract. Transverse rumble strips (TRS) acts as a traffic calming device to alert inattentive
                     drivers, however, inappropriate design may generate excessive noise level which cause
                     annoyance among the nearby residents. This study attempts to assess community noise
                     annoyance by investigating current TRS designs and characteristics, measuring roadside noise
                     level and traffic characteristics and evaluating noise annoyance due to TRS installation. Middle
                     overlapped (MO), middle layer overlapped (MLO) and raised rumbler (RR) TRS profile types
                     were selected. Noise indices such as A-weighted equivalent continuous sound pressure level
                     (LAeq), sound level exceeding 10% (L10) and 90% (L90) of specified time were measured using
                     sound level meter (SLM) based on ISO 11819 - 1: 2001 Acoustics: Measurement of the influence
                     of road surfaces on traffic noise - Part 1: statistical pass-by (SPB) method. Traffic characteristics
                     such as volume and speed were also measured. Then, community noise annoyance was evaluated
                     in terms of LAeq changes, noise limit comparison by the Department of Environment (DOE) and
                     traffic noise index (TNI) calculation. It was found that there are various TRS profile types with
                     the thickness of only 3mm. Regardless the types, TRS installation has increased the roadside
                     noise level of about 7dBA and exceeded permissible noise limits.

1. Introduction
Traffic calming device helps in reducing unsafe driving practices among the drivers which may cause
road traffic accident. Transverse rumble strips (TRS) among other traffic calming devices is a set of
transverse strips purposely installed on roadways which considered visual, sound and vibration effects.
This is to ensure the driver aware on the upcoming hazards on the roadways [1-2]. It is also known as
transverse bars, transverse strips, log strips, speed breakers, in-lane, or travel way rumble strips due its
installation’s location which is perpendicular to the traffic flows or vehicle directions. Besides,
according to national guidelines, it is also known as yellow transverse bars due to its common colour.
In Malaysia, TRS is widely installed at sensitive areas, especially residential, schools and hospitals by
the respected local authorities. The TRS installation has been practiced worldwide by many countries
such as the United Kingdom (UK) [3], United States of America (USA) [4], China [5], Thailand [6],
Korea [7], Italy [8] and Australia [9]. There are several varieties of installation in regard of its
configurations, profiles, dimensions and colours. For local TRS installation, it should be installed
according to the national TRS guidelines to ensure uniform TRS designs all over the country [10-12].

              Content from this work may be used under the terms of the Creative Commons Attribution 3.0 licence. Any further distribution
              of this work must maintain attribution to the author(s) and the title of the work, journal citation and DOI.
Published under licence by IOP Publishing Ltd                          1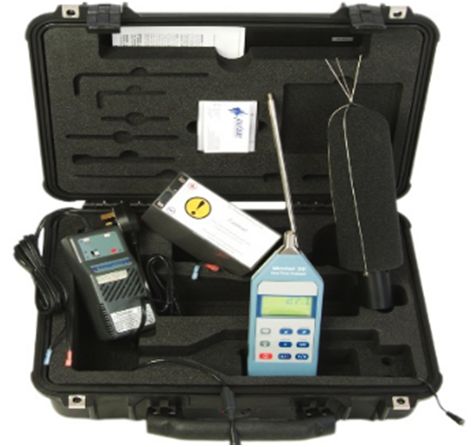
ISCEE 2020                                                                                       IOP Publishing
IOP Conf. Series: Materials Science and Engineering   1144 (2021) 012072    doi:10.1088/1757-899X/1144/1/012072

   In terms of colour, yellow coloured TRS is mostly installed in Malaysia [2] and other countries such
as the United Kingdom (UK) [3] and China [5]. Besides, colour plays an important role to assist the
driver’s alertness on upcoming hazards through visual effect and to avoid the possible unsafe situation
on the roadways. According to the road safety facility manual, yellow colour is mainly suggested for
TRS installation with the purpose of colour uniformity as a safety signal to the road users [11]. Apart
from colour, material is also an important physical characteristic of TRS where thermoplastic, the most
common TRS material which known for its durability and cost-saving advantages over elastoplastic,
preformed plastic, concrete or asphalt [2-3, 13-14]. For local practice as suggested in the national
guidelines, most TRSs are installed uniformly across entire country using thermoplastic material [10-
12]. This material is used together with the reflective materials such as glass and microcrystalline
ceramic beads to improve visibility and retro reflectivity especially during night-time and raining
condition.
   On the other hand, the available TRS guidelines lack on detailed explanation of TRS profile. In actual
practice, the local authorities and road engineers are responsible on the selection of TRS profile and
dimension. For some cases where different TRS profiles generate different sound levels which may
cause noise annoyance especially to the residents who live adjacent to the roadways [15]. Due to
excessive TRS noise generation, several noise complaints were lodged to the local authorities [16-17].
Furthermore, it is not locally happened but widely spread all over other countries [18-19]. In our local
scope, the pioneer TRS study reported that installation of TRS generate noticeable sound level change
of as much as 14 dBA [16]. Then, another recent study also highlighted sound level changes of 4 to 6
dBA due to TRS installation [2]. However, there are still few studies on roadside TRS noise have been
conducted especially in our local context. Therefore, this study aims to assess community noise
annoyance due to TRS installation at residential areas.

2. Methodology
This study was conducted in three main stages based on objectives of the study. The following sections
present the details of each stage.

2.1. Investigation of current TRS designs and characteristics
In order to investigate the profile, thickness, width, spacing, length and strip number of TRS, visual
investigation and on-site measurement were carried out at the first stage. This study was conducted at
three selected residential areas located in Johor state, installed with different TRS profile types as
sampling site. The selection criteria include good TRS surface’s condition, located near to residential
areas at 70 m away minimum from the nearest traffic light to ensure a consistent traffic flow [20-21].
Besides, the selected roadways must be in a good pavement condition, flat and straight topography.
These criteria must be considered to avoid bias of measurement readings. In determining the type and
measuring the thickness of selected TRS profile, Barton comb profilometer (BCP) as in figure 1 was
used in this study. Both TRS and road surfaces were cleaned off using a brush prior to the measurement
to ensure smooth surfaces which required for the measurement reading and TRS profile pattern. The
BCP was pressed down on both surfaces to obtain the TRS thickness and profile using BCP teeth. Apart
from that, measuring tape was also used in this study to measure TRS width, spacing and length as
shown in figure 2.

         Figure 1. Barton comb profilometer.                           Figure 2. Measuring tape.

                                                         2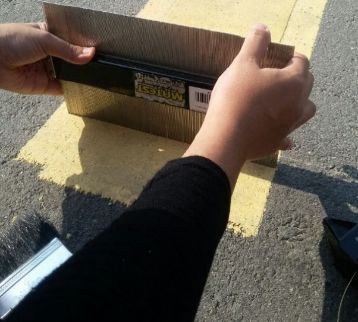
ISCEE 2020                                                                                          IOP Publishing
IOP Conf. Series: Materials Science and Engineering       1144 (2021) 012072   doi:10.1088/1757-899X/1144/1/012072

2.2. Measurement of roadside noise level and traffic characteristics due to TRS installation
A-weightage frequency weighting was used in measuring all required data in representing sound in
decibel to suit human ear’s sensitivity. Figure 3 shows Type 1 Pulsar Model 33 data logging sound level
meter (SLM) and acoustic calibrator, Model 105 - Class 1 with calibration value of 94 dB ± 1 dB @ 1
kHz in compliance with the International Regulations and Codes of Practice. The measurement
procedures were conducted for 15 hours (daytime) based on ISO 11819 - 1: 2001 Acoustics:
Measurement of the influence of road surfaces on traffic noise - Part 1: statistical pass-by (SPB) method
[2, 22]. SLM was installed on a tripod at 1.5 m above ground level, 7.5 m and 3.5 m away from the
middle of nearest travel lane and any obstacles, respectively as shown in figure 4 [22, 23]. Point 1 and
Point 2 represent with and without TRS, respectively. To avoid the effect of TRS noise, the distance
between these points should be greater than 100 m [2, 24]. Meanwhile, wind speed and air temperature
were measured using anemometer as in figure 5 must be below 5 m/s and 5 °C to 40 °C, respectively to
avoid reading bias [22, 25].

  Figure     3.   Sound      level          Figure 4. Measurement layout.             Figure 5. Anemometer.
  meter.

    In this study, traffic volume and vehicle speed in the units of vehicle per hour (veh/h) and
kilometre/hour (km/h), respectively were also measured among other contributing factors of higher
traffic noise level [19]. All required traffic data was measured using MetroCount (MC5600) Series
Vehicle Classifier System, an automatic traffic counter (ATC) which basically consists of a data recorder
and two pneumatic tubes. The tubes were secured in parallel with nails and steal cleats on the flat
pavement surface at one-metre spacing perpendicularly across the roadways. The tubes ends were
connected to the data recorder and tightly tied to secure the air sensor within the tube. In avoiding any
loss or damage, the instrument was kept in a safety box secured with steel chain and padlock which
positioned at the roadside. One week measurement was conducted which focused on three days (Monday
to Wednesday) within the middle of the week. Besides, the start and end days of the week were excluded
in order to avoid different traffic behaviours such as vehicle speed and traffic volume.

2.3. Evaluation of noise annoyance due to TRS installation
The difference between with and without TRS measured noise levels were first evaluated. Basically, 3
dBA, 5 dBA and 10 dBA changes were considered just discernible, clearly discernible and perceived as
a doubling or halving of volume, respectively [26]. Besides, the noise levels were also compared with
L90 + 10 dB and 60 dBA permissible limits under Schedule 2 and Schedule 4 in the DOE guidelines
[23]. In this study, all selected sampling sites are located at the roadside within 7.5 m from the middle
of nearest lane. These limits are applicable for daytime noise exposure as the roadside noise
measurements were conducted for 15-hour starting from 7 a.m. to 10 p.m. excluding night-time. Both
LAeq and L90 values obtained from this study were compared with these permissible noise limits. Then,
the noise annoyance was also evaluated using TNI as in equation (1) [16]. TNI values should not exceed
74 dBA to avoid annoyance among the nearby residents.

                                            = 4(      −       )+       − 30                                   (1)

                                                             3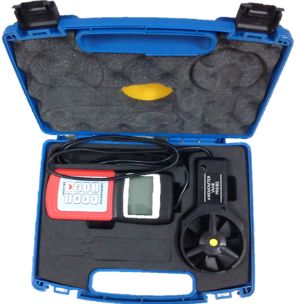
ISCEE 2020                                                                                              IOP Publishing
IOP Conf. Series: Materials Science and Engineering     1144 (2021) 012072      doi:10.1088/1757-899X/1144/1/012072

where, TNI is traffic noise index, L10 and L90 are sound levels exceeding 10% and 90% of specified
measurement time, respectively, and 30 is the constant value.

3. Results and discussions
The following sub-sections present the finding of this study.

3.1. Current TRS designs and characteristics
Generally, the selection of TRS profile type is dependent on the judgment of local authorities where
middle overlapped (MO), middle layer overlapped (MLO) and raised rumbler (RR) are common profile
types. First two profile types were mostly found around Johor Bahru and Iskandar Puteri City Councils,
Pasir Gudang and Kulai Municipal Councils. Meanwhile, RR profile was usually installed in Batu Pahat,
Muar and Pontian Municipal Councils. Table 1 summarizes the designs and characteristics of MO, MLO
and RR. The MO and MLO profiles are located under Iskandar Puteri city council territory, whereas RR
is located under Batu Pahat municipal council. The optimum thickness for all TRS profile is 3 mm as
suggested by previous study [2]. Meanwhile, the width, spacing, length and TRS strip number were
between 400 to 600 mm, 2.35 to 2.50 m, 2.80 to 3.35 m and 20 to 33 strips, respectively.

                                       Table 1. TRS designs and characteristics.
        TRS profile                         MO                       MLO                           RR
      Thickness (mm)                          3                        3                            3
        Width (mm)                           600                      400                         500
       Spacing (mm)                         2350                     2450                         2500
       Length (mm)                          3350                     2800                         3000
       Strip number                          33                        30                          20
                                                            3 mm
                                3 mm

                                                                                        3 mm

   Profile (not to scale)                     30 mm                    200 mm                      60 mm       60 mm

                                             600 mm                    400 mm                      500 mm

   Actual configuration

3.2. Roadside noise level due to TRS installation
Based on the measurement, 15-hour roadside noise levels at three residential areas are in range of 60
dBA to 75 dBA as shown in figure 6. Sites installed with RR and without MLO recorded the highest
and lowest noise levels, respectively. All sampling sites recorded noise level increment during morning
and evening peak hours where RR generated the highest LAeq for both with and without TRS followed
by MO and MLO. All readings due to TRS were higher than without TRS for all profiles indicates that
regardless profile types, TRS installation has increased the actual roadside noise level. Similar to the
previous studies, it was found that the average LAeq of this study at residential area was 70 dBA [27].
Meanwhile, average LAeq values of 69.1 dBA and 71.4 dBA were recorded at two different schools
located in Johor [28]. Apart from TRS installation, vehicle speed and traffic volume play important
factor in affecting roadside noise level.

3.3. Traffic Volume and Vehicle Speed
Among the sampling sites, MO recorded the highest average traffic volume of 1124 veh/h followed by
MLO and RR of 398 veh/h and 491 veh/h, respectively as shown in figure 7. With traffic volume of
more than double than the other two sites, MO is the busiest roadway. Meanwhile, figure 8 shows that
RR recorded the highest vehicle speed which exceeded the posted speed limit of 60 km/h. Thus, there
is significant difference of speed between Site 3: RR with Site 1: MO and Site 2: MLO.

                                                           4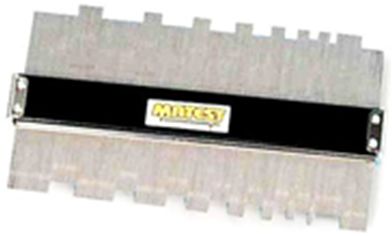
ISCEE 2020 IOP Publishing
IOP Conf. Series: Materials Science and Engineering 1144 (2021) 012072 doi:10.1088/1757-899X/1144/1/012072
With MO With MLO With RR Without MO Without MLO Without RR
80.0
LAeq (dBA)
75.0
70.0
65.0
60.0
07:00-08:00
08:00-09:00
09:00-10:00
10:00-11:00
11:00-12:00
12:00-13:00
13:00-14:00
14:00-15:00
15:00-16:00
16:00-17:00
17:00-18:00
18:00-19:00
19:00-20:00
20:00-21:00
21:00-22:00
Period (Hour)
Figure 6. 15-hour roadside noise level.
Traffic Volume (veh/hour)
2000
1800
1600
1400
1200
1000
800
600
400
200
0
07:00-08:00
08:00-09:00
09:00-10:00
10:00-11:00
11:00-12:00
12:00-13:00
13:00-14:00
14:00-15:00
15:00-16:00
16:00-17:00
17:00-18:00
18:00-19:00
19:00-20:00
20:00-21:00
21:00-22:00
07:00-08:00
08:00-09:00
09:00-10:00
10:00-11:00
11:00-12:00
12:00-13:00
13:00-14:00
14:00-15:00
15:00-16:00
16:00-17:00
17:00-18:00
18:00-19:00
19:00-20:00
20:00-21:00
21:00-22:00
07:00-08:00
08:00-09:00
09:00-10:00
10:00-11:00
11:00-12:00
12:00-13:00
13:00-14:00
14:00-15:00
15:00-16:00
16:00-17:00
17:00-18:00
18:00-19:00
19:00-20:00
20:00-21:00
21:00-22:00
Site 1: MO Site 2: MLO Site 3: RR
Time (hour)
Figure 7. Traffic volume.
Site 1: MO Site 2: MLO Site 3: RR Posted Speed Limit
100
80
Speed (km/h)
60
40
20
0
07:00-
08:00-
09:00-
10:00-
11:00-
12:00-
13:00-
14:00-
15:00-
16:00-
17:00-
18:00-
19:00-
20:00-
21:00-
08:00
09:00
10:00
11:00
12:00
13:00
14:00
15:00
16:00
17:00
18:00
19:00
20:00
21:00
22:00
Period (Hour)
Figure 8. Vehicle speed.
3.4. LAeq changes
Figure 9 shows that LAeq changes during peak hours were higher as compared to non-peak hours for all
TRS profiles. The highest and lowest LAeq changes of 6.7 dBA and 0.8 dBA were recorded by MLO and
RR, respectively. It also was found that RR shows insignificant changes of less than 3 dBA while MO
records discernible changes especially during peak hours except for several periods of 11.00 to 12.00
a.m. and 19.00 to 20.00 p.m. On the other hand, MLO exceeded the limit during evening peak hours
starting from 17.00 to 20.00 p.m. with the highest reading of 6.7 dBA recorded clearly discernible
changes. This finding is in agreement with previous studies of LAeq changes due to multiple vehicles
transited over raised TRS [2, 26] but less than 14 dBA [16-17].
5
ISCEE 2020 IOP Publishing
IOP Conf. Series: Materials Science and Engineering 1144 (2021) 012072 doi:10.1088/1757-899X/1144/1/012072
MO MLO RR Discernible Clearly Discernible
LAeq Chamges
8.0
6.0
(dBA)
4.0
2.0
0.0
07:00-08:00
08:00-09:00
09:00-10:00
10:00-11:00
11:00-12:00
12:00-13:00
13:00-14:00
14:00-15:00
15:00-16:00
16:00-17:00
17:00-18:00
18:00-19:00
19:00-20:00
20:00-21:00
21:00-22:00
Period (Hour)
Figure 9. 15-hour roadside noise level.
3.5. Permissible Noise Limits Comparison
Based on figure 10, it was also found that all sampling sites have exceeded the permissible LAeq limit of
60 dBA. On top of that, RR recorded the highest noise level of 74 dBA with maximum reading during
morning peak hours while the noise level at the roadway without RR is 71.9 dBA. MO with the readings
range from 69.9 to 74 dBA followed after the RR readings. Based on the measurement, except for several
higher readings during peak hours, MLO recorded the lowest noise level. Average LAeq for all readings
were found exceeded the permissible value of L90 + 10 dBA where RR shows the highest difference as
presented in figure 11. It is highly potential to cause TRS roadside noise annoyance among the nearby
residents. Furthermore, traffic noise exposure at suburban residential areas exceeded the permissible
noise exposure limit of 60 dBA as reported by a recent study [27]. Thus, TRS roadside noise may worsen
the actual traffic noise condition.
With MO Without MO With MLO Without MLO
With RR Without RR DOE Limit
75.0
LAeq (dBA)
70.0
65.0
60.0
55.0
07:00-08:00
08:00-09:00
09:00-10:00
10:00-11:00
11:00-12:00
12:00-13:00
13:00-14:00
14:00-15:00
15:00-16:00
16:00-17:00
17:00-18:00
18:00-19:00
19:00-20:00
20:00-21:00
21:00-22:00
Period (Hour)
Figure 10. Comparison of LAeq with a permissible limit of 60 dBA.
L90 + 10 dBA Average LAeq
L90 + 10 dBA
75.0 72.2
70.7 70.5
70.0 67.2 68.1
67.0 66.6
64.9 64.0 64.6
65.0 61.9
60.3
60.0
55.0
With Without With Without With Without
MO MLO RR
TRS Profile
Figure 11. Comparison of average LAeq with L90 + 10 dBA.
6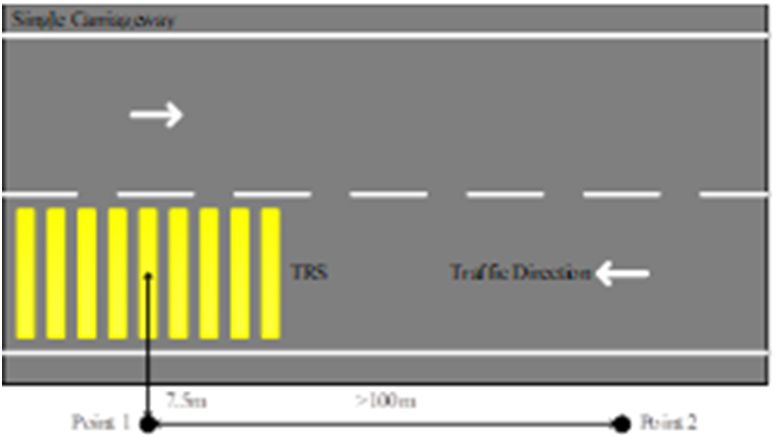
ISCEE 2020                                                                                                   IOP Publishing
IOP Conf. Series: Materials Science and Engineering          1144 (2021) 012072         doi:10.1088/1757-899X/1144/1/012072

3.6. Traffic Noise Index
Apart from previous assessment methods, TRS roadside noise was further assessed by using TNI as in
figure 12. All sites were found exceeded the TNI value of 74 dBA where RR recorder the highest
roadside noise levels for both with and without TRS of 117.5 dBA and 114.7 dBA, respectively.
Previous TRS studies were also reported higher values [16-17]. Apart from that, the measured TNI value
was obviously violated the specified TNI limit as reported by another related study [28]. Discernible
reading of calculated value and the limit showed that it has tendency to cause traffic noise annoyance to
the adjacent resident. The highest recorded value at RR may be due to high average speed at the sampling
site. On top of that, previous studies have also supported that high vehicle speed caused higher TNI
value of roadside noise level [29-30]. In this study, TNI values with and without MLO are lower than
MO where MLO recorded the lowest values of 77.4 dBA and 78 dBA for both with and without,
respectively.

                                             Measured TNI               TNI Limit of 74 dBA   117.5          114.7
                120.0
                100.0      89.2           83.3
   LAeq (dBA)

                                                           77.4                 78.0
                 80.0
                 60.0
                 40.0
                 20.0
                  0.0
                           With         Without            With              Without          With          Without
                                   MO                                  MLO                            RR
                                                                  TRS Profile

                                                 Figure 12. Traffic noise index.

4. Conclusions
All in all, MO, MLO and RR with 3 mm thickness are three most common TRS profiles installed on
roadways in Malaysia, especially Johor state. They are usually yellow coloured thermoplastic strips
which have variety of width, spacing, length and strip number. Basically, the design varies among the
districts or states due to the judgement of local authorities on detailed TRS characteristics. This study
found that TRS installation at residential areas has significantly increased the roadside noise level by
approximately 7 dBA due to MLO installation. It was clearly perceptible to adjacent residents, which
resulted in noise complaint. Other than that, all measured roadside noise levels have exceeded the
permissible noise limits. It shows that roadside noise exposure due to TRS installation have affect the
nearby residents in terms of noise annoyance. Therefore, this study may assist related authorities in
selecting suitable TRS profile for future TRS installation on roadways.

5. References

[1]              Datta T K, Gates T J and Savolainen P T 2012 Impact of Non-Freeway Rumble Strips - Phase 1
                    Final Report ORBP No. OR09084A (Michigan: Michigan Department of Transportation) pp
                    1
[2]              Othman M H 2016 Performance and Modelling of Transverse Rumble Strips on Noise and
                    Vibration Stimuli PhD Thesis (Johor Bahru: Universiti Teknologi Malaysia) pp 2
[3]              Webster D C and Layfield R E 1993 An assessment of Rumble Strips and Rumble Areas TRL
                    Report No. TRL-PR-33 (Berkshire: Traffic and Transport Resource Centre) pp 1
[4]              Yang L, Zhou H, Zhu L and Qu H 2016 Operational effects of transverse rumble strips on
                    approaches to high-speed intersections, Transp. Res. Rec. 2602 78–87
[5]              Liu P, Huang J, Wang W and Xu C 2011 Effects of transverse rumble strips on safety of pedestrian
                    crosswalks on rural roads in China, Accid. Anal. and Prev. 43(6) 1947–1954

                                                                   7
ISCEE 2020 IOP Publishing
IOP Conf. Series: Materials Science and Engineering 1144 (2021) 012072 doi:10.1088/1757-899X/1144/1/012072
[6] Thanasupsin K, Kulsol K, Nilkhet M and Srisurapanon V 2011 Effectiveness of thermoplastic
transverse rumble strips on a two-lane rural highway, Jour. of the East. Asia Soc. for Transp.
Stud. 9 1812–1822
[7] Lee J J, An D S, Lim J K, Kwon S A, Son H J and Eo M S 2013 Fundamental study of traffic
noise characteristic due to change transverse rumble strip shape, Adv. Mat. Res. 723 113–120
[8] Sabato A and Niezrecki C 2016 Rumble strips noise emission effects on urban road traffic, Proc.
National Conf. on Noise Control Engineering: Revolution in Noise Control (Rhode Island)
[9] Mainroads Western Australia 2017 Guideline Rumble Strips (Australia: The Government of
Western Australia) pp 7
[10] Public Works Department 2014 Manual Fasiliti Keselamatan Jalan (Kuala Lumpur: Public
Works Department Malaysia) pp 265
[11] Highway Planning Unit 2002 Traffic Calming Guidelines (Malaysia: Ministry of Works) pp 16
[12] Road Engineering Association of Malaysia 2004 Guidelines on Traffic Control and Management
Devices Part-4 Pavement Marking and Delineation (Kuala Lumpur: Road Engineering
Association of Malaysia) pp 10
[13] Lopez C A 2004 Pavement Marking Handbook (Texas: Texas Department of Transportation) pp
16
[14] Maryland State Highway Administration 2014 Guidelines for Application of Rumble Strips and
Rumble Stripes (Maryland: State Highway Administration) pp 20
[15] Boruff D 2019 Rumble Strips and Rumble Stripes Design Memorandum No. 19-01 (Indiana:
Indiana Department of Transportation) pp 8
[16] Haron Z, Othman M H, Yahya K, Yaacob H, Hainin M R and Mohd Yusof M B 2012 Noise
produced by transverse rumble strips: A case study on rural roadways, IOSR Jour. of Mech.l
and Civ. Eng. 1(5) 12–16
17] Haron Z, Othman M H, Yahya K, Hainin M R and Yaacob H 2013 The effect of application of
transverse rumble strips on traffic noise levels, Res. Jour. of Chem. and Env. 17(2) 13–18
[18] Clarkin M 2010 Rumble strips near roundabout to be removed Retrieved on March 2, 2020 from
http://archive.fo/WOXUu
[19] Terhaar E and Braslau D 2015 Rumble Strip Noise Evaluation Final Report No. MN/RC 2015-07
(Minnesota: Minnesota Department of Transportation) pp 1
[20] Aziz S Q, Lulusi, Asaari F A H, Ramli N A, Hamidi A A, Mojiri A and Umar M 2012 Assessment
of traffic noise pollution in Bukit Mertajam, Malaysia and Erbil City, Iraq, Caspian Jour. of
App. Sci. Res. 1(3) 1–11
[21] Sukeerth G, Munilakshmi N and Anilkumarreddy C 2017 Mathematical modeling for the
prediction of road traffic noise levels in Tirupati Town, Int. Jour. of Eng. Dev. and Res. 5(2)
2091–2098
[22] BSI 2001 BS EN ISO 11819-1: 2001 Acoustics-Measurement of the Influence of Road Surfaces
on Traffic Noise (Brussels: BSI) pp 10
[23] Department of Environment 2007 The Planning Guidelines for Environmental Noise Limits and
Control. (Kuala Lumpur: Ministry of Natural Resources and Environment Malaysia) pp 16
[24] Bahar G and Parkhill M 2005 Synthesis of Practices for the Implementation of Centerline Rumble
Strips Proc. Annual Conf. of the Transp. Assoc. of Canada (Alberta)
[25] Pimentel R L, Melo R A De and Rolim I A 2014 Estimation of increases in noise levels due to
installation of transverse rumble strips on urban roads, App. Acous. 76 453–461
[26] Darbyshire J L and Young J D 2013 An investigation of sound levels on intensive care units with
reference to the WHO guidelines, Critical Care 17 1–8
[27] Abdul Mutalib N H, Mashros N, Aminudin E, Zakaria R, Haron Z, Abd Talib M H and Abdul
Hamid A R 2018 Disturbance of traffic noise: evaluation on the effects and management on
road corridors IOP Conference Series: Earth and Environmental Science. 143 1–9
[28] Hashim M, Misran H F, Yazid S, Nasir N and Che Ngah M S Y 2014 Traffic noise analysis in
the school environment in Batu Pahat town, Johor, Malaysia, Geografi 2(2) 66–79
[29] Jamrah A, Al-Omari A and Sharabi R 2006 Evaluation of traffic noise pollution in Amman,
Jordan, Env. Mon. and Ass. 120 499–525
8ISCEE 2020 IOP Publishing
IOP Conf. Series: Materials Science and Engineering 1144 (2021) 012072 doi:10.1088/1757-899X/1144/1/012072
[30] Marathe P D 2012 Traffic noise pollution, IJED 9(1) 63–68
Acknowledgments
The authors would like to express their deep gratitude to the Ministry of Higher Learning (MOHE) and
Universiti Teknologi Malaysia (UTM) for providing the financial support through UTMFR
Q.J130000.2551.21H45 and GUP Q.J130000.2522.19H76 research grants.
9You can also read