CONSULTATION DRAFT Fin fish trawl (stout whiting) fishery harvest strategy: 2021-2026
←
→
Page content transcription
If your browser does not render page correctly, please read the page content below
Fin fish trawl (stout whiting) fishery
harvest strategy: 2021–2026
CONSULTATION DRAFT

                                         1|Page
Business Unit Owner Management & Reform
Endorsed by Deputy Director General (Fisheries & Forestry) in accordance with delegated
powers under Part 2, Division 1 (Harvest Strategies) of the Fisheries Act 1994
Approved by Minister responsible for fisheries in accordance with section 16 of the Fisheries Act
1994
Revision history Version no. Approval date Comments
1.0 September 2020 Draft harvest strategy for consultation
© State of Queensland, 2019
The Queensland Government supports and encourages the dissemination and exchange of its information. The copyright in this
publication is licensed under a Creative Commons Attribution 4.0 International (CC BY 4.0) licence.
Under this licence you are free, without having to seek our permission, to use this publication in accordance with the licence
terms.
You must keep intact the copyright notice and attribute the State of Queensland as the source of the publication.
Note: Some content in this publication may have different licence terms as indicated.
For more information on this licence, visit https://creativecommons.org/licenses/by/4.0/.
The information contained herein is subject to change without notice. The Queensland Government shall not be liable for technical
or other errors or omissions contained herein. The reader/user accepts all risks and responsibility for losses, damages, costs and
other consequences resulting directly or indirectly from using this information.
2|PageWhat the harvest strategy is trying to achieve
This harvest strategy has been developed to manage the harvest of Queensland’s stout whiting resource.
The stout whiting stock level is currently assessed as sustainable, with biomass estimated to be above
biomass associated with maximum sustainable yield. The risk of fishing on sustainability is considered low
due to the existing management framework and the low number of operators with access to the fishery.
While stout whiting is the target species in the fishery and constitutes the majority of harvest, a handful of
other species are permitted to be taken, with some catch limits in place.
This harvest strategy aims to manage fishing mortality by setting sustainable catch limits at a level that
allows the target stock to rebuild to its biomass targets. For all other retained species catch triggers have
been designed to monitor changes in fishing behaviour or stock trends to allow for detection of any change
in catch compared to historical levels.
Fishery overview
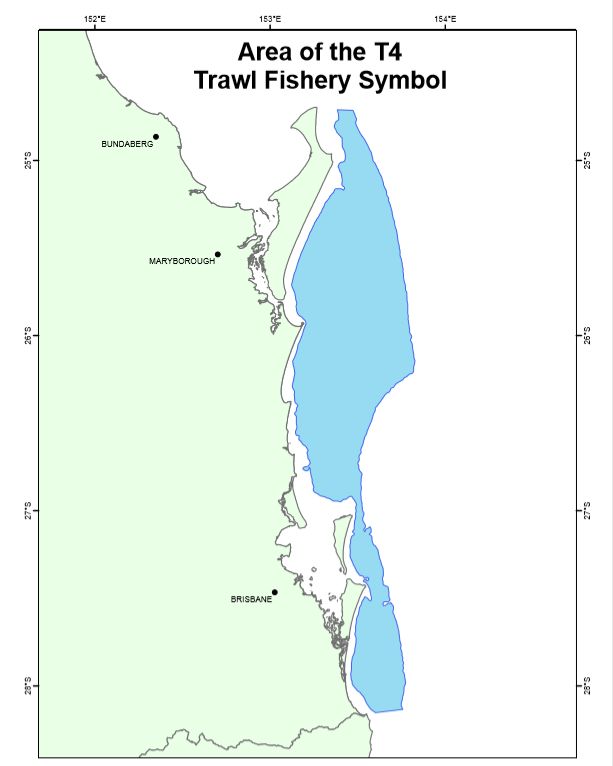
The fin fish trawl fishery (FFTF) targets stout whiting (Sillago
robusta) in water depths inside 50 fathoms between Sandy
Cape and the Queensland-New South Wales border. The
fishery is also permitted to retain other by-product species
such as Red Spot Whiting (Sillago flindersi), Yellowtail scad
(Trachurus novazelandiae) and Goatfish (Mullidae family), with
trip limits currently in place. It is a limited-access fishery with
five T4 licences currently operated by two licence holders: one
using Danish seine gear and the other using otter trawl nets.
There is no recreational harvest of stout whiting, however,
recreational fishers do catch yellowtail scad as a bait species.
Stout whiting is a bycatch species in the eastern king prawn
trawl fishery, which is likely to be a large source of fishing
mortality.
The fishery has been managed under a Total Allowable
Commercial Catch (TACC) since 1997. Annual assessments
monitor trends in fish catch rates (compared to a five-year
average reference point) to set the TACC for the following year
based on maximum sustainable yield. Catch-at-age frequencies
were also assessed against management reference points until
2016. Historical commercial catch peaked at 2400t in 1995, when five boats were active in the fishery,
before dropping to a historical low of 300t in 2003. Since 2017 the TACC has been around 1100t and catch
has stabilised to between 800-1100t.
Between 2017-2020 permit conditions restricting the season length in the areas north and south of Cape
Moreton were trialled. The fishery was open south of Cape Moreton between 1 April and 20 September to
avoid conflict with the main east coast trawl fleet (operating under T1, T2, M1 and M2 symbols). North of
Cape Moreton was open from 1 November to 20 September each year. The permit trial also allowed fishing
within the 20 fathom contour line to a distance of 1nm off the shore. The trial resulted in increased catch
rates which lead to the 2019 quota (1106t) being fully fished for the first time in many years. The trial
3|Pageconditions ceased in mid-2020 and are being reconsidered for introduction to the legislation. All other
existing trawl closures and marine park closures either apply to T4 licence holders either through legislation
or voluntary action.
Fish stocks covered by the harvest strategy
While stout whiting are the primary target species, this harvest strategy also manages a number of other
permitted species that can be retained while operating under a T4 licence. Table 1 provides a summary of
fish stocks covered under this harvest strategy.
Stout whiting (Sillago robusta) are a species endemic to Australian waters. The east coast stock is restricted
to southern Queensland and northern New South Wales. Genetic analysis of stout whiting catches from
southern Queensland locations indicates that biological sub-stocks are unlikely to exist.
There are two management units for the east coast stout whiting stock. One in Queensland that is managed
by Fisheries Queensland and another in New South Wales that is managed by NSW Department of Primary
Industries. Currently approximately 80 per cent of the annual catch comes from Queensland and 20 per cent
from New South Wales. This harvest strategy manages only the Queensland part of the stock, but
information from both jurisdictions informs management decisions and is included in stock assessments.
Table 1: Summary of fish stocks covered by this harvest strategy
Feature Details
Target species The TACC is for permitted whiting which includes stout whiting (Sillago robusta) and red
spot whiting (Sillago flindersi). The majority (>99%) of the harvest is stout whiting.
Secondary Yellowtail scad (Trachurus novaezelandiae)
commercial Goatfish (Family Mullidae)
Other species Permitted trawl species:
• Pinkies (Family Nemipteridae)
• Octopus (Octopus sp.)
• Cuttlefish (Metasepia sp., Sepia spp.)
• Squid (Loliolus sp., Notodarus spp., Photologio spp., Sepioteuthis spp.)
• Balmain bugs (Ibacus spp.)
• Moreton Bay bugs (Thenus spp.)
Biology Stout whiting live to a maximum of 8 years reaching 23cm (FL). 50% maturity is reached at
2-3 years, corresponding 14-18cm (FL). Peak spawning season is thought to occur between
September and November each year however data suggests stout whiting may have several
spawning periods per season.
4|PageManagement units for this harvest strategy
The management unit for this harvest strategy is as defined by the Fisheries (Commercial Fisheries)
Regulation 2019 and by conditions under the General Fisheries Permits issued to each of the licences:
The fishery area consists of the area of all tidal waters within the following boundary:
• from latitude 28°09.24' south, longitude 153°34.2' east, in a north-easterly direction to latitude
28°03.96' south, longitude 153°46.32' east;
• then along the 50 fathom depth contour to east of Sandy Cape, Fraser Island;
• then west to the 20 fathom depth contour;
• then along the 20 fathom depth contour to latitude 28°09.24' south, longitude 153°34.2' east.
Fishery summary
A summary of the management arrangements for the Fin Fish Trawl Fishery are set out in table 2. Fishers
should consult the relevant fisheries legislation for the latest and detailed fishery rules or visit
www.fisheries.qld.gov.au.
Table 2: Summary of management arrangements for the Fin Fish Trawl Fishery
Feature Details
Commercial Fisheries Primary Commercial Fishing Licence with a “T4” fishery symbol
symbol
Relevant fisheries Fisheries Act 1994
legislation
Fisheries (General) and (Commercial Fisheries) Regulations 2019
Fisheries Declaration 2019
Fisheries Quota Declaration 2019
Other relevant Great Barrier Reef Marine Park Act 1975 and Regulation 2019
legislation
Marine Parks Act 2004
Environment Protection and Biodiversity Conservation Act 1999 and Regulation 2000
Workshop An annual workshop is held with the two active operators
Gear Otter Trawl or Danish Seine apparatus may be used.
Otter trawl restrictions include:
• maximum total net length (combined head rope, bottom rope and all other rope
attached to the net) of 88m
• maximum sweep length of 128m each
• minimum mesh size of 38 millimetres (mm)
• maximum vessel length of 20m
• turtle excluder devices on all otter trawl nets
5|PageDanish seine restrictions include:
• haul ropes must not be longer than 2500m
• maximum vessel length of 25m
• no turtle excluder device is required
Main management • Individual Transferable Quota (ITQ) units issued for each commercial stout
methods whiting fishing symbol
• Total Allowable Commercial Catch for stout whiting
• Non-transferable annual catch quota for yellowtail scad and goatfish
• In-possession limits (trip limits) for cuttlefish, squid, pinkies and octopus
• Prior notices and unload notices via the Automated Integrated Voice Response
(AIVR) system are required
• Spatial closures
• Temporal closures
• Gear restrictions
Fishing year 1 January – 31 December
Stock Status Stout whiting are listed as ‘Sustainable’ by SAFS 2016
https://www.daf.qld.gov.au/business-priorities/fisheries/monitoring-
compliance/data/sustainability-reporting/stock-status-assessment
Australian fish stocks (SAFS) www.fish.gov.au
*Note the classification system used as part of the SAFS reporting is assessed against a 20% biomass sustainability criteria.
Therefore, although a species may be classified as ‘sustainable’ in SAFS, this does not mean that the biomass is meeting the targets
set out in the Sustainable Fisheries Strategy 2017-2027.
Accreditation under the Part 13: Accredited (expires 2020)
Environment Protection
Part 13A: Accredited (expires 2020)
and Biodiversity
Conservation Act 1999 https://www.environment.gov.au/marine/fisheries/qld/east-coast-otter-trawl
6|PageFishery objectives
Fishery objectives set out the aspirations and operational direction for the management of this fishery.
• Maintain the target species at, or return to, a target spawning biomass level that aims to maximise
economic yield for the fishery.
While:
• Minimising and mitigate high ecological risks arising from fishing-related activities
• Monitoring the social and economic benefits of the fishery to the community
• Maximising profitability for the commercial sector
• Ensuring fisheries management is meeting the expectation of stakeholders
Catch shares
This harvest strategy aims to maintain the existing catch shares between sectors. The resource allocation
arrangements are set out in Table 3 below to ensure that catch shares among sectors are maintained in
response to changes in the total allowable catch. The existing resource allocation arrangements (as at 2019)
are set out in Table 3.
Aboriginal and Torres Strait Islander peoples traditional fishing rights are protected under native title
legislation and relate to harvest for domestic, communal and non-commercial purposes. Accordingly,
traditional and customary fishing is not a defined allocation.
Aboriginal and Torres Strait Islander peoples desire more economic opportunities through fishing,
particularly in their own sea country. In line with the Indigenous Commercial Fishing Development Policy, an
Indigenous Fishing Permit may be issued on a case by case basis in accordance with section 54 of the
Fisheries (General) Regulation 2019, to provide opportunities for communities to take part in fishing-related
business.
Table 3: Resource allocation arrangements for the Commercial Fin Fish Trawl Fishery
Species Commercial Fishing@ Recreational Fishing (including
charter)*
Prescribed whiting 99% 1%
@ Commercial catch data is based on the existing commercial catch level.
Managing performance of the fishery
Biomass based performance indicators and reference points for target species
Key indicators measure how healthy the fishery is performing. The indicators relate to the objectives, and
use reference points to establish acceptable performance (Table 4). The indicators measure the relative
amount of fish biomass of key stock(s) against target and other reference points. The default biomass-
reference-points identified in this harvest strategy are:
• A target reference point (Btarg) of 60% of the unexploited spawning biomass (for key target species)
being the relative biomass level the harvest strategy aims to achieve. This is also considered a proxy
measure of Bmey for the purposes of this harvest strategy;
7|Page• A limit reference point (Blim) of 20% of the unexploited spawning biomass being the level that the
harvest strategy aims to avoid. If the stock is assessed to be below Blim the risk to the stock is
unacceptably high and the stock is defined as “depleted”.
For key stocks in this fishery, performance indicators and sustainable harvests for all sectors will be
estimated from a stock assessment every three years. The aim is to measure the capability for the stock to
attain the target biomass level (Btarg 60%), and at which point the harvest strategy will be considered as
meeting its fishery objectives.
The decision rules for setting a sustainable harvest in the fin fish trawl harvest strategy are based on a
‘hockey stick’ approach. This is where the TAC is set based on a linear relationship between Blim, where the
level of fishing mortality (F) is equal to zero, and Btarg where the exploitation rate and TAC is set at the level
to achieve MEY (Figure 1). The decision rule takes into account the current biomass level of the stock for
determining the TAC to achieve the Btarg. The recommended TAC is calculated by applying the rate of
fishing mortality to achieve Btarg to the current spawning biomass level. As a result, the recommended TAC
represents the total catch from all sectors (including discards) that can be harvested in the next two years, to
move the current biomass level towards the target level.
If the spawning biomass falls below the limit reference point (Blim 20%), there will be no more targeted
fishing of the stock until a rebuilding strategy is developed to increase the spawning biomass above the limit
within one generation (where a generation is defined as the average age of full maturity for the fish species,
or 3-4 years for stout whiting). These reference points are guided by information set out in the Queensland
Harvest Strategy Policy and Guidelines.
Figure 1: showing the “hockey stick” rule, Blim is limit reference point, Bmey is the biomass at MEY, B0 is the unfished
biomass at 100%, F is fishing mortality and Ftarg is the level of fishing mortality for Bmey.
Secondary performance indicators and reference points for target species
For years where updated biomass estimates are unavailable for stout whiting the TAC will be assessed and
managed using the secondary performance indicator of standardised commercial catch per unit effort
(sCPUE). The reference points for the sCPUE component of the decision rules are based on the average catch
rate during a reference period of 2010 and 2015. This reference period represents years of profitable fish
catch rates and stable years of fish survival greater than the fraction for twice the assumed natural mortality.
By aligning the target reference points to a reference period the harvest strategy aims to rebuild stocks to
the biomass during this reference period as a proxy for maximum economic yield (or Btarg).
8|PageThe target reference point for stout whiting sCPUE has been calculated based on the average of commercial
catch rates during the reference period (Table 4). If the stock is operating at target levels it is deemed to be
achieving the fishery objectives and operating at an acceptable level. These decision rules have been
undergone management strategy evaluation to confirm their suitability.
Management of secondary commercial and by-product species
For secondary and by-product species where the primary performance indicator (biomass) is not available,
triggers reference points will manage levels of fishing mortality:
• If the annual commercial harvest is above historical maximum harvest levels (from the defined
reference years) for two consecutive years
Annual harvest levels for secondary and by-product species are assessed against a reference period to detect
changes in fishery behaviour that may represent an unacceptable risk. A fixed reference period from 2010-
2019 has been defined for secondary and by-product species in the fishery. This reference period represents
a stable period of operation where catch, effort and active licences were stable. As the level of exploitation
increases above historic levels, species may be elevated to higher levels of monitoring, assessment and
management.
Table 4. Performance indicators and reference points for the FFTF
Species Performance indicator Reference point / buffer Reference level
Stout Whiting Spawning Biomass Target (Btarg) 60% spawning biomass
Stout Whiting Spawning Biomass Limit Reference Point (Blim) 20% spawning biomass
Stout Whiting Standardised Target reference point 2010 - 2019avg. catch
commercial catch rate proxy for B60 rate
Secondary and byproduct Biomass Target (Btarg) 60% biomass
species
Secondary and byproduct Biomass Limit Reference Point (Blim) 20% biomass
species
Secondary and byproduct logbook catch Catch trigger - reference 2010-2019 maximum
species period annual catch
9|PageManagement of target species
Biomass based decision rules for target species
The decision rules provide guidance to set the TACC based on estimates of biomass being available. The
decision rules use the outputs of the stock assessment and aim to achieve a target biomass (Btarg) of 60%.
_________________________________________________________________________________
1.1. If the biomass is at or above Btarg, set the TACC at a level that maintains biomass at Btarg.
1.2 If biomass is below Btarg and above Blim, the TACC should be set as inferred by the hockey stick
approach, where fishing mortality is reduced to the rate that allows the biomass to increase
effectively back to Btarg.
1.3 If biomass is below Blim, there will be no further targeted fishing for that species, and a rebuilding
strategy will be developed to increase the stock biomass to above Blim within one generation.
1.4 If any new information becomes available indicating that the assessment and TACC-setting
arrangements are not consistent with the sustainable management of the fishery, decision rules must
be reviewed and, if appropriate, the reference points or timeframes should be adjusted.
Notwithstanding that:
1.5 The rate of fishing mortality should not exceed that required to achieve Btarg (i.e. F60);
1.6 The TACC should not exceed the level of fishing mortality required to maintain a stock at B60.
________________________________________________________________________________________
Decision rules for standardised catch rate adjustments between stock assessment years
2.1 If the average CPUE of the two most recent years is above the target reference point, then the TACC
will be increased proportional to the difference between the average CPUE and pooled index.
2.2 If the average sCPUE of the two most recent years is below the target reference point, then the
TACC will be decreased proportional to the difference between the average sCPUE and pooled index.
2.3 If and when any new information becomes available indicating that the assessment and TACC-
setting arrangements are not consistent with the sustainable management of the fishery, the
scientific method and review rules must be reviewed and, if appropriate, the reference points must
be adjusted.
Notwithstanding that:
2.4 The TACC should not exceed the level of fishing mortality required to maintain a stock at B60.
2.5 If the catch rate index is 40% or more below the reference point index, determine why the decline
occurred and whether further management intervention is required to reduce the risk to the stock.
_________________________________________________________________________________
Management of secondary and by-product species
Decision rules for secondary and by-product species
The following harvest control rules are to ensure that fishing does not result in unacceptable levels of fishing
pressure on secondary and by-product species including pinkies, octopus, cuttlefish, squid, Balmain bugs and
Moreton Bay bugs. The harvest strategy also includes rules to allow management arrangements to be
implemented if an updated biomass estimates becomes available.
__________________________________________________________________________
10 | P a g e3.1 If the annual commercial harvest of any species is less than the 2010 – 2019 maximum annual
harvest (i.e. 16t for yellowtail scad, 4t for goatfish, 14t for pinkies, 2t for octopus, 2t for cuttlefish, 4t
for squid, 1t for Balmain bugs and 2t for Moreton Bay bugs), then no management action is
required.
3.2 If the annual commercial harvest of any species is greater than of the 2010 – 2019 maximum annual
harvest for two consecutive years, undertake a review of the trigger and implement management
changes for the following season to ensure harvest of the species does not increase more than 20%
above the upper catch range until a review is completed (e.g. trip limits, size limits or
spatial/temporal closures). If the review identifies sustainability of a species is at risk, permanent
changes to management arrangements such as those detailed above may be implemented and a
stock assessment for this species is required within 3 years.
__________________________________________________________________________
Break out rules
4.1 Where a stock assessment becomes available for secondary species that indicates a reduction in
fishing mortality is required in order to achieve a Btarg (60%) or avoid Blim (20%) reference points,
then management action will be undertaken (e.g. trip limits, size limits or spatial/temporal closures) to
rebuild the stock.
___________________________________________________________________________
Minimising ecological risks from fishing
The foundation of sustainable fisheries management is managing the impact of fishing activities on non-
target species and the broader marine ecosystem. Ecological Risk Assessments (ERA) identify and measure
the ecological risks of fishing activity and identify issues that must be further managed under harvest
strategies. The below decision rules are in place to minimise and mitigate high ecological risks arising from
fishing related activities.
________________________________________________________________________________________
5.1 If an ERA identifies fishing impacts that are considered to generate an undesirable level of risk to any
secondary or byproduct species’ populations, (i.e. high risk) a review is triggered to investigate the reason
for the increased risk. Appropriate management action should be taken to reduce the risk to an acceptable
level.
__________________________________________________________________________________
The most recent ERA was completed in 2020. Most ecological components were assessed to be of low or
negligible risk. The components which received a higher risk rating are:
• Bycatch (non-SOCC) was assessed with an intermediate risk rating and will be progressed through the
Monitoring and Research Plan.
• Batoids were assessed with an intermediate risk rating and will be progressed through the Monitoring
and Research Plan.
• Sharks were assessed with a low/intermediate risk rating and will not be progressed further.
• Marine habitats were assessed with a low/intermediate risk rating and will not be progressed further.
The relevant ERA is published online at http://era.daf.qld.gov.au/id/eprint/7064/1/ERA%20-
%20Stout%20Whiting%20Level%201%20%5BFINAL%202020%5D.pdf.
11 | P a g eFisheries Queensland’s Ecological Risk Assessment Guideline is published online at
https://www.daf.qld.gov.au/business-priorities/fisheries/sustainable-fisheries-strategy/ecological-risk-
assessment-guidelines.
Future risk assessments will be undertaken periodically to reassess any current or new issues that may arise
in the fishery. Risk assessments can be undertaken more frequently if there are significant changes identified
in fishery operations, management activities or controls that are likely to result in a change to previously
assessed risk levels.
Monitoring the social and economic performance
The Sustainable Fisheries Strategy outlines the target to set sustainable catch limits based on achieving MEY,
usually around 60% of unfished biomass, to support the most economically efficient use of the resource,
improve the fishing experience for all sectors and promote a resilient system that can bounce back from
other adverse environmental conditions (e.g. floods, cyclones and bleaching). The harvest strategy rules
have been set up to maintain the stock to this target biomass level.
The objectives and performance indicators in Table 5 will be used to support the social and economic
performance of this fishery. The management options outlined are intended to provide some guidance on
the options that could reasonably be considered if fishery trends are of concern.
Table 5: Social and economic indicators for the Southern Inshore Trawl Fishery
Objective Performance indicators Management actions
Maximising profitability for the Potential indicators to monitor include: Consider regulatory and non-
commercial sector regulatory options to address
• Capacity utilisation
relevant issues. Adjust
• Costs, earnings and net financial
management as needed.
economic profit
• Profit decomposition to determine Option/s could include reviewing
impacts of prices, costs and opening/closing times or spatial
stock/catch rates on changes in closures to maximise profitability.
profits
Monitor the broader social and Potential indicators to monitor include: Consider regulatory and non-
economic benefits of the fishery to regulatory options to address
• Fisher satisfaction with their fishing
the community relevant issues. Adjust
experience
management as needed.
• Percent of total costs/inputs
purchased from local businesses and
residents
• Income generated (crew plus profit –
gross value added)
• Proportion of catch sold locally
• Fish prices
• Community satisfaction (with their
fisheries and the way in which they
are managed)
12 | P a g eMonitoring and assessment
The catch and effort data required to inform the take of permitted species is obtained through commercial
logbook returns. The T4 fishery logbook is at https://www.business.qld.gov.au/industries/farms-fishing-
forestry/fisheries/monitoring-reporting/requirements/logbooks.
The catch and effort data required to determine the standardised commercial catch rate for key species are
obtained from catch and effort logbook returns, unload notices and vessel tracking data. Commercial catch
rates are standardised according to gear, season and location along with a range of other potential
influencing variables.
Information and research priorities
Key information and research priorities have been identified in Table 6 to help meet the objectives of this
harvest strategy. These will be updated as required.
Table 6: Information and research priorities for the FFTF
Project description Explanation of Need Priority
Bycatch Reduction Device (BRD) To support continued innovation of BRDs to High
testing and evaluation program to reduce fishery bycatch
support continued innovation
Schedule of performance assessment and review
The fishery’s performance will be reviewed against this harvest strategy annually. This review will include an
annual workshop for fishery stakeholders to provide operational advice on the fishery’s performance and
any matters that may need addressing. The primary performance measure will be spawning biomass, which
will be reviewed every three years, with a review of standardised catch rate information in intervening years.
Table 7 summarises the key review and decision points for this fishery.
Table 7: Schedule of performance assessment and review
Year 1 Year 2 Year 3 Year 4 Year 5
Assessment Modelled Standardised Standardised Modelled
Program stock catch rate catch rate stock
assessment monitoring monitoring assessment
Management Review TACC, Adjustment Adjustment Review TACC, Harvest
Program reference of TACC for of TACC for reference Strategy
points & standardised standardised points & Review
fishing rules catch rate, if catch rate, if fishing rules
required required
The above schedule outlines the expected timeframes for assessment information to be available to inform
management action. There may be instances where an assessment may need to be available prior to, or may
13 | P a g ebe delayed beyond the scheduled date. Any change to the schedule should be considered by the workshop
and decided on by the chief executive based on the below conditions:
• If during the period between scheduled stock assessments the chief executive is concerned that a
performance indicator (e.g. stock status, standardised commercial catch rate, total harvest) suggests the
stock is not performing in a way that will achieve the target biomass level, the chief executive may
decide that a stock assessment will be undertaken before the scheduled timeframe.
• If the chief executive is satisfied that: (1) indicators for the stock suggest it is achieving, or rebuilding to,
target biomass levels, and that there is a low ecological risk to the stock under the current management
arrangements; or (2) if resourcing requirements prohibit the ability for an assessment to be delivered in
the scheduled timeframe, the chief executive may decide that a scheduled stock assessment will be
delayed.
Schedule of review
The fishery’s performance will be reviewed annually against this harvest strategy.
While harvest strategies provide certainty and transparency in terms of management decisions in response to
fishery information, there has to be flexibility to allow new information or changing circumstances to be
considered. This harvest strategy will remain in place for a period of five (5) years, after which time it will need
to be fully reviewed.
The harvest strategy may also be subject to further review and amendment as appropriate within the five-
year period if the following circumstances arise:
• There is new information that substantially changes the status of a fishery, leading to improved estimates
of indicators relative to reference points; or
• Drivers external to management of the fishery increase the risk to fish stock/s; or
• It is clear the strategy is not working effectively and the intent of the harvest strategy policy is not being
met.
Further explanation and information on the processes for amending harvest strategies can be found in the
Queensland Harvest Strategy Policy and Guidelines, published at https://www.daf.qld.gov.au/business-
priorities/fisheries/sustainable-fisheries-strategy/harvest-strategy.
14 | P a g eYou can also read