Biomass Conversion On the cusp of commercialization
←
→
Page content transcription
If your browser does not render page correctly, please read the page content below
Biomass Conversion
On the cusp of
commercialization
Sebastian Søderberg,            João Alberto F. de Abreu,
Vice President Biomass          Executive Director Agroindustrial,
Conversion, Novozymes           Raízen

Claus Crone Fuglsang,
Vice President R&D, Novozymes
Forward-Looking Statements

This presentation and its related comments contain forward-looking statements, including statements about future events,
future financial performance, plans, strategies and expectations. Forward-looking statements are associated with words
such as, but not limited to, "believe," "anticipate," "expect," "estimate," "intend," "plan," "project," "could," "may," "might"
and other words of similar meaning.

Forward-looking statements are by their very nature associated with risks and uncertainties that may cause actual results
to differ materially from expectations, both positively and negatively. The risks and uncertainties may, among other things,
include unexpected developments in i) the ability to develop and market new products; ii) the demand for Novozymes’
products, market-driven price decreases, industry consolidation, and launches of competing products or disruptive
technologies in Novozymes’ core areas; iii) the ability to protect and enforce the company’s intellectual property rights; iv)
significant litigation or breaches of contract; v) the materialization of the company’s growth platforms, notably the
opportunity for marketing biomass conversion technologies or the development of microbial solutions for broad-acre crops;
vi) the political conditions, such as acceptance of enzymes produced by genetically modified organisms; vii) the global
economic and capital market conditions, including, but not limited to, currency exchange rates (USD/DKK and EUR/DKK in
particular, but not exclusively), interest rates and inflation; viii) significant price decreases on input and materials that
compete with Novozymes’ biological solutions. The company undertakes no obligation to update any forward-looking
statements as a result of future developments or new information.

2

Session outline

• Progress and challenges
  last 18 months
• Reasons to believe in biomass
  conversion
• Innovation priorities
• Raízen: Views from leading
  brazilian sugar cane crusher
  and biomass conversion
  pioneer

3

15 years of continuous development and one
of our largest R&D investments

2001                                           2005                                   2009               2012                       2013                    2015

 One of largest R&D                 Biomass conversion                     Launch of Cellic®      The first commercial       Exclusive partnership   Five of seven large
 investments in                     pilot plants worldwide                 CTec for the first     cellulosic ethanol         with Brazil’s largest   scale biomass
 Novozymes’ history                 testing Novozymes                      cellulosic ethanol     plant: Crescentino –       sugar-based ethanol     conversion ethanol
 was initiated                      enzymes                                demonstration plants   using Novozymes’           producer                plants globally use
                                                                                                  Cellic® technology                                 Cellic® technology

       Foundation                            Pilot stage                           Demo stage                   Initial commercial stage               Optimization stage

 4      Business Development – BioAgriculture – Biomass Conversion – Animal Health & Nutrition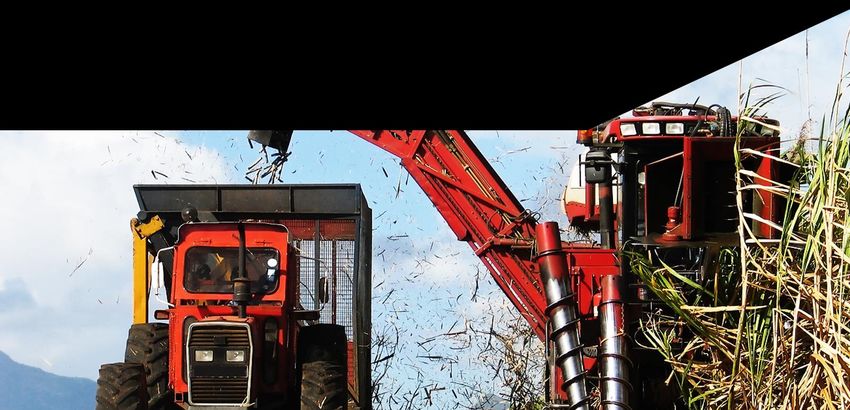
Progress towards commercialization since
Capital Markets Day 2013
    Biomass conversion industry in fall 2013                                                      Biomass conversion industry today

    •   Beta Renewables’ Crescentino plant is the world’s first                                   •   Six commercial plants are in operation with Novozymes
        and only commercially operating cellulosic ethanol plant                                      supplying five of them. DuPont to be #7
    •   Three plants under construction in the US and two in LA                                   •   All process steps undergoing optimizations
    •   Large number of publicly announced biomass conversion                                     •   20+ solid biomass conversion projects are under
        projects                                                                                      development globally (not all publicly announced)
    •   Expectation of a relatively fast industry commercialization                               •   Recognition that industry commercialization will take
                                                                                                      longer
    •   Novozymes’ Cellic® CTec3 is the leading enzyme
        technology (one size fits all enzyme product)                                             •   Novozymes is committed to pursue further process
                                                                                                      optimizations beyond enzymes. Our customized next
                                                                                                      generation Cellic® enzyme solutions are being launched
                                                                                                  •   Novozymes heavily engaged in project development with
                                                                                                      “boots on the ground” globally

5        Business Development – BioAgriculture – Biomass Conversion – Animal Health & Nutrition
Headwinds and longer timelines than anticipated, but
several reasons lead us to believe that these will be overcome
    Prolonged industry ramp-up
                                                                                                  •   New industries take time
    •   Up-scaling of commercial plants takes longer than                                             – it’s a marathon, not a sprint
        expected. From serving 15 plants by 2017 to an
        assumption of ~15 by 2020                                                                 •   Many industries deliver lower Capex over time
    •   New projects struggle to find financing, as everyone is                                   •   Novozymes as a full biotech solutions provider to bolster
        in waiting mode to get confirmation of the economics                                          biomass conversion process optimization
    •   Some projects have been cancelled or on hold                                              •   Healthy project pipeline continues to mature

    Macro and regulatory uncertainty
                                                                                                  •   Expectation that internal combustion engines / liquid
    •   Lower oil price casts uncertainty and makes for a                                             fuels will play a substantial role in the future
        tougher environment for biofuels – particularly in the
        US and Asia                                                                               •   National blending mandates in the EU
                                                                                                      (Italy announced, more in the making)
    •   US ethanol demand stuck in limbo due to the blend
        wall and unclear regulatory framework                                                     •   Brazil ethanol blending mandate increase to E27

6        Business Development – BioAgriculture – Biomass Conversion – Animal Health & Nutrition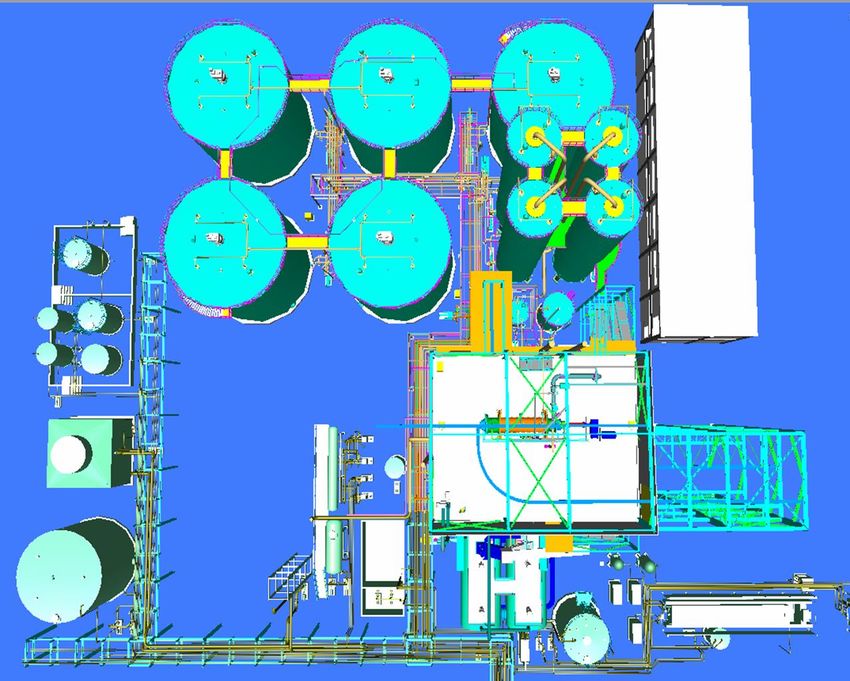
Comparable disruptive technologies have taken 15+ years to take off;
enabling an industry is a “marathon” with multiple hurdles to be overcome
    Corn ethanol                                                                                                                 Solar
    Installed corn ethanol capacity (U.S.), 1990–2014                                                                        Global solar power cumulative installed PV capacity 2000–2012
    Million gallons/year                                                                                                     MW
                                                                                              +4%                                 120,000
     15,000
                                                                                                                                   100,000
                                                                                                                                    80,000                                                             +57%
     10,000                                                                 +29%
                                                                                                                                    60,000
      5,000                           +9%                                                                                           40,000
                                                                                                                                                              +31%
                                                                                                                                    20,000
             0                                                                                                                           0
                 1990     92     94    96     98     2000       02     04     06     08     10     12    2014                                2000   01   02    03    04    05        06    07    08    09    10    11   2012

      Shale gas                                                                                                                  Wind
    Gas production from shale gas                                                                                            Global cumulative installed wind capacity 1996–2013
    Billion cubic feet per day                                                                                               MW
                                                                                                                                 350,000
       30
                                                                                                                                 300,000                                                               +23%
       25                                                                                                                        250,000
                                                                            +38%
       20                                                                                                                        200,000
       15                                                                                                                        150,000
                                                                                                                                                               +27%
       10                      +25%                                                                                              100,000
         5                                                                                                                         50,000
         0                                                                                                                              0
          2000 01         02     03      04     05     06     07      08     09      10     11      12    2013                               2000   01   02   03    04    05    06    07    08    09    10    11   12    2013

Source: US Renewable Fuels Association (annual capacities) after 1999 and SRI (from 1990); Industry reports; McKinsey analysis

7            Business Development – BioAgriculture – Biomass Conversion – Animal Health & Nutrition
Significant learnings in first biomass conversion plants and the example of the US 1G
industry suggest that Capex will reduce for the next wave of biomass conversion plants

Major reasons for reduced Capex:                                                                            Capex development over time
                                                                                                            Example: 1st generation corn ethanol plants in the U.S.
• Optimized plant and process design
                                                                                                                                     500
  including less over-engineering
• Bolt-on solutions use existing                                                                                                     400

                                                                                                            Capex, USD (2005) / m3
  infrastructure and utilities
                                                                                                                                     300
• Development of standard modules
                                                                                                                                                                                                      1981
                                                                                                                                     200
                                                                                                                                                                                                      1985

                                                                                                                                     100
                                                                                                                                                                                                      2001

                                                                                                                                       0
                                                                                                                                           50   100   150   200     250     300    350     400      450
                                                                                                                                                        Plant production capacity 1,000 m3 / year

Source: Data: LeBlanc and Prato, 1982, Gavett et al.1986, Whims, 2002, Understanding the reductions In US
corn ethanol production costs

8          Business Development – BioAgriculture – Biomass Conversion – Animal Health & Nutrition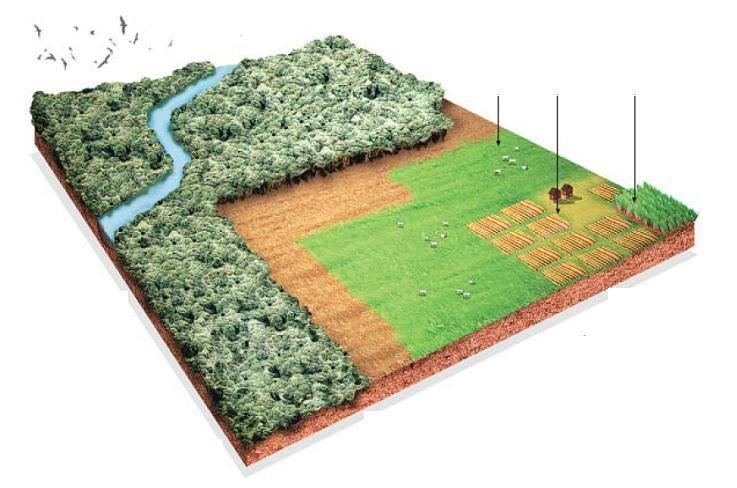
In spite of existing challenges, we see a solid project pipeline
that continues to mature across regions
While several biomass conversion Publicly announced, commercial biomass conversion
ethanol plants are already operating, projects under development by region (Q1/2015)*
more than 20 solid biomass conversion
projects are under development Project Italy
globally (not all publicly announced)
Project Alpha
Different business models:
• Co-marketing with Beta
Renewables
• Project development
Teck Guan
• Large strategic partners e.g.
Raízen Punjab
*Non-exhaustive
9 Business Development – BioAgriculture – Biomass Conversion – Animal Health & Nutrition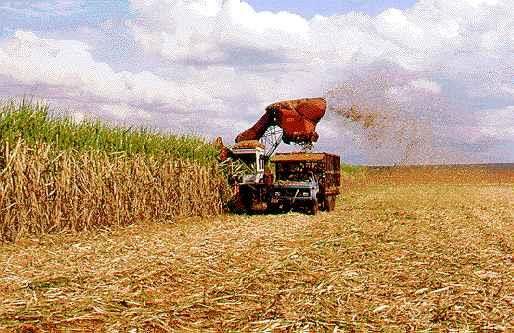
Major improvements in Novozymes’ enzyme technology have been a key enabler of
biomass conversion commercialization and will drive further plant optimization
100
80
Enzyme 60 Customized Cellic® enzyme
use costs technology: Further improvement is
develop- 40 achieved through customization of
ment 20 enzymes to match specific process
(indexed) and feedstock
0 Years
2007 2008 2009 2010 2012 2015 2018
Cellic® Cellic® Cellic® Customized
CTec CTec2 CTec3 Cellic® 1.0
Enzymes as a valuable tool:
Sweet-spot Sweet spot Sweet-spot optimized enzyme dosing
optimized optimized to get ensures the lowest unit cost of ethanol
enzyme the lowest unit cost. For example, improved enzyme
dosing performance has been shown to reduce
Pretreatment Enzyme Total solids Hydrolysis Biomass to sugar cost of ethanol
severity dosing loading time conversion the use of acid in pretreatment
10 Business Development – BioAgriculture – Biomass Conversion – Animal Health & NutritionNovozymes biotech solutions continue to bolster biomass conversion
process optimization and its competitiveness
• Novozymes launches new family of New customized Cellic® solutions and further process optimizations continue to
customized Cellic® enzymes reduce biomass conversion costs
tailored to reduce enzyme cost and
improve production performance
Cellulosic ethanol production costs
Pretreatment Hydrolysis Fermentation
• Ongoing optimization of all process
steps will further reduce production
costs
Cellic® CTec3 Customized Cellic® solutions Customized Cellic®
Customized Cellic® solutions
solutions
+ further +process
further optimizations
process e.g.
Note: Based on NREL acid pretreatment process yeaste.g. yeast
optimizations
11 Business Development – BioAgriculture – Biomass Conversion – Animal Health & NutritionCustomer-centric Novozymes Cellic® enzyme development
– tailored to the individual process and feedstock
• Diverging processes with different Biomass Pretreatment Biomass after pretreatment
feedstocks are being established at
industrial scale 100%
• For every combination of process Steam
and feedstock, there will be an 80% 0% 20% 40% 60% 80% 100%
optimal enzyme system
• Every enzyme system benefits from 60% Acid
0% 20% 40% 60% 80% 100%
optimization work
40%
Alkali
Energy 0% 20% 40% 60% 80% 100%
Bagasse crops 20%
Org. solvents
0% 0% 20% 40% 60% 80% 100%
Tailored
Corn Wheat
Cellic®
stover straw
solutions
Cellulose Hemicellulose Lignin
12 Business Development – BioAgriculture – Biomass Conversion – Animal Health & NutritionCustomized Cellic® enzyme solutions;
process, feedstock, temperature and pH
Key benefits vs. Cellic® CTec3
• Yield boost – Improved hydrolysis performance on xylan-rich Customized
substrates Cellic®
• Robust activity – Broader pH and temperature profiles provide
robust activity
• Contamination control – Higher hydrolysis temperature and
% conversion
Cellic® CTec3
lower pH inhibit contamination
• Lower OPEX – Reduced base consumption and waste treatment
costs
What’s next?
• Adapt customization to evolving partner processes
• Continue optimization efforts together with partners – to drive out
cost not only of enzymes but also of process and potential Capex
Enzyme-relative dose
13 Business Development – BioAgriculture – Biomass Conversion – Animal Health & NutritionE2G Program João Alberto F. de Abreu
Agenda Introduction to Raízen Raízen's strategy How 2G fits into this Current status on Raízen's 2G efforts Learnings from plant #1 (in broad terms) Obstacles to overcome for the industry/Raízen Opportunities and plans for the future
Raízen

 Lubrificantes

                                         Cosan Lubrificantes e
                                         especialidades

                 Downstream   Upstream
Business dimensions World’s largest sugar producer and Brazil’s largest sugarcane ethanol producer 915,000 ha 2 bi liters 4 m tons of cultivated area of ethanol of sugar 96% 941 MW mechanized harvesting of installed capacity
Fuel distribution
A highly efficient and reliable network

5245         Retail stations              58 Airports bases
  910        Convenience stores            23,6 Billion m³
   60        Distribution depots
19

  Raízen – general numbers in 2013/14
    World cane crushing (mln t)

     1º           Brazil    640   5º              61,4

     2º            India    240   6º   Mexico            58

     3º          Thailand   110   7º   Pakistan          50

     4º           China     100   8º   Australia         32

* Source: LMC.
Ethanol, sugar and bioenergy
Strategic drivers
Aspiration:
Lower cost of production per sugarcane tones
Cost reduction
ROACE
Productivity X%
Business drivers
Portfólio management
Biomass
HSSE
Enablers
Crushing
People 65,4MM TCEthanol, sugar and bioenergy
Production
Greenfield in GO
4,1 Mtc
JAT
2,9 Mtc
Fernandópolis
Votuporanga Junq
Jales
Orlândia
S. J. do Barretos Franca
Gasa Gal. Salgado
Greenfield in MS Rio Preto
11,1 Mtc
2,3 Mtc CA
Andradina
Ben Dest Catanduva
Mund Araçatuba Ribeirão Preto
Bonf
Jaboticabal
Dracena Univ
Tam S. J. da
11,3 Mtc Tupã Lins Araraquara Boa Vista
10,9 Mtc 49 Km ZaninSerra
Pres. Marília
Venceslau Pres. Prudente Diam DC
Baurú Jaú Limeira
Par CoPi Mogi
Barra Mirim
Assis
Mar USH
23 Km
Tar Piracicaba
UBR Guaratinguetá
Ourinhos Botucatu Raf Bragança
Ipau IASF Campinas Paulista
12,1 Mtc Pindamonhangaba
Avaré 12,0 Mtc
Itapetininga Sorocaba Mogi
24 Mills São Paulo
das Cruzes
Santos
Itapeva Ilha de São Sebastião
1 São Francisco, Rafard, Bom Retiro, Santa Helena, Costa Pinto Santos Port (Ilha Bela)
2 Barra, Dois Córregos, Diamante
3 Bonfim, Tamoio, Serra, Zanin Registro
4 Paralcool, Tarumã, Maracaí, Ipaussu
5 Gasa, Univalem, Destivale, Mundial, Benálcool, Junqueira
6 Jataí
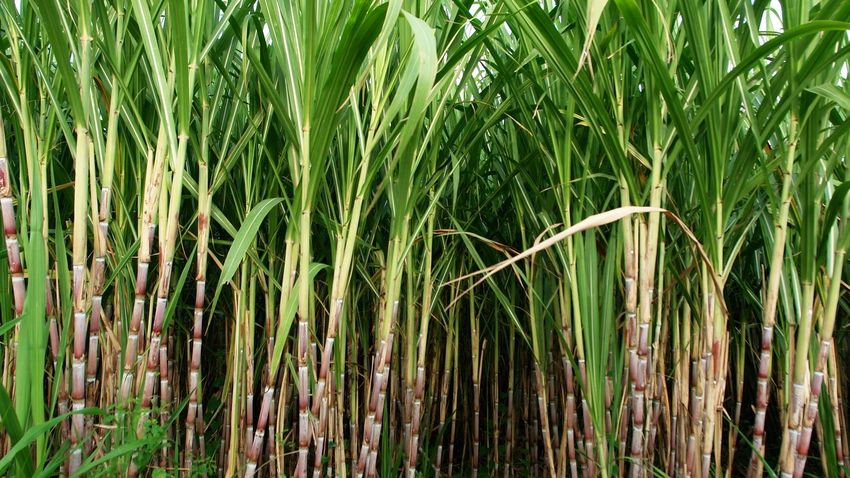
7 CaarapóTops & leaves can be the main feedstock for 2G if
the industry overcomes logistics challenges
Mechanization process has been increasing
significantly and has reached 65% in
industry
Not burning means extra 45M ton of
biomass available in the industry.
Two process must be selected :
Bring biomass together with the
sugarcane
Bales collection systemPotential of biomass
Ethanol production per hectare
SUGAR
JUICE
ETHANOL
CANE STALK MILL
23,8 tons Max. 7 a 8 m3
85 tons BAGASSE
DRY LEAVES
14,1 tons Extra 2 m3
GREEN LEAVES BIOMASS ETHANOL
TOPSIntegration opportunities
Plug & play 2G with a 1G plant
Opportunities 120 MM Liters
Steam/Power Supply 1. Retrofit of an existing boiler instead of installing a new boiler.
2. Lignin burning supplies steam and power required by 2G process.
Biomass Handling 1. Synergies with existing assets;
2. Existing know-how.
C6 Fermentation 1. Existing know-how.
Distillation 1. Synergies with existing assets;
2. Existing know-how.
Water / Vinasse Utilities 1. Synergies with 1G water balance (final molasses dilution);
2. Retrofit of existing vinasse disposal system;
3. Existing know-how about vinasse disposal.
4. Operational synergies between 2G and 1G process (utilities, lignin
handling, offices, warehouse, maintenance, etc.)Sugarcane segment scenario in Brazil
Enormous changes since 2009
Number of new production units
in the Centre-South region
More than 50 kMT of crushing capacity lost
Number of closed millsBrazilian matrix of fuel
Projections 2020-2025
2015 2020 2025
Even considering no hydrous ethanol supply,
Sugarcane (million tons) 641 600 650 sugarcane volume is slightly lower than
market requirements
Sugar (million tons) 35,6 40,5 46,3
Exportation assumption 24,4 28,8 34,0
Ethanol (billion liters)
Anhydrous (27%) 11,9 16,5 20,0
Hydrous 15,3 3,5 0,0
Exportation 1,0 1,2 3,3
Others 1,1 1,2 1,3
Available ATR (million tons)
Supply 87,2 82,8 91,0
Demand 87,2 82,8 91,6
Volume gap 0,59
Sugar (million tons) 0,567
EtoH anhydrous (billion liters) 0,340 Conservative importation volume (low fuel
Fuels (billion liters) consumption growth and decreasing Brazilian
Current gasoline (EPE) 30,6 31,4 sugar global market share)
Gasoline demand 44,7 54,1
Volume gap 14,2 22,7Project E2G COPI (Costa Pinto)
Located in
Costa Pinto Mill
Piracicaba, SP Capacity: 42.200 m3/year
Capex: ~230 MM R$
Commissioning:
Out/2014 – C6 Fermentation;
Out/2015 – C5 Fermentation.E2G plant Project details Construction area: 10.000m² + 30.000m² for biomass storage*. * Biomass storage area considers existing one. Budget: R$ ~230MM. Contractors: average 200 with a peak of 500. 800.000 working hours with no lost time incident Timing : 14 months. Equipments: 98% produced in Brazil.
2014 operation Main achievements All process units in E2G plant tested; Biomass handling and storaging as expected; Perfect integration between E2G plant and existing mill; Successfull technology scale up from demo to commercial scale; Enzyme logistics validated; Process Control implemented and tested.
Movie
2014 operation Action plan based on learnings Evaluation of process and equipment performance; Evaluation of main operation issues; erosion Process optimization in order to reach maximum capacity; Implement improvements based on lessons learned; Commissioning of dedicated boiler for E2G plant.
Challenges Fermentation Develop GMO yeast to produce ethanol from C5 (xylose); Choosing best fermentation design (once-through vs recycle); Develop process/equipment for yeast propagation on-site; Operation according to GMO regulation (CTNBio); Fermentation engineering and construction.
E2G roadmap
Plan

                                                            1 billion liters          Second
                                                         technology licensing          Gen.
                                                                                      Ethanol
                         2014
                         COPI
                                                            - 8 integrated plants;
 2012                                                       - Technology Licensing;
                                   - COPI Operation;        - Technology to
 Demonstration                     - Technological          maximize biomass
                                   Platform Advances;       economics;
                                   - Progress of            - Integration with
                                   Innovation Program;      Chemical plants.
        -Biomass Trial;
                                   - Begin 2nd Plant
        - Technology Validation;   Design
        - Project Starts.
Current land use in Brazil
Sugarcane for ethanol occupies less than 1% of the Brazilian land mass
Total Area Protected & Native Arable Area Other
Millions of Hectares 851.48 495.61 329.94 25.92
100% 58% 38% 3%
33%
Available
111.34 48% 16% 2.4%
Pasture Agriculture Sugarcane
158.75 51.7 8.14Production map
Sugarcane in Brazil
35Bonsucro certification
Only international certification for sugar and ethanol made
form sugarcane
Bonsucro: Raízen:
Non-profit organization with 176 members of various 1st certified mill in the world
countries and sectors: agricultural producers, mills, 10 mills already certified: Maracaí, Jataí, Costa Pinto, Bom
consumers, NGOs, traders Retiro, Bonfim, Univalem, Gasa, Dois Córregos, Junqueira
Multi-stakeholder process to measure, through metric and Serra.
indicators, the environmental, social and economic 32,1% of total sugarcane crushed by the company
performance of sugarcane-based activities
712,000 m³ of ethanol
Chosen by the EU as one of seven authorized schemes to
allow for the export of sugarcane products to Europe Member of Bonsucro’s executive board
Commitment to certify all millsCO2 emissions 2G improves the carbon footprint of Raízen Gasoline Ethanol 1G Ethanol 2G
Conclusion

• Biomass conversion remains a transformative opportunity

• Getting biomass conversion off the ground has taken longer
  time than anticipated

• Steady improvements and significant progress made over last
  2 years

• Ramp-up process key to biotechnology development and
  industry commercialization

38   Business Development – BioAgriculture – Biomass Conversion – Animal Health & Nutrition
You can also read