Monitoring ASP .Net Servers
←
→
Page content transcription
If your browser does not render page correctly, please read the page content below

Monitoring ASP .Net Servers
        eG Enterprise v5.6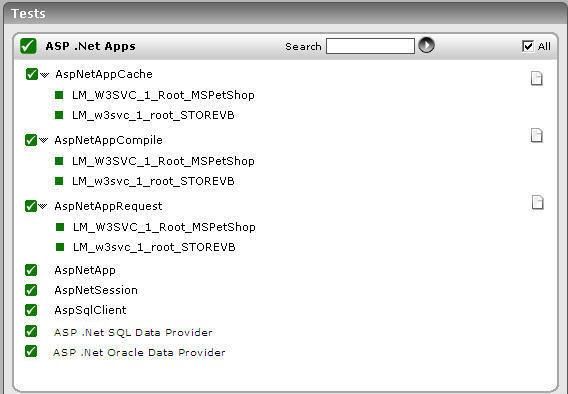
Restricted Rights Legend

The information contained in this document is confidential and subject to change without notice. No
part of this document may be reproduced or disclosed to others without the prior permission of eG
Innovations Inc. eG Innovations Inc. makes no warranty of any kind with regard to the software and
documentation, including, but not limited to, the implied warranties of merchantability and fitness for
a particular purpose.

Trademarks

Microsoft Windows, Windows NT, Windows 2003, and Windows 2000 are either registered trademarks
or trademarks of Microsoft Corporation in United States and/or other countries.

The names of actual companies and products mentioned herein may be the trademarks of their
respective owners.

Copyright

©2014 eG Innovations Inc. All rights reserved.
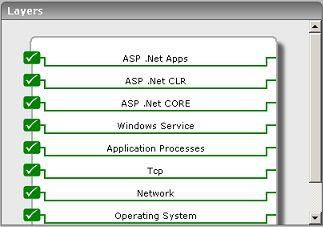
Table of Contents
MONITORING ASP .NET SERVERS .................................................................................................................................................................. 1
   1.1      THE ASP .NET CORE LAYER ....................................................................................................................................................................... 1
            1.1.1 ASP .Net Workers Test .................................................................................................................................................................... 2
   1.2      THE ASP .NET CLR LAYER.......................................................................................................................................................................... 4
            1.2.1 ASP Lock Threads Test ................................................................................................................................................................... 5
            1.2.2 ASP .Net CLR ExceptionsTest ......................................................................................................................................................... 6
            1.2.3 ASP .Net CLR GC Test ................................................................................................................................................................... 7
            1.2.4 ASP CLR Load Test ........................................................................................................................................................................ 8
            1.2.5 Clr Lock Threads Test................................................................................................................................................................... 11
            1.2.6 Clr Security Test ........................................................................................................................................................................... 12
            1.2.7 AspNetClrJit Test .......................................................................................................................................................................... 13
   1.3      THE ASP .NET APPS LAYER ....................................................................................................................................................................... 15
            1.3.1 ASP .Net App Cache Test .............................................................................................................................................................. 15
            1.3.2 ASP .Net App Compile Test........................................................................................................................................................... 17
            1.3.3 ASP .Net App Requests Test .......................................................................................................................................................... 19
            1.3.4 ASP .Net Applications Test ........................................................................................................................................................... 20
            1.3.5 ASP Sql Clients Test ..................................................................................................................................................................... 20
            1.3.6 ASP .Net Sessions Test .................................................................................................................................................................. 21
            1.3.7 ASP.Net SQL Data Provider Test ................................................................................................................................................. 23
            1.3.8 ASP .Net Oracle Data Provider Test ............................................................................................................................................ 26
CONCLUSION...................................................................................................................................................................................................... 30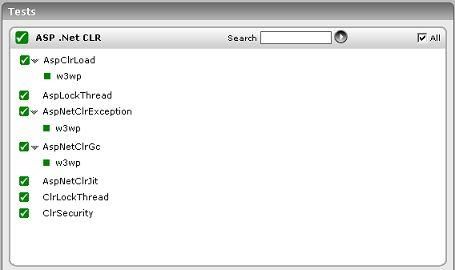
Table of Figures
Figure 1.1: The layer model of an ASP .Net server ................................................................................................................................................... 1
Figure 1.2: The tests associated with the ASP .Net CORE Layer .............................................................................................................................. 2
Figure 1.3: The tests associated with the ASP .Net CLR layer .................................................................................................................................. 5
Figure 1.4: The tests associated with the ASP .Net Apps layer ............................................................................................................................... 15
M o n i t o r i n g   A S P   . N e t    S e r v e r s

                                                                                            Chapter

                                                                                             1
Monitoring ASP .Net Servers
ASP .Net is a programming framework built on the common language runtime (CLR) that can be used
on a server to build powerful web applications, dynamic web sites, and mission-critical web services.
To ensure the stability of these web services, the ASP .Net framework should perform without a glitch.
This is why continuous monitoring of ASP .Net is important.

eG Enterprise has specially designed an ASP .Net monitoring model (see Figure 1.1) , which closely
monitors the performance of the ASP .Net framework from its core worker processes, to the language
(i.e., CLR) on which it has been built, to applications deployed on them, and accurately pin-points
bottlenecks to optimal performance.

                                        Figure 1.1: The layer model of an ASP .Net server

The sections to come will only discuss the top 3 layers of Figure 1.1, as the rest of the layers have
already been extensively discussed in the Monitoring Unix and Windows Servers document.

1.1 The ASP .Net CORE Layer
The test mapped to this layer (see Figure 1.2) monitors the performance of the worker process of the
ASP .Net server.

                                                               1
M o n i t o r i n g A S P . N e t S e r v e r s
Figure 1.2: The tests associated with the ASP .Net CORE Layer
1.1.1 ASP .Net Workers Test
The AspNetWorkerTest reports statistics pertaining to the performance of the worker process of the
ASP .Net server.
Purpose Reports statistics pertaining to the performance of the worker process of the ASP
.Net servers
Target of the The ASP .Net server
test
Agent An internal agent
deploying the
test
Configurable 1. TEST PERIOD - How often should the test be executed
parameters for
2. HOST - The host for which the test is to be configured
the test
3. PORT - The port at which the specified HOST listens
Outputs of the One set of results for the ASP .Net server being monitored
test
Measurements Measurement
Measurement Interpretation
made by the Unit
test Application restarts: Number In a perfect world, the application
The number of domain will and should survive for the
application restarts. life of the process. Even if a single
restart occurs, it is a cause for concern
because proactive and reactive restarts
cause automatic recycling of the worker
process. Moreover, restarts warrant
recreation of the application domain
and recompilation of the pages, both of
which consume a lot of time. To
investigate the reasons for a restart,
check the values set in the
processModel configuration.
2M o n i t o r i n g A S P . N e t S e r v e r s
Applications running: Number
The number of
applications currently
running.
Requests current: Number
The number of requests
currently handled by
the ASP.NET ISAPI. This
includes those that are
queued , executing, or
waiting to be written to
the client.
Request execution Number In version 1.0 of the framework, the
time: execution time begins when the worker
The number of seconds process receives the request, and stop
taken to execute the when the ASP.NET ISAPI sends
last request. HSE_REQ_DONE_WITH_SESSION to
IIS. In version 1.1 of the framework,
execution begins when the HttpContext
for the request is created, and stop
before the response is sent to IIS. The
value of this measure should be stable.
Any sudden change from the previous
recorded values should be notified.
Requests queued: Number When running on IIS 5.0, there is a
The number of requests queue between inetinfo and aspnet_wp,
currently queued. and there is one queue for each virtual
directory. When running on IIS 6.0,
there is a queue where requests are
posted to the managed ThreadPool
from native code, and a queue for each
virtual directory. This counter includes
requests in all queues. The queue
between inetinfo and aspnet_wp is a
named pipe through which the request
is sent from one process to the other.
The number of requests in this queue
increases if there is a shortage of
available I/O threads in the aspnet_wp
process. On IIS 6.0 it increases when
there are incoming requests and a
shortage of worker threads.
Requests rejected: Number Requests are rejected when one of the
The number of rejected queue limits is exceeded. An excessive
requests value of this measure hence indicates
that the worker process is unable to
process the requests due to
overwhelming load or low memory in
the processor.
3M o n i t o r i n g A S P . N e t S e r v e r s
Requests wait time: Secs
The number of seconds
that the most recent
request spent waiting in
the queue, or named
pipe that exists
between inetinfo and
aspnet_wp. This does
not include any time
spent waiting in the
application queues.
Worker processes Number Every application executing on the .NET
running: server corresponds to a worker process.
The current number of Sometimes, during active or proactive
aspnet_wp worker recycling, a new worker process and
processes the worker process that is being
replaced may coexist. Under such
circumstances, a single application
might have multiple worker processes
executing for it. Therefore, if the value
of this measure is not the same as that
of Applications running, then it calls for
closer examination of the reasons
behind the occurence.
Worker process Number Process restarts are expensive and
restarts: undesirable. The values of this metric
The number of are dependent upon the process model
aspnet_wp process configuration settings, as well as
restarts in the machine unforeseen access violations, memory
leaks, and deadlocks.
1.2 The ASP .Net CLR Layer
The tests associated with this layer (see Figure 1.3) monitor the following:
Managed locks and threads
Exceptions that occur in the CLR
Garbage collection activity
The locking activity
the security system activity
JIT compilation
4M o n i t o r i n g A S P . N e t S e r v e r s
Figure 1.3: The tests associated with the ASP .Net CLR layer
1.2.1 ASP Lock Threads Test
This test provides information about managed locks and threads that an application uses.
Purpose Provides information about managed locks and threads that an application uses
Target of the An ASP .Net server
test
Agent An internal agent
deploying the
test
Configurable 1. TEST PERIOD - How often should the test be executed
parameters for
2. HOST - The host for which the test is to be configured
the test
3. PORT - The port at which the specified HOST listens
Outputs of the One set of results for the ASP .Net server being monitored
test
Measurements Measurement
Measurement Interpretation
made by the Unit
test Current logical Number
threads:
The number of current
managed thread objects
in the application. This
measure maintains the
count of both running
and stopped threads.
5M o n i t o r i n g A S P . N e t S e r v e r s
Current physical Number
threads:
The number of native
operating system
threads created and
owned by the common
language runtime to act
as underlying threads
for managed thread
objects. This measure
does not include the
threads used by the
runtime in its internal
operations.
Current recognized Number
threads:
The number of threads
that are currently
recognized by the
runtime. These threads
are associated with a
corresponding managed
thread object.
Contention rate: Rate/Sec
The rate at which
threads in the runtime
attempt to acquire a
managed lock
unsuccessfully.
Current queue Number
length:
The total number of
threads that are
currently waiting to
acquire a managed lock
in the application.
1.2.2 ASP .Net CLR ExceptionsTest
This test reports statistics related to the exceptions that occur in the CLR due to managed and
unmanaged exceptions.
Purpose Reports statistics related to the exceptions that occur in the CLR due to managed
and unmanaged exceptions
Target of the An ASP .Net server
test
Agent An internal agent
deploying the
test
6M o n i t o r i n g A S P . N e t S e r v e r s
Configurable 1. TEST PERIOD - How often should the test be executed
parameters for
2. HOST - The host for which the test is to be configured
the test
3. PORT - The port at which the specified HOST listens
Outputs of the One set of results for every worker process on the ASP .Net server
test
Measurements Measurement
Measurement Interpretation
made by the Unit
test Clr exceptions: Exceptions/Sec Exceptions are very costly and can
The total number of severely degrade your application
managed exceptions performance. A high value of this
thrown per second. measure is therefore an indicator of
potential performance issues.
1.2.3 ASP .Net CLR GC Test
This test monitors the memory allocation activity of the ASP .Net server, in terms of heaps when
objects are created and managed.
Purpose Monitors the memory allocation activity of the ASP .Net server
Target of the An ASP .Net server
test
Agent An internal agent
deploying the
test
Configurable 1. TEST PERIOD - How often should the test be executed
parameters for
2. HOST - The host for which the test is to be configured
the test
3. PORT - The port at which the specified HOST listens
Outputs of the One set of results for every worker process on the ASP .Net server
test
Measurements Measurement
Measurement Interpretation
made by the Unit
test Heap mem usage: MB
The number of bytes
committed by managed
objects. This is the sum
of the large object heap
and the generation 0, 1,
and 2 heaps.
7M o n i t o r i n g A S P . N e t S e r v e r s
Gen 0 collections: Collections/Sec
The rate at which the
generation 0 objects
(youngest; most
recently allocated) are
garbage collected (Gen
0 GC) since the start of
the application.
Gen 1 collections: Collections/Sec
The rate at which the
generation 1 objects
have been garbage
collected since the start
of the application.
Objects that survive are
promoted to generation
2.
Gen 2 collections: Number The number of times generation 2
The number of seconds objects have been garbage collected
taken to execute the since the start of the application.
last request. Generation 2 is the highest, thus
objects that survive collection remain in
generation 2. Gen 2 collections can be
very expensive, especially if the size of
the Gen 2 heap is huge.
Time in gc: Percent This measure is usually an indicator of
% Time in GC is the the work done by the Garbage Collector
percentage of elapsed on behalf of the application to collect
time that was spent in and conserve memory. This measure is
performing a garbage updated only at the end of every GC
collection (GC) since
and the measure reflects the last
the last GC cycle.
observed value; its not an average.
1.2.4 ASP CLR Load Test
This test monitors the classes and assemblies loaded on to an ASP .Net application. A class is
essentially the blueprint for an object. It contains the definition for how a particular object will be
instantiated at runtime, such as the properties and methods that will be exposed publicly by the object
and any internal storage structures.
Also known as Managed DLLs, assemblies are the fundamental unit of deployment for the .NET
platform. The .NET Framework itself is made up of a number of assemblies, including mscorlib.dll,
among others. The assembly boundary is also where versioning and security are applied. An assembly
contains Intermediate Language generated by a specific language compiler, an assembly manifest
(containing information about the assembly), type metadata, and resources.
Purpose Monitors the classes and assemblies loaded on to an ASP .Net application
Target of the An ASP .Net server
8M o n i t o r i n g A S P . N e t S e r v e r s
test
Agent An internal agent
deploying the
test
Configurable 1. TEST PERIOD - How often should the test be executed
parameters for
2. HOST - The host for which the test is to be configured
the test
3. PORT - The port at which the specified HOST listens
Outputs of the One set of results for every worker process on the ASP .Net server being monitored
test
Measurements Measurement
Measurement Interpretation
made by the Unit
test Classes loaded: Number
Indicates the
cumulative number of
classes loaded in all
assemblies since the
start of this application.
Current classes Number An unusually high value may indicate a
loaded: sudden increase in classes which loaded
Indicates the current on to this .NET application.
number of classes
loaded in all
Assemblies.
Rate of assemblies: Assembles/Sec If the Assembly is loaded as domain-
The rate at which neutral from multiple AppDomains then
Assemblies were loaded this counter is incremented once only.
across all AppDomains. Assemblies can be loaded as domain-
neutral when their code can be shared
by all AppDomains or they can be
loaded as domain-specific when their
code is private to the AppDomain. This
counter is not an average over time; it
displays the difference between the
values observed in the last two samples
divided by the duration of the sample
interval.
Rate of classes Classes/Sec This counter is not an average over
loaded: time; it displays the difference between
This rate at which the the values observed in the last two
classes loaded in all samples divided by the duration of the
Assemblies. sample interval.
9M o n i t o r i n g A S P . N e t S e r v e r s
Rate of load failures: Failures/Sec This counter is not an average over
The rate of load failures time; it displays the difference between
on the application. the values observed in the last two
samples divided by the duration of the
sample interval. These load failures
could be due to many reasons like
inadequate security or illegal format.
Current appdomains: Number AppDomains (application domains)
The number of provide a secure and versatile unit of
AppDomains currently processing that the CLR can use to
loaded in this provide isolation between applications
application. running in the same process.
Current assemblies: Number If the Assembly is loaded as domain-
The number of neutral from multiple AppDomains then
assemblies currently this counter is incremented once only.
loaded across all Assemblies can be loaded as domain-
AppDomains in this neutral when their code can be shared
application. by all AppDomains or they can be
loaded as domain-specific when their
code is private to the AppDomain.
Loader heap size: MB Committed memory is the physical
The size of the memory memory for which space has been
committed by the class reserved on the disk paging file.
loader across all
AppDomains.
Load failures: Number These load failures could be due to
The number of classes many reasons like inadequate security
that have failed to load or illegal format.
during the last
measurement period,
Appdomains loaded: Number
The number of
AppDomains loaded
during the last
measurement period.
10M o n i t o r i n g A S P . N e t S e r v e r s
Num assemblies: Number An assembly in ASP.NET is a collection
The number of of single-file or multiple files. The
assemblies loaded assembly that has more than one file
during the last contains either a dynamic link library
measurement period. (DLL) or an EXE file. The assembly also
contains metadata that is known as
assembly manifest. The assembly
manifest contains data about the
versioning requirements of the
assembly, author name of the
assembly, the security requirements
that the assembly requires to run, and
the various files that form part of the
assembly.
The biggest advantage of using
ASP.NET Assemblies is that developers
can create applications without
interfering with other applications on
the system.
1.2.5 Clr Lock Threads Test
This test monitors the thread locking activity on the ASP .Net server.
Purpose Monitors the thread locking activity on the ASP .Net server
Target of the An ASP .Net server
test
Agent An internal agent
deploying the
test
Configurable 1. TEST PERIOD - How often should the test be executed
parameters for
2. HOST - The host for which the test is to be configured
the test
3. PORT - The port at which the specified HOST listens
Outputs of the One set of results for the ASP .Net server being monitored
test
Measurements Measurement
Measurement Interpretation
made by the Unit
test Queue length rate: Threads/Sec
Indicates the rate at
which threads are
waiting to acquire some
lock in the application.
11M o n i t o r i n g A S P . N e t S e r v e r s
Recognized threads Threads/Sec The recognized threads have a
rate: corresponding .NET thread object
Indicates the number of associated with them. These threads
threads per second that are not created by the CLR; they are
have been recognized created outside the CLR but have since
by the CLR. run inside the CLR at least once. Only
unique threads are tracked; threads
with the same thread ID re-entering the
CLR or recreated after thread exit are
not counted twice.
Queue length peak: Number A high turnover rate indicates that
Indicates the total items are being quickly added and
number of threads that removed, which can be expensive.
waited to acquire some
managed lock during
the last measurement
period.
Recognized threads: Number The recognized threads have a
Indicates the total corresponding .NET thread object
number of threads that associated with them. These threads
have been recognized are not created by the CLR; they are
by the CLR during the created outside the CLR but have since
last measurement run inside the CLR at least once. Only
period. unique threads are tracked; threads
with the same thread ID re-entering the
CLR or recreated after thread exit are
not counted twice.
Contention threads: Number Managed locks can be acquired in many
Indicates the total ways; by the lock statement in C# or
number of times by calling System.Monitor.Enter or by
threads in the CLR have using MethodImplOptions.Synchronized
attempted to acquire a custom attribute.
managed lock
unsuccessfully.
1.2.6 Clr Security Test
This test monitors the security system activity of the ASP .Net server.
Purpose Monitors the security system activity of the ASP .Net server
Target of the An ASP .Net server
test
Agent An internal agent
deploying the
test
12M o n i t o r i n g A S P . N e t S e r v e r s
Configurable 1. TEST PERIOD - How often should the test be executed
parameters for
2. HOST - The host for which the test is to be configured
the test
3. PORT - The port at which the specified HOST listens
Outputs of the One set of results for the ASP .Net objects in the Voyager user interface being
test monitored
Measurements Measurement
Measurement Interpretation
made by the Unit
test Time in runtime Percent If this counter is high, revisit what is
checks: being checked and how often. The
Indicates the application may be executing
percentage of elapsed unnecessary stack walk depths.
time spent in Another cause for a high percentage of
performing runtime time spent in runtime checks could be
Code Access Security numerous linktime checks.
(CAS) checks during the
last measurement
period.
Stack walk depth: Number
Indicates the depth of
the stack during that
last measurement
period.
Link time checks: Number The value displayed is not indicative of
Indicates the total serious performance issues, but it is
number of linktime indicative of the health of the security
Code Access Security system activity.
(CAS) checks during the
last measurement
period.
Runtime checks: Number A high number for the total runtime
Indicates the total checks along with a high stack walk
number of runtime CAS depth indicates performance overhead.
checks performed
during the last
measurement period.
1.2.7 AspNetClrJit Test
The CLR (Common Language Runtime) is the execution environment for code written for the .NET
Framework. The CLR manages the execution of .NET code, including memory allocation and garbage
collection (which helps avoid memory leaks), security (including applying differing trust levels to code
from different sources), thread management, enforcing type-safety, and many other tasks.
The CLR works with every language available for the .NET Framework, so there is no need to have a
separate runtime for each language. Code developed in a .NET language is compiled by the individual
language compiler (such as the Visual Basic .NET compiler) into an intermediate format called
13M o n i t o r i n g A S P . N e t S e r v e r s
Intermediate Language (IL). At runtime, this IL code generated by the compiler is just-in-time (JIT)
compiled by the CLR into native code for the processor type the CLR is running on.
This AspNetClrJit test monitors the JIT compilation performed by the CLR. This compilation provides
the flexibility of being able to develop with multiple languages and target multiple processor types
while still retaining the performance of native code at execution time.
Purpose Monitors the JIT compilation performed by the CLR
Target of the An ASP .Net server
test
Agent An internal agent
deploying the
test
Configurable 1. TEST PERIOD - How often should the test be executed
parameters for
2. HOST - The host for which the test is to be configured
the test
3. PORT - The port at which the specified HOST listens
Outputs of the One set of results for the ASP .Net server being monitored
test
Measurements Measurement
Measurement Interpretation
made by the Unit
test ASP .Net – Time in Percent
JIT:
Indicates the
percentage of elapsed
time spent in JIT
compilation; a JIT
compilation phase is the
phase when a method
and its dependencies
are being compiled..
ASP .Net – Data JIT KB/Sec
rate:
Indicates the rate at
which IL bytes are
jitted.
ASP .Net – JIT Number An unusually high value may indicate a
failures: sudden increase in jit failures occured
Indicates the number of in the application.
methods the JIT
compiler has failed to
JIT during the last
measurement period.
ASP .Net – Data KB/Sec
jitted:
Indicates the total IL
bytes jitted during the
last measurement
period.
14M o n i t o r i n g A S P . N e t S e r v e r s
ASP .Net – Methods Number AppDomains (application domains)
jitted: provide a secure and versatile unit of
Indicates the methods processing that the CLR can use to
compiled Just-In-Time provide isolation between applications
(JIT) by the CLR JIT running in the same process.
compiler during the last
measurement period.
1.3 The ASP .Net Apps Layer
The tests associated with this layer (see Figure 1.4) monitor the following:
The application cache
How well the appdomains perform during compilation
How well the appdomains handle requests
Performance of the applications deployed on the ASP .Net server
Client connections to the ASP.Net server
Sessions to the ASP .Net server
The health of the interaction between the ASP .Net server and the MS SQL / Oracle database
servers via the respective .Net Framework Data Providers
Figure 1.4: The tests associated with the ASP .Net Apps layer
1.3.1 ASP .Net App Cache Test
This test monitors the performance of the ASP.NET Application (or Application Domain) Cache.
15M o n i t o r i n g A S P . N e t S e r v e r s
Purpose Monitors the performance of the ASP.NET Application (or Application Domain) Cache
Target of the An ASP .Net server
test
Agent An internal agent
deploying the
test
Configurable 1. TEST PERIOD - How often should the test be executed
parameters for
2. HOST - The host for which the test is to be configured
the test
3. PORT - The port at which the specified HOST listens
Outputs of the One set of results for every ASP .Net application/application domain cache on a
test monitored ASP .Net server
Measurements Measurement
Measurement Interpretation
made by the Unit
test Cache total entries: Number
The current number of
entries in the cache
(both User and
Internal).
Cache hit ratio: Percent Physical I/O takes a significant amount
The current hit-to-miss of time, and also increases the CPU
ratio of all cache resources required. The server
requests (both user and configuration should therefore ensure
internal). that the required information is
available on the memory. A low value
of this measure indicates that physical
I/O is greater.
Cache turnover rate Cached/Sec A high turnover rate indicates that
The number of additions items are being quickly added and
and removals to the removed, which can be expensive.
cache per second (both
user and internal).
Cache api entries: Number
The number of entries
currently in the user
cache.
Cache user hit ratio: Percent A high value of this measure is
Total hit-to-miss ratio indicative of the good health of the
of user cache requests. server.
Cache user turnover Cached/Sec A high turnover rate indicates that
rate: items are being quickly added and
The number of additions removed, which can be expensive.
and removals to the
user cache per second.
16M o n i t o r i n g A S P . N e t S e r v e r s
Output cache entries: Number
The number of entries
currently in the Output
Cache.
Output cache hit Percent A high value of this measure is a sign of
ratio: good health.
The total hit-to-miss
ratio of Output Cache
requests
Output cache Cached/Sec Output caching allows you to store
turnover rate: dynamic page and user control
The number of additions responses on any HTTP 1.1 cache-
and removals to the capable device in the output stream,
output cache per from the originating server to the
second requesting browser. On subsequent
requests, the page or user control code
is not executed; the cached output is
used to satisfy the request
Sudden increases in the value of this
measure are indicative of backend
latency.
1.3.2 ASP .Net App Compile Test
This test reports how well the AppDomains perform during the compilation of the aspx, asmx, ascx or
ashx files, loading of assemblies, and execution of assemblies to generate the page.
Purpose Reports how well the AppDomains perform during the compilation of the aspx,
asmx, ascx or ashx files, loading of assemblies, and execution of assemblies to
generate the page
Target of the An ASP .Net server
test
Agent An internal agent
deploying the
test
Configurable 1. TEST PERIOD - How often should the test be executed
parameters for
2. HOST - The host for which the test is to be configured
the test
3. PORT - The port at which the specified HOST listens
Outputs of the One set of results for every ASP .Net application domain on a monitored ASP .Net
test server
Measurements Measurement
Measurement Interpretation
made by the Unit
17M o n i t o r i n g A S P . N e t S e r v e r s
test Compilation total: Number
The total number of
compilations that have
taken place during the
lifetime of the current
Web server process.
This occurs when a file
with a .aspx, .asmx,
asax,.ascx, or .ashx
extension or code-
behind source files are
dynamically compiled
on the server.
Processing errors: Errors/Sec A consistent increase in the value of
The rate at which this measure could prove to be fatal for
configuration and the application domain.
parsing errors occur.
Compilation errors: Errors/Sec
The rate at which
compilation errors
occur. The response is
cached, and this
counter increments only
once until recompilation
is forced by a file
change.
Runtime errors: Errors/Sec
The rate at which run-
time errors occur.
Unhandled runtime Errors/Sec A consistent increase in the value of
errors: this measure could prove to be fatal for
The rate of unhandled the application domain. This measure
runtime exceptions. however, does not include the
following:
Errors cleared by an event
handler (for example, by
Page_Error or
Application_Error)
Errors handled by a redirect
page
Errors that occur within a
try/catch block
18M o n i t o r i n g A S P . N e t S e r v e r s
1.3.3 ASP .Net App Requests Test
This test monitors how well the application domain handles requests.
Purpose Monitors how well the application domain handles requests
Target of the An ASP .Net server
test
Agent An internal agent
deploying the
test
Configurable 1. TEST PERIOD - How often should the test be executed
parameters for
2. HOST - The host for which the test is to be configured
the test
3. PORT - The port at which the specified HOST listens
Outputs of the One set of results for every ASP .Net application domain on a monitored ASP .Net
test server
Measurements Measurement
Measurement Interpretation
made by the Unit
test Requests executing: Number This measure is incremented when the
The number of requests HttpRuntime begins to process the
currently executing. request and is decremented after the
HttpRuntime finishes the request.
Requests app queue: Number
The number of requests
currently in the
application request
queue.
Requests not found: Number
The number of requests
that did not find the
required resource.
Requests not Number Values greater than 0 indicate that
authorized: proper authorization has not been
The number of request provided, or invalid authors are trying
failed due to to access a particular resource.
unauthorized access.
Requests timed out: Number
The number of requests
timed out.
Requests succeeded: Requests/Sec
The rate at which
requests succeeded
19M o n i t o r i n g A S P . N e t S e r v e r s
1.3.4 ASP .Net Applications Test
This test reports key statistics pertaining to applications deployed on the ASP .Net server.
Purpose Reports key statistics pertaining to applications deployed on the ASP .Net server
Target of the An ASP .Net server
test
Agent An internal agent
deploying the
test
Configurable 1. TEST PERIOD - How often should the test be executed
parameters for
2. HOST - The host for which the test is to be configured
the test
3. PORT - The port at which the specified HOST listens
Outputs of the One set of results for the ASP .Net server being monitored
test
Measurements Measurement
Measurement Interpretation
made by the Unit
test Request rate: Number This represents the current throughput
Indicates the number of of the application.
requests executed per
second.
Pipeline instances: Number Since only one execution thread can
Indicates the number of run within a pipeline instance, this
active pipeline instances number gives the maximum number of
for the ASP.NET concurrent requests that are being
application. processed for a given application.
Ideally, the value of this measure
should be low.
Number of errors: Number This measure should be kept at 0 or a
Indicates the total sum very low value.
of all errors that occur
during the execution of
HTTP requests.
1.3.5 ASP Sql Clients Test
This test reports metrics pertaining to client connections to the ASP .Net server.
Purpose Reports metrics pertaining to client connections to the ASP .Net server
Target of the An ASP .Net server
test
Agent An internal agent
deploying the
test
20M o n i t o r i n g A S P . N e t S e r v e r s
Configurable 1. TEST PERIOD - How often should the test be executed
parameters for
2. HOST - The host for which the test is to be configured
the test
3. PORT - The port at which the specified HOST listens
Outputs of the One set of results for the ASP .Net server being monitored
test
Measurements Measurement
Measurement Interpretation
made by the Unit
test Connection pool size: Number If the connection pool maxes out while
Indicates the number of new connection requests are still
connection pools that coming in, you willl see connection
have been created. requests refused, apparently at
random. The cure in this case is simply
to specify a higher value for the Max
Pool Size property.
Number of Number
connections:
Indicates the number of
connections currently in
the pool.
Pooled connections: Number
Indicates the number of
connections that have
been pooled.
Pooled connections Number If the value of this measure is at the
peak: Max Pool Size value, and the value of
Indicates the highest the Failed connects measure increases
number of connections while the application is running, you
that have been used. might have to consider increasing the
size of the connection pool.
Failed connects: Number If the connection pool maxes out while
Indicates the number of new connection requests are still
connection attempts coming in, you willl see connection
that have failed. requests refused, apparently at
random. The cure in this case is simply
to specify a higher value for the Max
Pool Size property.
1.3.6 ASP .Net Sessions Test
This test monitors the sessions on the ASP .Net server.
Purpose Monitors the sessions on the ASP .Net server
Target of the The ASP .Net objects
test
21M o n i t o r i n g A S P . N e t S e r v e r s
Agent An internal agent
deploying the
test
Configurable 1. TEST PERIOD - How often should the test be executed
parameters for
2. HOST - The host for which the test is to be configured
the test
3. PORT - The port at which the specified HOST listens
Outputs of the One set of results for the ASP .Net server being monitored
test
Measurements Measurement
Measurement Interpretation
made by the Unit
test SQL connections: Number An unusually high value may indicate a
Indicates the number of sudden increase in sessions to the SQL
connections to the SQL Server.
Server used by session
state.
State server Number An unusually high value may indicate a
connections: sudden increase in sessions to the
Indicates the number of StateServer.
connections to the
StateServer used by
session state.
Abandoned ASPNet Number
application sessions:
Indicates the number of
sessions that have been
explicitly abandoned
during the last
measurement period.
Active ASPNet Number
application sessions:
Indicates the currently
active sessions.
Timedout ASPNet Number
application sessions:
Indicates the number of
sessions that timed out
during the last
measurement period.
ASPNet application Number
sessions:
Indicates the total
number of sessions
during the last
measurement period.
22M o n i t o r i n g A S P . N e t S e r v e r s
1.3.7 ASP.Net SQL Data Provider Test
A data provider in the .NET Framework serves as a bridge between an application and a data source. A
.NET Framework data provider enables you to return query results from a data source, execute
commands at a data source, and propagate changes in a DataSet to a data source.
The .Net Data Provider for SQL Server allows you to connect to a Microsoft SQL Server 7.0, 2000, and
2005 databases, and perform the above-mentioned operations. This test reports many useful metrics
that shed light on the health of the interactions between the ASP .Net sever and the SQL server.
Purpose Shed light on the health of the interactions between the ASP .Net sever and the SQL
server
Target of the The ASP .Net server
test
Agent An internal agent
deploying the
test
Configurable 1. TEST PERIOD - How often should the test be executed
parameters for
2. HOST - The host for which the test is to be configured
the test
3. PORT - The port at which the specified HOST listens
Outputs of the One set of results for the ASP .Net server being monitored
test
Measurements Measurement
Measurement Interpretation
made by the Unit
test Hard connects: Connects/Sec
Indicates the number of
actual connections per
second that are being
made to a database
server.
Hard disconnects: Disconnects/Se
Indicates the number of c
actual disconnects per
second that are being
made to a database
server.
Active connection Number The value of this measure is controlled
pool groups: by the number of unique connection
Indicates the number of strings that are found in the
currently active AppDomain.
connection pool groups.
23M o n i t o r i n g A S P . N e t S e r v e r s
Active connection Number When a connection is first opened, a
pools: connection pool is created based on
Indicates the number of matching criteria that associates the
connection pools that pool with the connection string in the
are currently active. connection. Each connection pool is
associated with a distinct connection
string. If the connection string is not an
exact match to an existing pool when a
new connection is opened, a new pool
is created. Connections are pooled per
process, per application domain, per
connection string, and, when integrated
security is used, per Windows identity.
When using Windows Authentication
(integrated security), both the Active
connection pool groups and Active
connection pools measures are
significant. The reason is that
connection pool groups map to unique
connection strings. When integrated
security is used, connection pools map
to connection strings and additionally
create separate pools for individual
Windows identities. For example, if Fred
and Julie, each within the same
AppDomain, both use the connection
string "Data Source=MySqlServer;Integrated
Security=true", a connection pool group is
created for the connection string, and
two additional pools are created, one
for Fred and one for Julie. If John and
Martha use a connection string with an
identical SQL Server login, "Data
Source=MySqlServer;User
Id=lowPrivUser;Password=Strong?Password"
, then only a single pool is created for
the lowPrivUser identity.
Active connections: Number
Indicates the number of
connections that are
currently in use.
Free connections: Number Ideally, the value of this measure. A
Indicates the count of very low value indicates excessive
unused connections. connection usage.
24M o n i t o r i n g A S P . N e t S e r v e r s
Inactive connection Number
pools:
Indicates the number of
connection pools that
have had no recent
activity and are waiting
to be disposed.
Inactive connection Number
pool groups:
Indicates the number of
inactive connection pool
groups that were
waiting to be
deactivated i.e., to be
pruned.
Non-pooled Number
connections:
Indicates the number of
active connections that
are not using any of the
connection pools.
Pooled connections: Number
Indicates the number of
connections that are
managed by the
connection pooler.
Reclaimed Number Not explicitly closing or disposing
connections: connections hurts performance.
Indicates the number of
connections that have
been reclaimed through
garbage collection
where Close or Dispose
was not called by the
application.
Statis connections: Number
Indicates the number of
connections that are
currently awaiting
completion of an action
and are therefore
unavailable for use by
any other application.
Soft connects: Connects/Sec
Indicates the rate at
which connections are
pulled from the
connection pool.
25M o n i t o r i n g A S P . N e t S e r v e r s
Soft disconnects: Disconnects/Se
Indicates the rate at c
which connections are
returned to the
connection pool.
1.3.8 ASP .Net Oracle Data Provider Test
A data provider in the .NET Framework serves as a bridge between an application and a data source. A
.NET Framework data provider enables you to return query results from a data source, execute
commands at a data source, and propagate changes in a DataSet to a data source.
The Oracle Data Provider for .NET (ODP.NET) features optimized data access to the Oracle database
from a .NET environment. ODP.NET allows developers to take advantage of advanced Oracle database
functionality, including Real Application Clusters, XML DB, and advanced security. The data provider
can be used from any .NET language, including C# and Visual Basic .NET.
This test reports many useful metrics that shed light on the health of the interactions between the ASP
.Net sever and the Oracle database server.
Purpose Sheds light on the health of the interactions between the ASP .Net sever and the
Oracle database server
Target of the The ASP .Net server
test
Agent An internal agent
deploying the
test
Configurable 1. TEST PERIOD - How often should the test be executed
parameters for
2. HOST - The host for which the test is to be configured
the test
3. PORT - The port at which the specified HOST listens
Outputs of the One set of results for the ASP .Net server being monitored
test
Measurements Measurement
Measurement Interpretation
made by the Unit
test Hard connects: Connects/Sec
Indicates the number of
actual connections per
second that are being
made to a database
server.
Hard disconnects: Disconnects/Se
Indicates the number of c
actual disconnects per
second that are being
made to a database
server.
26M o n i t o r i n g A S P . N e t S e r v e r s
Active connection Number The value of this measure is controlled
pool groups: by the number of unique connection
Indicates the number of strings that are found in the
currently active AppDomain.
connection pool groups.
Active connection Number When a connection is first opened, a
pools: connection pool is created based on
Indicates the number of matching criteria that associates the
currently active pool with the connection string in the
connection pools. connection. Each connection pool is
associated with a distinct connection
string. If the connection string is not an
exact match to an existing pool when a
new connection is opened, a new pool
is created. Connections are pooled per
process, per application domain, per
connection string, and, when integrated
security is used, per Windows identity.
When using Windows Authentication
(integrated security), both the Active
connection pool groups and Active
connection pools measures are
significant. The reason is that
connection pool groups map to unique
connection strings. When integrated
security is used, connection pools map
to connection strings and additionally
create separate pools for individual
Windows identities. For example, if Fred
and Julie, each within the same
AppDomain, both use the connection
string "Data Source=MySqlServer;Integrated
Security=true", a connection pool group is
created for the connection string, and
two additional pools are created, one
for Fred and one for Julie. If John and
Martha use a connection string with an
identical SQL Server login, "Data
Source=MySqlServer;User
Id=lowPrivUser;Password=Strong?Password"
, then only a single pool is created for
the lowPrivUser identity.
Active connections: Number
Indicates the number of
connections that are
currently in use.
Free connections: Number Ideally, the value of this measure. A
Indicates the count of very low value indicates excessive
unused connections. connection usage.
27M o n i t o r i n g A S P . N e t S e r v e r s
Inactive connection Number
pools:
Indicates the number of
connection pools that
have had no recent
activity and are waiting
to be disposed.
Inactive connection Number
pool groups:
Indicates the number of
inactive connection pool
groups that were
waiting to be
deactivated i.e., to be
pruned.
Non-pooled Number
connections:
Indicates the number of
active connections that
are not using any of the
connection pools.
Pooled connections: Number
Indicates the number of
connections that are
managed by the
connection pooler.
Reclaimed Number Not explicitly closing or disposing
connections: connections hurts performance.
Indicates the number of
connections that have
been reclaimed through
garbage collection
where Close or Dispose
was not called by the
application.
Statis connections: Number
Indicates the number of
connections that are
currently awaiting
completion of an action
and are therefore
unavailable for use by
any other application.
Soft connects: Connects/Sec
Indicates the rate at
which connections are
pulled from the
connection pool.
28M o n i t o r i n g A S P . N e t S e r v e r s
Soft disconnects: Disconnects/Se
Indicates the rate at c
which connections are
returned to the
connection pool.
29C o n c l u s i o n
Chapter
2
Conclusion
This document has described in detail the monitoring paradigm used and the measurement
capabilities of the eG Enterprise suite of products with respect to ASP .Net servers. For details of how to
administer and use the eG Enterprise suite of products, refer to the user manuals.
We will be adding new measurement capabilities into the future versions of the eG Enterprise suite. If
you can identify new capabilities that you would like us to incorporate in the eG Enterprise suite of
products, please contact support@eginnovations.com. We look forward to your support and
cooperation. Any feedback regarding this manual or any other aspects of the eG Enterprise suite can
be forwarded to feedback@eginnovations.com.
30You can also read