Assessment of abalone stocks in Western Zone Victoria - TAC Workshop DRAFT Submission to the TAC setting process for 2020 - WADA
←
→
Page content transcription
If your browser does not render page correctly, please read the page content below
TAC Workshop DRAFT
  Assessment of abalone stocks in
          Western Zone Victoria
Submission to the TAC setting process for 2020

                   Western Abalone Divers Association
                                        January, 2020
© 2020 Western Abalone Divers Association

All rights reserved.

ISBN 978-09870470-3-8

Assessment of abalone stocks in Western Zone, Victoria: Submission to the TAC setting process
for 2020
December 2019 (this document printed to pdf on December 19, 2019)

Ownership of Intellectual property rights
Unless otherwise noted, copyright (and any other intellectual property rights, if any) in this
publication is owned by the Western Abalone Divers Association (WADA).
Western Abalone Divers Association, 2020, Assessment of abalone stocks in Western Zone Victoria: Submission to the
TAC setting process for 2020, Port Fairy.

Creative Commons license
All material in this publication is licensed under a Creative Commons Attribution 3.0 Australia
License, save for content supplied by third parties and logos.
                             Creative Commons Attribution 3.0 Australia License is a standard form license agreement
                             that allows you to copy, distribute, transmit and adapt this publication provided you attribute
                             the work. A summary of the license terms are available from
                             creativecommons.org/licenses/by/3.0/au/deed.en. The full license terms are available from
                             creativecommons.org/licenses/by/3.0/au/legalcode.

Inquiries regarding the license and any use of this document: wada@pipeline.com.au

Disclaimer
The authors do not warrant that the information in this document is free from errors or omissions.
The authors do not accept any form of liability, be it contractual, tortious, or otherwise, for the
contents of this document or for any consequences arising from its use or any reliance placed upon
it. The information, opinions and advice contained in this document may not relate, or be relevant,
to a reader’s particular circumstances. Opinions expressed by the authors are the individual
opinions expressed by those persons and are not necessarily those of the publisher or research
provider.

 Contact Details
 Name:        Harry Peeters and Dr Duncan Worthington

 Phone:       0417 119 577 and 0431 755 497

 Email:       wada@pipeline.com.au

                                                                                                               Page |2
Table of Contents
Background......................................................................................................................................... 5
Assessment of Primary Indicators relative to Reference Points ........................................................ 7
Summary of Primary and Secondary Indicators............................................................................... 10
Portland ........................................................................................................................................ 10
Julia Percy ..................................................................................................................................... 12
Port Fairy....................................................................................................................................... 14
Warrnambool ............................................................................................................................... 16
Discovery Bay................................................................................................................................ 19
Greenlip abalone .......................................................................................................................... 19
Summary .............................................................................................................................................. 22
Appendix 1. Biomass calculation and sensitivity tables. .................................................................... 26
Appendix 2. Technical Methods.......................................................................................................... 28
Appendix 3. WADA Reefcode Reports. ............................................................................................... 28
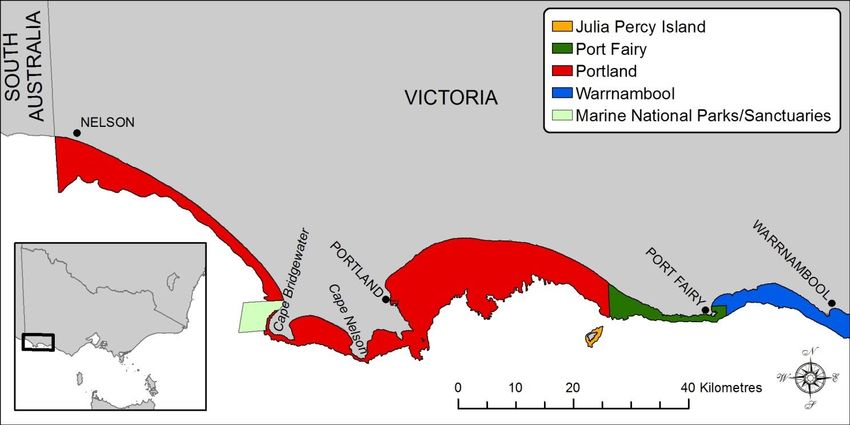
Appendix 4. Map of WZ and SMU. ...................................................................................................... 28
Appendix 5. Long term commercial catch and catch rate .................................................................. 29
Appendix 6. Long term catch and abundance survey biomass .......................................................... 30
Appendix 7. Long term Abundance survey Prerecruits ...................................................................... 31
Appendix 8. Long term Abundance survey Recruits. .......................................................................... 32
Page |3Page |4
Background
This report provides an assessment of abalone stocks for the Western Zone (WZ) of the Victorian
Abalone Fishery. The report attempts to provide an easily understood summary of the fishery and
its performance, by reporting on the Primary and Secondary Performance Indicators and Reference
Points of the fishery’s Harvest Strategy, for use at the January 2020 TAC Workshop. This report
should be read in conjunction with the fishery’s Harvest Strategy and Management Plan, referring
to Objectives and interpretations, and following the TAC Workshop will include up to date Reefcode
Reports and Workshop Minutes.
Since AVG was confirmed in 2005, the Western Abalone Divers Association (WADA) and Victoria
Fisheries Authority (VFA) have developed a conservative harvest strategy to recover stocks of
abalone in WZ. Recovery of Mature biomass was encouraged (Figure 1 left) by leaving areas of the
fishery closed for 3-5 years, and restarting fishing with a larger minimum size limit of 130-135 mm.
Conservative catches, with planned spatial management of catch, also contributed to the Legal
biomass (>130 mm) being maintained at levels above that prior to AVG (Figure 1 right), while
waiting for the recovery of Mature biomass to again supply greater numbers of juvenile abalone
and their growth to the fishery. CSIRO modelling suggested recovery in the Mature biomass and
subsequent recruitment of juveniles should increase from 2016 onwards. Further, both before and
during the recommencement of fishing, WADA ensured the best-available information about stocks
was collected from abundance surveys implemented by WADA and VFA, the voluntary use of GPS,
depth and measuring loggers while fishing, and spatially managing catch including Structured
Fishing surveys. All this data, and related information particularly from observations and
interpretation by commercial divers in the open Workshop process, has been used in generating
TAC advice for the fishery since 2009. Consistent with the Harvest Strategy, the Status of Australian
Fish Stocks latest assessment in 2018 determined the WZ Fishery stock status to be Sustainable.

Figure 1. Estimates of the biomass of Mature (left) and Legal-sized (right) abalone in WZ from VFA abundance
surveys since 2003, at Current sites (blue) and All sites sampled (red). Note, blue circles cover red circles for
the last 3 years as Current sites are All sites sampled since 2017. Horizontal lines show Target and Limit
Reference Points for Mature biomass (i.e. Targets calculated from Current sites, and All sites), and average
2012-13 Legal biomass.
                                 Western Zone                                                                      Western Zone
                                 Mature biomass                                                                    Legal biomass
                                                                     Current sites
                       5                                             All sites sampled 1.2

                                                                                                      1.0
                       4                               1.7x 2012-2013
                                                                                     Biomass (t/Ha)

                                                       Current sites                                            2012-13
      Biomass (t/Ha)

                                                                                                      0.8
                       3                               1.7x 2012-2013
                                                       All sites sampled                              0.6

                       2                                                                                                  2012-13
                                                                                                      0.4
                                                           0.5x 2012-13
                       1                                   Current sites                              0.2

                       0                                                                              0.0
                           2004 2007 2010 2013 2016 2019                                                    2004 2007 2010 2013 2016 2019

                                   Fishing period                                                                   Fishing period

                                                                                                                                     Page |5
The Harvest Strategy and assessment of stocks in WZ is dominated by information from fishery-
independent abundance surveys developed by VFA since the early 1990s. Concerns about the
surveys, and how representative they are of the fished stocks and their recovery, have been
expressed by Industry and were summarised by the Chairman in the 2016 TAC Workshop minutes,
and may impact interpretation of estimates presented in this report. An independent expert
review also made a series of recommendations about change in the abundance survey, and the
need for development of additional data sources about the fishery. The Harvest Strategy notes the
need to develop the data from GPS loggers for greater use as a fishery Performance Indicator, and
interpretation as a Primary Indicator in the Harvest Strategy, in addition to surveys. In 2017, VFA
reduced the number of sites sampled in the abundance surveys. This change in design created at
least two different ways of interpreting the results of the surveys, and both are presented in this
report to display the range of possible interpretations. First, the abundance surveys (i.e. Indicators
and Reference Points) can be interpreted by considering data only from the Current sites sampled
through time (i.e. defined as the same 23 sites currently sampled, for all years), while alternatively,
the surveys (i.e. Indicators and Reference Points) can also be interpreted by considering All sites
sampled through time (i.e. up to 38 sites in some years).
The Harvest Strategy describes several Primary and Secondary Indicators at the scale of WZ, Spatial
Management Units (SMU) and Reefcodes. The Primary Indicators are the Legal-sized and Mature
biomass, and the number of Prerecruit abalone, with the WZ-scale indicators used to assess overall
status of the stock, consistent with the operational objectives and reference points in the Harvest
Strategy, while the SMU indicators are used in guidance for TAC setting. Here, the report first
presents the Primary Indicators compared to their Target and Limit Reference Points at the scale of
WZ, and then presents Primary and Secondary Indicators for each SMU.
Catch and catch rate are calculated from commercial logbook data that is released by VFA to WADA
(i.e. with privacy release from divers), while sizes of abalone landed are from GPS loggers operated
by WADA, and both include data until the end of September 2019. Average length of abalone
landed through GPS-enabled loggers are shown as raw and standardised for abalone >135 mm (i.e.
to allow comparison with years where a 135 mm size limit was used in the fishery), and proportion
of abalone 120 mm) from 2003 to 2019 are also released by VFA to WADA, and
combined to estimate biomass of Legal (>130 mm), Mature (>102 mm) and Under-sized (110-129
mm) abalone, and standardised estimates of abundance, although it remains unclear how
representative the sites are of the fished or broader abalone population in WZ.
The Harvest Strategy also provides guidance for future Total Allowable Commercial Catch (TACC)
based on change in estimates of the total Legal biomass of abalone within each SMU, and an
agreed range of Harvest Fractions (Table 1). This approach was developed since 2009, as fishing
recommenced following AVG, and has been applied every year and interpreted during the TAC
Workshops. Estimates of Legal biomass are calculated from abundance surveys (i.e. both VFA and
WADA fishery-independent abundance surveys have been used), and GPS logger and alternative
approaches have also been developed to provide supplementary information. In this report,
estimates of total Legal biomass are calculated only from VFA abundance survey Current sites
within each SMU (i.e. with no calibration or stratification as done previously, as proposed by VFA in
Page |62018), with catch for various Harvest Fractions, and a more detailed comparison of alternative
calculations in Appendix 1.
The Harvest Strategy also describes a Reefcode and local-scale assessment process completed with
divers and guidance from Primary and Secondary Indicators. Observations by commercial divers,
and their interpretation of available data, assessment of stock conditions, and appropriate future
catch, are an important part of the Harvest Strategy and considered in detail at the TAC Workshop.
A summary of those observations and comments will be appended here following the Workshop.
Assessment of Primary Indicators relative to Reference Points
The Harvest Strategy has a Target Reference Point for planned recovery, and two Limit Reference
Points that relate to rules for breakout and review of the Harvest Strategy. These reference points
were developed from CSIRO modelling of the WZ abalone population and likely recovery scenarios,
and are based only on abundance survey data at the scale of the WZ fishery. The Target Reference
Point refers to the planned target for Mature biomass in the fishery by 2020, and is measured
relative to the Mature biomass in 2012-13. The Target Reference Point is a Mature biomass in 2020
that is 1.7x or 70% higher than that in 2012-13. One of the Limit Reference Points is also related to
a Mature biomass of 0.5x or 50% lower than that in 2012-13. A further Limit Reference Point is
related to estimates of the number of Prerecruit (80-119 mm) abalone in the abundance surveys,
and is measured relative to the Prerecruits in 2003-06 prior to AVG.
The changed design of the VFA abundance survey has implications for the Reference Points and
interpretation of the data in the Harvest Strategy framework. The Harvest Strategy Reference
Points refer to estimates of density at survey sites during specific time periods (i.e. Mature Biomass
2012-13, and Prerecruit 2003-06), and were derived during development of the Harvest Strategy
using all sites sampled at the time. The VFA abundance survey revised in 2017 dropped sites using
three criteria, and that were lower in density than those that were retained (Figure 1 left).
Calculation of Reference Points and Indicators using current (i.e. higher density) sites only, rather
than all site sampled at the time, increases the Reference Points and Indicators above that
identified in the Harvest Strategy (Figure 1 left). Here, we present Reference Points for both
Current sites and All sites in Figure 1, and subsequently only display Reference Points from Current
sites (Figure 2), and note the comment in the Harvest Strategy on the need for consideration of any
changes in survey design on application of the Reference Points.
The Target Reference Point, and one of the Limit Reference Points, relate to estimates of Mature
Biomass from the abundance surveys. Estimates of Mature biomass reached their lowest point in
2009 at about 50% of the 2012-13 biomass (Figure 2), and then increased to 2012-13 and a density
of 2.2 t per Ha at current sites sampled. Estimates of Mature biomass then peaked in 2016, at 2.9 t
per Ha at current sites sampled, or 33% above 2012-13, before declining to 8% above 2012-13 in
2019. Because lower density sites were not sampled from 2017, the average density at all sites
sampled was higher, and in 2017 reached 1.6x the Mature biomass of 2012-13, before declining to
2019. Estimates of Mature biomass have remained above the Harvest Strategy Limit Reference
Point of 0.5x the biomass in 2012-13, and below the Target Reference Point of 1.7x the biomass in
2012-13, and do not appear likely to reach either Reference Point in the near term (see Summary
for further discussion).
Page |7Estimates of Mature biomass are also available for each SMU, and are only presented for current
sites sampled, and shown as a 2-year average (e.g. Figure 2, 2019 is average of surveys in the 2017-
18 and 2018-19 fishing periods, for comparison with Prerecruits). While each SMU has shown
considerable among-year variation in estimates of the density of Mature biomass, all SMU have
remained within the Limit and Target Reference Points, and most have approached the Target
Reference Point in individual recent years (i.e. not averaged across 2 years). Mature biomass at
Warrnambool, estimated in the VFA surveys, has dropped by more than 50% in 2019 (i.e. individual
year) since a peak in 2017, and is approaching 0.5x the biomass in 2012-13. Averaged across 2018
and 2019, Mature biomass at Warrnambool is 87% of the 2012-13 level.
The second Limit Reference Point refers to the number of Prerecruit (80-119 mm) abalone in the
abundance surveys, and is measured relative to the Prerecruits in 2003-06 prior to AVG. The Limit
Reference Point is 0.44x or 44% of the Prerecruits estimated in 2003-06, is calculated from a 2-year
average (e.g. 2019 is average of 2017-18 and 2018-19), and is only assessed from 2018 to 2020.
Estimates of Prerecruits at the scale of the WZ reached their lowest point in 2010 at about 18% of
the 2003-06 numbers, and then have generally increased reaching a peak in 2019 at about 51% of
2003-06 at Current sites sampled, which is above the Limit Reference Point since 2017 (Figure 2).
Estimates of Prerecruits are also available for each SMU, and are only presented for Current sites
sampled, and shown as a 2-year average (Figure 2). While each SMU has shown considerable
among-year variation in estimates of Prerecruits, there has also been a general increasing trend in
each SMU, despite declines in recent years at Warrnambool and Port Fairy. In 2018, all SMU were
above the Limit Reference Point, but by 2019, a decline in Prerecruits at Warrnambool to 33% of
the 2003-06 levels, had dropped estimates below the Limit Reference Point. As noted in the
Harvest Strategy, such variation among years in the number of Prerecruit abalone is likely to be
influenced by annual variation in year-class strength.
The Harvest Strategy also details an approach to determine the status of the WZ fishery and stock,
relevant to the assessment for the Status of Australian Fish Stocks (SAFS). The fishery and stock are
determined to be Sustainable when the Mature Biomass is above the Limit Reference Point from
the Harvest Strategy, and the calculated Harvest Fraction of the Legal biomass is below 15%.
Estimates of the Mature biomass in 2019 are above the Limit Reference Point, and Harvest
Fractions estimated at the 2018 TAC Workshop ranged among SMU from 4.5% to 13.7%. As a
consequence, the approach described in the Harvest Strategy determines the WZ fishery and stock
of blacklip abalone as Sustainable.
Page |8Figure 2. Estimates of Mature biomass and number of Prerecruit abalone for Western Zone and each SMU (i.e.
only Current sites sampled are shown on right), relative to Target (green line) and Limit (red line) Reference
Points from the Harvest Strategy. Mature biomass is shown as proportional change since 2012-13, and
number of Prerecruits since 2003-06. Note, for Mature biomass all estimates are set to 1 in 2012-13, and
show each year as a proportion of 2012-13, while for Prerecruits, all lines are set to 1 for the average of 2003-
06. Prerecruit estimates are averaged across 2 years, as is Mature biomass for comparison and as historically
presented.
Julia Percy
Western Zone Current sites SMU Port Fairy
All sites Portland
Mature biomass Mature biomass Warrnambool
2.0 2.0
1.7x 2012-2013
Change since 2012-13 (prop)
Change since 2012-13 (prop)
Target Reference Point
1.5 1.5
1.0 1.0
0.5 0.5
0.5x 2012-2013
Limit Reference Point
0.0 0.0
2007 2010 2013 2016 2019 2010 2013 2016 2019
Number Prerecruit 80-119 mm Number Prerecruit 80-119 mm
0.8 0.8
Change since pre-AVG (prop)
Change since pre-AVG (prop)
0.6 0.6
0.44x 2003-2006
Limit Reference Point
0.4 0.4
0.2 0.2
0.0 0.0
2007 2010 2013 2016 2019 2010 2013 2016 2019
Fishing period Fishing period
Page |9Summary of Primary and Secondary Indicators
Portland
Fishing restarted at Portland in 2012 and increased from 9 t with Structured Fishing (i.e. fine scale
planned allocation of catch), to 28-30 t from 2014, but with only 10.4 t caught until September
2019 of a 28.6 t target (Figure 3). For several years, catch has been concentrated in a few key
Reefcodes including Watersprings, Blowholes, South Bridgewater, Jones Bay and Outside Nelson.
In more recent years, catch at Watersprings and Blowholes has reduced, while catch has increased
Outside Nelson and Devils Kitchen. Raw and standardised catch rates have gradually increased
from about 60 kg/h in 2012 to over 80 kg/h in 2016, and about 90 kg/h until September 2019.
Both the raw and standardised length of abalone decreased from 2012 to 2017, with the average
length of abalone >135mm decreasing from 143.2 to 141.1 mm (Figure 3). Raw and standardised
length of abalone then increased sharply in 2018 and to 144.3 mm 2019. GPS information collected
while measuring was used to compare the length of abalone on core fishing grounds (i.e. defined as
areas with ~75% of effort) and other areas (i.e. ~25%). Lengths of abalone increased both on core
fishing grounds (i.e. std 141.3 mm in 2017 to 145-146 mm in 2018 and 2019), and away from core
grounds (i.e. std 142.5 to 146-148 mm in 2018 and 2019) where more abalone were measured.
This suggests some divers may be fishing away from core grounds and catching larger abalone.
Abundance surveys at Portland include 5 sites on Bridgewater, with 1 site at Whites, 3 sites at
Watersprings (although one site only had 1.3 Prerecruits 80-119 mm and 2.2 Recruits >120 mm per
transect) and 1 site at Tits, and 3 sites on Nelson at Murrels, Jones Bay and Devils Kitchen.
Prerecruits (i.e. 80-119 mm) and the biomass of Unders (i.e. 110-129 mm) have both increased
substantially since 2009, with the biomass of Unders increasing from 220 kg/Ha in 2009 to 960
kg/Ha on Current sites surveyed in 2019 (Figure 3). In contrast, biomass of Legal-sized (>130 mm)
abalone on Current sites surveyed in 2019 was very similar to that in 2009, at about 500 kg/Ha.
Biomass of Legal-sized abalone increased to almost 1000 kg/Ha prior to the recommencement of
fishing in 2012, declined to 443 kg/Ha by 2014, recovered again to 756 kg/Ha in 2015, before again
declining to 535 kg/Ha in 2019 at Current sites. Biomass of Mature (> 102 mm) abalone is
dominated by individuals under the Legal-size (i.e. currently about 80% below v 20% above 130
mm), and like the Unders index, has increased substantially since 2009 from 1094 kg/Ha on Current
survey sites to 2470 kg/Ha in 2019, where it has been stable for the last 3 years (2017-2019). While
Prerecruits have declined substantially since 1992 (i.e. noting this was a time prior to strongly
increasing catch rates in the WZ and Vic fishery), and recovered since their low in 2009, Recruits
have declined comparatively little since 1992 (Appendix 7 and 8 for Prerecruits and Recruits).
Total Legal-sized biomass is estimated from the density of Legal-sized abalone on Current sites
surveyed, which is extrapolated to the area of historically-productive reef (Table 1). Estimates of
the area of historically-productive reef (i.e. previously estimated by divers) are also consistent with
recent estimates of the area of fishing activity recorded on GPS loggers. Estimates of the density of
Legal-size abalone have reduced in 2018 and 2019, and together with the changed approach to
calculation caused by dropping survey sites, have led to a substantial decline in estimates of
biomass at Portland to 205 t. This reduced biomass was foreshadowed last year by the estimates
prepared by VFA based on only the 2018 density estimate. The current catch target of 28.6 t
represents a Harvest Fraction of 14% from the estimated Legal-sized biomass of 205 t (Table 1).
P a g e | 10Figure 3. Fishery performance indicators for the Portland SMU. Catch is shown to the end of September 2019 (green bar, and average catch per day in 2018 above) with full
year Target (grey bar), raw and standardised Catch rate (+SE) and average length of abalone logged. Abundance survey figures show estimates of biomass of Unders, Mature
and Legal-sized abalone at Current sites and All sites sampled each year.
Catch and catch rate Survey Unders, 110-129 mm Survey Legal, >130 mm
490 kg/day
100 60 2.0 2.0
Catch rate (kg per hour)
50
Unders biomass (t/Ha)
80
Legal biomass (t/Ha)
1.5 1.5
40
Catch (t)
60
30 1.0 1.0
40
20
0.5 0.5
20 10
0 0 0.0 0.0
2007 2010 2013 2016 2019 2007 2010 2013 2016 2019 2007 2010 2013 2016 2019
Raw Current sites
Standardised All sites
Portland Summary
Catch stable in recent years.
Logger lengths Survey Mature, >102 mm
150 3.0 Catch rate increased for 2 years.
Average length >135 (mm)
2.5
Mature biomass (t/Ha)
Abalone size decreased until 2017,
145 2.0 and increased for last 2 years.
1.5 Since 2012, Legal-sized abalone
decreased and Unders increased,
140 1.0 while Mature abalone are stable.
0.5 In recent years, Legal-sized abalone
are stable.
135 0.0
2007 2010 2013 2016 2019 2007 2010 2013 2016 2019
Year Year
P a g e | 11Julia Percy
Catch at Julia Percy was around 13-21 t from 2006-11, declined to 3.7 t all from Prop Bay in 2012,
and was closed to fishing in 2013 to help recovery (Figure 4). Catch then increased from 2.3 t in
2014 to 4.8 t in 2018, and a target of 6 t in 2019 with 0.3 t caught by the end of September. Most
increase in catch has occurred in Prop Bay. Raw and standardised catch rates initially declined to
about 50-60 kg/h, but following closure and reduced catch, have increased to about 80 kg/h on the
higher 130 mm size limit from 2015-2018. Standardised catch rates peaked in 2018, and only 1
days fishing was completed for 300 kg at about 60 kg/h prior to the end of September 2019.
Both the raw and standardised length of abalone increased from 2009-2012 to 2014, following
closure and reduced catch, before declining to similar levels again in 2017 and increasing in 2018
and 2019 (i.e. only 1 days fishing, Figure 4). Recent increases in length have occurred mostly at
Prop Bay, although smaller increases have also occurred at reefcodes on the northside, and the
larger increases appear to represent some divers moving away from the core fished ground and
catching larger abalone.
Abundance surveys include 2 sites at Prop Bay, and one on North East Reef and the East side (i.e.
these 4 sites are both Current sites and All sites sampled). Prerecruits (i.e. 80-119 mm) and the
biomass of Unders (i.e. 110-129 mm) decreased to a long-term low in 2013 at about 393 kg/Ha,
before increasing to a peak in 2018 of 1173 kg/Ha on Current sites surveyed (Figure 4). Biomass of
Legal-sized abalone peaked in 2010 and declined to about 500 kg/Ha in 2013, before gradually
increasing to 890 kg/Ha in 2019. Biomass of Mature (> 102 mm) abalone is less dominated by
individuals under the Legal-size (i.e. about 70% below v 30% above 130 mm), and reached a bottom
in 2013 before recovering to a medium-term average of about 3000 kg/Ha. While both Prerecruits
and Recruits declined to 2013, Prerecruits have only partially recovered since then, while Recruit
numbers appear more consistent with relatively stable numbers since all Current sites were
surveyed in 2000 (Appendix 7 and 8). Further, for the one site sampled before 2000 since 1992,
Prerecruits in 2018-19 were 57% of 1992-93, while Recruits in 2018-19 were almost 200% of 1992-
93 (i.e. 14.2 v 6.5, Appendix 7 and 8).
Total Legal-sized biomass is estimated from the density of Legal-sized abalone on Current sites
surveyed, which is extrapolated to the area of historically-productive reef (Table 1). The area of
historically-productive reef at Julia Percy was estimated from GPS logger data during the period of
higher catch prior to 2013. More recent estimates of the active area of reef fished at Julia Percy are
lower, with the lower catch (Appendix 1). Estimates of the density of Legal-size abalone increased
slightly in 2018-19, and consequently so did the estimate of Total Legal-sized biomass of 52 t at
Julia Percy in 2019. This estimate is based on an area of reef of 59 Ha, and a reduced area of
biomass would be estimated if density was extrapolated to the lower area of reef has been used by
divers in recent years with lower catch (Appendix 1). The current catch target of 6 t represents a
Harvest Fraction of 12% from the estimated Legal-sized biomass of 52 t (Table 1).
P a g e | 12Figure 4. Fishery performance indicators for the Julia Percy SMU. Catch is shown to the end of September 2019 (green bar, and average catch per day in 2018 above) with full
year Target (grey bar), raw and standardised Catch rate (+SE) and average length of abalone logged. Abundance survey figures show estimates of biomass of Unders, Mature
and Legal-sized abalone at Current sites and All sites sampled each year (i.e. note Current sites and All sites are the same at Julia Percy) .
Catch and catch rate Survey Unders, 110-129 mm Survey Legal, >130 mm
446 kg/day
100 50 2.0 2.0
Catch rate (kg per hour)
Unders biomass (t/Ha)
80 40
Legal biomas (t/Ha)
1.5 1.5
Catch (t)
60 30
1.0 1.0
40 20
0.5 0.5
20 10
0 0 0.0 0.0
2007 2010 2013 2016 2019 2007 2010 2013 2016 2019 2007 2010 2013 2016 2019
Raw Current sites
Standardised All sites
Julia Percy Summary
Logger lengths Survey Mature, >102 mm Catch increased in recent years,
5
but well below historic.
150
Average length >135 (mm)
Catch rate stable for several years,
Mature biomass (t/Ha)
4
but only 1 day fishing until Sept 2019.
145
3 Abalone size decreased until 2017,
and increased for last 2 years.
2
140 Since 2013, Legal-sized abalone
1 Unders and Mature increased.
135 0 In recent years, Legal-sized abalone
2007 2010 2013 2016 2019 2007 2010 2013 2016 2019 are stable, but Mature abalone
decreased.
Year Year
P a g e | 13Port Fairy
Fishing restarted at Port Fairy in late 2009, with catch of 7 t during Structured Fishing, that was
increased to over 21 t in 2012, reduced to about 13-14 t for 2 years, and then increased again to
over 21 t in 2018, with a target of 22.4 t in 2019 (Figure 5). Catch has increased in all reefcodes in
recent years, with the Crags producing over 10 t in 2018. Raw and standardised catch rates have
gradually increased from around 50 kg/h to a peak over 60 kg/h on a 130 mm size limit in 2017.
Standardised catch rate has increased more than raw catch rates, at least partly caused by
increased days and catch by one diver at lower catch rates inside the lagoons.
Both the raw and standardised length of abalone peaked during 2010, and decreased to a low with
the length of abalone >135mm averaging under 140 mm in 2017, before increasing to 143.3 mm up
to the end of September in 2019 (Figure 5). GPS information collected while measuring was used to
compare the length of abalone on core fishing grounds compared to other areas. Lengths of
abalone on core fishing grounds increased but were more stable within the range of recent years,
while more larger abalone were measured and away from core grounds. This suggests divers may
be increasingly fishing away from core grounds and catching larger abalone.
Abundance surveys include 5 sites at the Crags, and a newer site in Watertower (although this site
averaged only 1 Recruit >120 mm and 4 Prerecruit abalone 80-119 mm per transect in 2018-19, and
has been excluded from biomass calculations for several years until 2019). Prerecruits (i.e. 80-119
mm) and the biomass of Unders (i.e. 110-129 mm) have both increased substantially since 2008-10,
with the biomass of Unders increasing from 344 kg/Ha in 2008 to 1542 kg/Ha in 2016 and declining
to 932 kg/Ha on Current sites surveyed in 2019 (Figure 5). In contrast, biomass of Legal-sized (>130
mm) abalone on Current sites increased 142 kg/Ha in 2007 and reached a peak of 1492 kg/Ha in
2010, before mostly declining to 735 kg/Ha in 2019. Biomass of Mature (> 102 mm) abalone is
dominated by individuals under the Legal-size (i.e. about 75% below v 25% above 130 mm), and like
the Unders index, has increased substantially since 2007 from 1392 kg/Ha on Current survey sites
to 4740 kg/Ha in 2016 and 3155 kg/Ha in 2019. While Prerecruits have declined since 1992 (i.e.
particularly following AVG), and recovered since their low in 2007, recovery of Recruits after AVG
and their low in 2007 has returned levels similar to before AVG, particularly in 2016 (Appendix 7
and 8).
Total Legal-sized biomass is estimated from the density of Legal-sized abalone on Current sites
surveyed, which is extrapolated to the area of historically-productive reef (Table 1). Estimates of
the area of historically-productive reef were increased in the 2018 TAC Workshop from 215 Ha to
387 Ha, based on logged dive activity within a 1 Ha grid over 3 years prior to 2018. More recent
and alternative estimates of active reef area are lower, ranging up to 330 Ha. With estimates of
Legal-sized density on Current sites increasing, the estimate of Total biomass increased to 262 t for
387 Ha of reef, or 223 t for 330 Ha. The current catch target of 22.4 t represents a Harvest Fraction
of 8.5% of the estimated Legal-sized biomass of 262 t (Table 1), or 10% of 223 t.
P a g e | 14Figure 5. Fishery performance indicators for the Port Fairy SMU. Catch is shown to the end of September 2019 (green bar, and average catch per day in 2018 above) with full
year Target (grey bar), raw and standardised Catch rate (+SE) and average length of abalone logged. Abundance survey figures show estimates of biomass of Unders, Mature
and Legal-sized abalone at Current sites and All sites sampled each year.
Catch and catch rate Survey Unders, 110-129 mm Survey Legal, >130 mm
343 kg/day
100 50 2.0 2.0
Catch rate (kg per hour)
Unders biomass (t/Ha)
80 40
1.5 1.5
Biomass (t/Ha)
Catch (t)
60 30
1.0 1.0
40 20
0.5 0.5
20 10
0 0 0.0 0.0
2007 2010 2013 2016 2019 2007 2010 2013 2016 2019 2007 2010 2013 2016 2019
Raw Current sites
Standardised All sites
Port Fairy Summary
Logger lengths Survey Mature, >102 mm Catch increased in recent years.
150 5 Catch rate decreased for 2 years.
Average length >135 (mm)
Mature biomass (t/Ha)
4 Abalone size decreased until 2017,
145 and increased for last 2 years.
3
Since 2010, Legal-sized abalone
2 decreased and Unders increased,
140 while Mature abalone are stable.
1
In recent years, Legal-sized abalone
0
are stable.
135
2007 2010 2013 2016 2019 2007 2010 2013 2016 2019
Year Year
P a g e | 15Warrnambool
Fishing restarted at Warrnambool in 2011 at 4.2 t with Structured Fishing, and increased to about
10 t during 2013-15 and then 12-13 t, with 7.8 t caught by September 2019 from a 12.0 t target
(Figure 6). Catch was originally concentrated on the inshore areas at Killarney and Mills, and
despite some good daily catches, comparatively little was caught towards Warrnambool. This
changed more recently, and particularly from 2016, with less catch from Mills, and greater catch
from Levys and Thunder Point. Raw catch rates increased to 64 kg/h in 2017, reaching 69 kg/h in
2019. Standardised catch rates have increased a similar amount at higher levels, from 70 kg/h to 75
kg/h in 2019, particularly driven by higher catch rates from some divers at Levys.
Both the raw and standardised length of abalone peaked during 2014 with the standardised
average length of abalone >135mm reaching 144.7 mm, coincident with the first of larger catches
at Levys, before declining to a low in 2017 of 141.3 mm (Figure 6). Raw and standardised length of
abalone then increased sharply in 2018 and to 146.4 mm in 2019 until the end of September.
Lengths of abalone have been stable at Mills and Killarney, while increasing at Cutting and Levys.
Abundance surveys include two inshore sites at Mills and Killarney, with another offshore site at
Killarney, and sites at Cutting and Levys, although the Levys site is distant from most fishing in the
reefcode (and the 2 Killarney sites only had 1.3 and 1.7 Recruit >120 mm abalone per transect, and
the Cutting site only had 1.3 Prerecruit 80-119 mm abalone per transect). Prerecruits (i.e. 80-119
mm) and the biomass of Unders (i.e. 110-129 mm) increased substantially from 2010 to 2017, with
the biomass of Unders increasing from 122 kg/Ha in 2010 to 810 kg/Ha in 2017, before declining
sharply to 370 kg/Ha on Current sites surveyed in 2019 (Figure 6). Similarly, biomass of Legal-sized
(>130 mm) abalone on Current sites increased from 300 kg/Ha in 2012 to 553 kg/Ha in 2017, before
declining to 224 kg/Ha in 2019. Biomass of Mature (> 102 mm) abalone is dominated by individuals
under the Legal-size (i.e. about 75% below v 25% above 130 mm), and like the Unders index,
increased substantially from 881 kg/Ha in 2010 to 2100 kg/Ha in 2017 on Current survey sites, but
declined to 932 kg/Ha in 2019. While Prerecruits have recovered since their low in 2010, Recruits
>120 mm (i.e. mostly 120-130 mm) were near the lowest density observed at 3.7 abalone per
transect in 2019 (Appendix 7 and 8).
Total Legal-sized biomass is estimated from the density of Legal-sized abalone on Current sites
surveyed, which is extrapolated to the area of historically-productive reef (Table 1). Estimates of
the area of historically-productive reef (i.e. previously estimated by divers) are also consistent with
recent estimates of the area of fishing activity recorded on GPS loggers. Estimates of the density of
Legal-size abalone have reduced in 2018 and 2019, and together with the changed approach to
calculation caused by dropping survey sites, have led to a substantial decline in estimates of
biomass at Warrnambool to 109 t. This reduced biomass was foreshadowed last year by the
estimates of biomass prepared by VFA based on only the 2018 density estimate. The current catch
target of 12 t represents a Harvest Fraction of 11% from the estimated Legal-sized biomass of 109 t
(Table 1).
P a g e | 16Figure 6. Fishery performance indicators for the Warrnambool SMU. Catch is shown to the end of September 2019 (green bar, and average catch per day in 2018 above) with
full year Target (grey bar), raw and standardised Catch rate (+SE) and average length of abalone logged. Abundance survey figures show estimates of biomass of Unders,
Mature and Legal-sized abalone at Current sites and All sites sampled each year.
Catch and catch rate Survey Unders, 110-129 mm Survey Legals, >130 mm
354 kg/day
100 50 2.0 2.0
Catch rate (kg per hour)
Unders biomass (t/Ha)
80 40
Legal biomass (t/Ha)
1.5 1.5
Catch (t)
60 30
1.0 1.0
40 20
0.5 0.5
20 10
0 0 0.0 0.0
2007 2010 2013 2016 2019 2007 2010 2013 2016 2019 2007 2010 2013 2016 2019
Raw Current sites
Standardised All sites Warrnambool Summary
Catch increased in recent years,
Logger lengths Survey Mature, >102 mm and shifted toward Warrnambool.
150 3.0
Catch rate increased for several years,
Average length >135 (mm)
2.5 with shift in catch.
Mature biomass (t/Ha)
145
2.0 Abalone size decreased until 2017,
and increased for last 2 years.
140 1.5
1.0
Since 2010, Legal-sized abalone stable
135 Unders and Mature increased.
0.5
In recent years, Legal-sized, Unders
130 0.0 and Mature abalone decreased
2007 2010 2013 2016 2019 2007 2010 2013 2016 2019 substantially.
Year Year
P a g e | 17Table 1. Estimates of legal-sized biomass (t), and catch (t) for different Harvest Fractions (%, HF) from last
year’s TAC Workshop (Last year TAC and VFA method), and revised with the average density for 2018 and
2019 (Update density). Catch plan from TAC advice are also shown since 2014. Methods of calculating
biomass include Last year TAC and VFA method (i.e. both used in 2019 Workshop, with average 2017 and
2018 data used in Last year TAC, and only 2018 data in VFA method), Update density (i.e. includes density
average from 2018 and 2019, compared to Last year TAC which used 2017 and 2018), Density change (i.e. %
change in Legal biomass from 2017 and 2018 average from last year’s Workshop, to 2018 and 2019 average),
and New calibration (i.e. calibration of Current sites surveyed with earlier WADA surveys).
SMU, Reefcode Portland Julia Percy Port Fairy Warrnambool
1.02-2.10 3.01-3.04 3.05-3.08 3.09-3.14
Biomass method
Last year TAC t 370 50 249 268
VFA method t 209-263 29-47 146-263 148-167
HF
5% 18.5 2.5 12.5 13.4
10% 37.0 5.0 24.9 26.8
15% 55.5 7.5 37.0 40.2
Update density t 205 52 262 109
HF
5% 10.2 2.6 13.1 5.5
10% 20.5 5.2 26.2 10.9
15% 30.7 7.8 39.2 16.4
Density change % -15% +3.7% +2.8% -34%
New calibration t 198 52 210 146
Catch Target
2014 30 2.75 14 10
2015 32 3.9 16 10
2016 32 3.9 17 10
2017 28 5 19 12
2018 31 5 22 12
2019 29 6 22 12
P a g e | 18Discovery Bay
Blacklip abalone catch from Discovery Bay peaked in 2008 at 16.0 t (and 170 kg of greenlip), at an
average daily catch of 314 kg (Figure 7). Earlier catch from 1979 to 2007 was variable, and
averaged about 1.0 t per year. Since 2008, raw catch rates declined from above 60 kg/h to 40 kg/h
as catch shifted from close to port to more distant reefs, as demonstrated by GPS logger data. One
day of catch in 2018 of 80 kg, was caught at 80 kg/h, and nothing was caught until the end of
September in 2019 with a 4.2 t target. Between 2008 and 2012, GPS loggers were used to measure
more than 27 000 abalone on 47 diver-days, and the average length of abalone >135 mm remained
above 141.7 mm, peaking at 148.5 mm in 2010 following a shift in the distribution of catch.
Figure 7. Catch (green, t), catch rate (red, kg/h) and average length (red, >135 mm) in Discovery Bay. Catch
shown as a gray bar is planned for this fishing period.
Catch and catch rate Logger lengths
100 50 150
Average length >135 (mm)
Catch rate (kg per hour)
80 40
145
Catch (t)
60 30
140
40 20
135
20 10
0 0 130
2007 2010 2013 2016 2019 2007 2010 2013 2016 2019
Year Year
Greenlip abalone
Historical catch of greenlip in WZ has been small, with 41.6 t reported landed from 1965-2005,
including 37.6 t from 1969-1980 and only 850 kg from 1981-2005. The report by Prince (2008)
described “Dutton Way and Hospital Reef reefcodes that were fished regularly during the 1970s,
but landings fell to virtually zero during the 1980s. WADA members attribute this decline in catches
to the principal abalone reefs being covered up by sand, the westward flow of which was disrupted
by the construction of the deep-water port. According to the older WADA members what was left
was a broader area of scattered reef that traditionally was considered to hold fairly sparse ‘stunted’
greenlip stocks which were of relatively little interest while the moratorium on fishing greenlip was
in place and while there were better diving options around the zone.” The report concluded that
with a 7 t catch from Hospital and Dutton, “and considering the conservative nature of the LML
recommended and the recent history of light exploitation, will pose no risk to the long-term
sustainability of the resource on these reefs.”
P a g e | 19Catch of greenlip recommenced in 2006-07 with a 4.2 t TAC, following the mortality from AVG and
reduced catch of blacklip abalone from 2005-06. With increased interest in the greenlip fishery, a
research survey of a small part of Julia Bank (Gorfine, 2007), and a small permit-based research
catch survey of Hospital and Dutton/Minerva reefs was completed in May 2008 (Prince, 2008).
Following this research, a TAC of 7 t was issued for the 2008-09 fishing period. During 2007-2012, a
total of 32.8 t was landed from Julia Bank, and 28.5 t from the adjacent Hospital-Dutton-Minerva
(Figure 8). Gorfine (2007) described greenlip on Julia Bank as being ‘seldom fished’ particularly as it
was considered stunted with few individuals above the 130 mm size limit, more recent Industry
comments suggest the greenlip stock was not fished prior to 2007, and no information is available
to confirm any commercial fishing prior to 2007. GPS logger data distributed across localized
fishing areas across a large area of offshore Julia Bank has now demonstrated many much larger
greenlip populations (e.g. often averaging >160 mm).
Figure 8. Catch (green, t), catch rate (red, kg/h where no blacklip catch) and average length (red, >135 mm) of
Greenlip. Catch shown as a gray bar is planned for this fishing period, and logger lengths are shown where
more than 500 abalone measured. Catch of greenlip where no blacklip catch ranged from 94-100% of total
greenlip catch by year from 2017, and about 2000 greenlip have been measured from 2017-2019.
Catch and catch rate Logger lengths
80 50 180
Hospital-Dutton-Minerva
Average length >135 (mm)
Catch rate (kg per hour)
170 Julia Bank
40
60
160
Catch (t)
30
40
20 150
20
10 140
0 0 130
2007 2010 2013 2016 2019 2007 2010 2013 2016 2019
Year Year
In recent years, catch has been about 1.3-1.4 t in 2017 and 2018, and 0.223 t until the end of
September 2019 (Figure 8). Compared to earlier catch, which was dominated by Hospital, Dutton
and Minerva reefs, and then inshore on Julia Bank, more recently, catch has been dominated by
areas further offshore. Small catches have also come from other reefcodes (Table 2). Catch rates
have ranged from about 30 kg/h to 60 kg/h, with higher catch rates at Hospital and inshore Julia
Bank, and have been influenced by different size limits (i.e. regulated and voluntary) and the
gradual shift of catch among different areas, with a catch rate of about 32 kg/h in 2018 (i.e. where
only greenlip were caught). Following a period of relatively stable average lengths from 2007 to
2012, average lengths of greenlip have increased significantly to over 160 mm in 2018, and are
likely to be related to the shift of catch among different areas and particularly to further offshore
P a g e | 20on Julia Bank mostly by one diver. Since 2017, almost 1.8 t of greenlip have been landed from Julia
Bank on 19 diver days averaging 93 kg from 2.7 hours effort per day, with over 2000 measured with
GPS loggers by end of September 2019.
Table 2. Catch (kg) of greenlip by SMU from April 2017 until September 2019. Reefcodes with catch were
Killarney and the Cutting at Warrnambool, Burnets, Watertower and Lighthouse at Port Fairy, Blowholes at
Portland, and Eastside at Julia Percy.
SMU
Fishing Period Julia Bank Warrnambool HosDuttMin Port Fairy Portland Julia Percy
2017 600 kg 437 kg 243 kg 8 kg 8 kg 1 kg
2018 1017 kg 263 kg 112 kg 2 kg
2019 159 kg 64 kg
P a g e | 21Summary
The Victorian Wild Harvest Abalone Management Plan required development of a Harvest Strategy
for the Western Zone fishery. A Harvest Strategy was prepared based on the approach developed
and used for TAC advice in the years following AVG, with the addition of clear Performance
Indicators, Reference Points and Decision Rules. The Harvest Strategy describes a process involving
assessment of Primary Indicators against specific Target and Limit Reference Points, and when
above Limit Reference Points, a Workshop process involving consideration of Primary and
Secondary Indicators, including particularly commercial diver interpretation and assessment.
Guidance on the TAC is provided to the Workshop by estimates of Legal biomass and the
application of a range of Harvest Fractions for each SMU.
This report provides an assessment of Primary Indicators against the Target and Limit Reference
Points of the Harvest Strategy. The current (i.e. 2019) level of Mature biomass is well above the
Limit Reference Point across WZ and in each SMU. The current (i.e. 2018-19) number of Prerecruit
abalone (80-119 mm) is above the 2018-2020 Limit Reference Point across WZ and in each SMU,
except Warrnambool (i.e. noting it was above in Warrnambool in 2018). Maintenance of Prerecruit
numbers above the Limit Reference Point could be influenced by variation in year-class strength.
The Harvest Strategy details breakout rules if Primary Indicators are below Limit Reference Points at
the scale of WZ. Primary Indicators are above both Limit Reference Points at the scale of WZ.
Despite the signs of recovery, the current Mature biomass remains well below the 2020 Target
Reference Point, and has declined for the last 3 years. Mature biomass is dominated by Under-size
abalone, and so is also likely to also be influenced by variation in year-class strength. Recent
declines in Mature biomass follow a large increase in the biomass of Under-size abalone to 2016,
and are more closely related to declines in Legal-sized biomass in recent years. Further, there are
also concerns that the abundance surveys are not representative of stocks and their ongoing
recovery (see below). To reach the Target Reference Point for Mature biomass a further strong
recruitment of Under-size abalone would be required, of at least similar magnitude to the 2016
peak, together with maintenance of Legal-sized biomass. The Harvest Strategy does not detail any
actions if the Target Reference Point is not met by 2020.
This report also provides a summary of Primary and Secondary Indicators within each SMU to
provide guidance for future TAC and help interpretation, particularly by divers, during the TAC
Workshop. These indicators suggest that stocks of Mature and Legal-sized abalone have been well-
protected by the increased 130 mm size limit, and despite some declines, are generally being
maintained across the fishery, while the biomass of Under-sized abalone has been increasing
strongly, particularly in some areas previously impacted by AVG. This is consistent with the
predictions of timing of recruitment and growth of Under-sized abalone from the CSIRO modelling.
Over the last 2-3 years, there have been some declines in the abundance survey and commercial
diver catch rates, and further, some evidence of divers fishing more outside what have been core
areas. Strong numbers of Under-sized abalone have peaked and declined in some SMU, whilst
increasing further in others, as might be expected from spatial variation in year-class strengths.
These observations can be summarised in the context of the medium-term strength of the WZ stock
and fishery recovering from AVG over the last >10 years, while continuing to experience shorter-
P a g e | 22term fluctuations in productivity, particularly from recruitment and environmental influences. With
the impact of such fluctuations, TAC should continue to be set conservatively to encourage ongoing
recovery.
The Harvest Strategy notes the time period needed in recovering the Mature biomass following
AVG, and allowing increased successful reproduction, followed by the growth of newly recruited
abalone to be fully visible in the abundance survey (i.e. 100-110 mm), and then to grow further to
above the 130 mm size limit to be available to the fishery. CSIRO modelling estimated an increase
in the Mature biomass following AVG would increase successful reproduction from about 2011 (i.e.
from 19% to 28% R/R0), leading to an increase in recruitment to be visible in the abundance survey
from 2017 (i.e. 6-7 years old, 100-110 mm). The growth used in the CSIRO modelling also estimated
a further 3-4 years before the 2011 year-class would then reach the fishery at 130 mm. If this
timing is correct, with increased recruitment and growth of abalone born after some recovery of
the Mature biomass from AVG, then the 2011 year-class would be expected to reach 130 mm and
be available to the fishery after 9-11 years, or 2020-2022. If this occurs, the increase in Prerecruit
numbers and Under-size biomass, visible in the abundance surveys in recent years, should
increasingly translate to recovery of the Legal-sized biomass and fishery in the WZ.
Reference Points from the Harvest Strategy are based only on data from the abundance survey, and
it remains unclear how representative the sites are of the fished or wider abalone population in
WZ. Further, there has been a reduction in sites sampled during the survey, that has complicated
earlier methods of calculating indicators from the Harvest Strategy, including increasing the Target
Reference Point (i.e. by excluding lower density sites). These issues have been discussed for some
time, and were summarised in the Independent Chair’s TAC Workshop summary in March 2016,
where it was noted “site representativeness is an issue with any fixed site survey approach”, and
“the Western Zone does have a potential way to progress this through use of a combination of the
logger and survey information. This could take advantage of the best features of both – the
standardised sites and methods of the surveys and the more comprehensive area/habitat coverage
and flexibility of the commercial operations”. An independent review of the Abundance Surveys
(Hart, 2016, Review of fixed site surveys used by the Victorian Abalone Science Program)
recognized the concerns about the design of the abundance survey, and made a series of clear
recommendations about improvements in design and interpretation, and use with GPS logger data
from the commercial fishery.
The current Harvest Strategy notes “If there are significant changes to the way that the indicators
are calculated, for example through changed survey design or changed standardisation, then the
implications to reference points, decision rules and harvest strategy performance should be re-
examined”, “In the course of application of this harvest strategy methods to estimate density of
exploitable biomass from commercial diver GPS logger data should be developed, evaluated and, as
appropriate, included as a primary indicator” and “With more consistent and extensive data now
available from GPS loggers, and greater opportunity for calibration of estimates of density from
loggers and surveys, it expected that the use of data from loggers in the estimation of Performance
Indicators will increase”. The Harvest Strategy describes ongoing development actions and
timeframes, to ensure the opportunity for improvement in fishery Performance Indicators are
incorporated quickly into management of the fishery.
P a g e | 23Estimates of biomass calculated from the abundance surveys are similar to those used in previous
TAC Workshops, although some substantial declines in estimates of biomass have occurred
following changes to the survey design, interpretation and calculation methods (e.g. no calibration
or stratification) and some recent reductions in density in the abundance survey. Estimates of the
Harvest fraction of current catches generally remain around 10%, which was demonstrated in the
CSIRO modelling to be consistent with ongoing recovery of the abalone stocks in Western Zone.
Expected rates of growth suggest increases in Prerecruit and Under-sized biomass observed in
recent years, should increasingly lead to recovery of the Legal-sized biomass. Despite that, several
challenges remain to the ongoing development and application of the Harvest Strategy, including
particularly consideration of the most informative monitoring program, and ongoing management
of recovery in the Western Zone abalone fishery.
Action list for 2020
1. Consolidate VFA and WADA methods into one document, and revise plan for next year’s
Stock Assessment.
2. Review Abundance surveys, considering recommendations of the Independent review and
the Sainsbury FRDC project.
3. Review GPS loggers and their use in the Harvest Strategy, considering use in other states
and the Sainsbury FRDC project, and including agreement on a Primary Indicator.
4. Address comments from the Audit Report.
5. Progress the review of the current Harvest Strategy 2016-2020, for implementation from
2021.
P a g e | 24P a g e | 25
Appendix 1. Biomass calculation and sensitivity tables.
Table 1. Estimates of density (kg/Ha) of legal-sized abalone from WADA and VFA surveys using different methods of calculation (including by individual year and averaged
across 2 years), stratified within and among SMU, and used in calculations of legal-sized biomass for TAC advice since 2009. Note also, an estimate 0.500 t per Ha of legal
abalone is about 4 abalone per transect. These calculations are documented here to aid consideration of discussions at the 2018 TAC Workshop, but will be described in
more detail in the Technical Methods.
                    SMU, Area, Reefcode                          Portland                        Julia Percy          Port Fairy          Warrnambool
                                                   B’water       OutsideN InsideN                  JPercy        PFairy       Crags      MKC      W’bool
             Method                               1.02-1.08      2.01-2.03 2.04-2.10              3.01-3.04    3.06-3.08       3.05    3.09-3.11 3.12-3.14
 WADA survey                                          1.060          0.810     0.390                               0.920         0.765     0.390     0.490
 Matching VFA survey, old                             0.588          0.695     0.251                     0.609     0.997 1.368 (1.110)     0.388     0.195
 Matching VFA survey, current sites                   0.835          1.203     0.520                     0.609     1.368         1.368     1.203     0.190

 2013-14 TAC                                           1.012          0.514          0.390               0.643          0.807            0.671          0.480          0.490
 2014-15 TAC                                           0.872          0.377          0.449               0.768          0.788            0.582          0.440          0.477
 2015-16 TAC, old sites                                0.932          0.641          0.704               0.855          0.683            0.665          0.404          0.528
 2016-17 TAC, mix sites                                0.909          1.070          1.210               0.893          0.719            0.608          0.443          1.430
 2017-18 TAC, current sites                            0.776          1.087          1.717               0.848          0.721            0.538          0.376          2.160

 2018 TAC VFA (WADA repeat)                                  0.558 (0.553)                 0.802 (0.868)                 0.679 (0.738)                  0.432 (0.412)
 2018, no calibrate                                    0.314      0.810              1.230         0.868                     0.738                      0.305      0.840
 2019, no calibrate                                    0.544      0.505              0.550         0.890                     0.874                      0.178      0.410

 2018-19, no calibrate                                 0.429          0.658          0.890               0.879                0.806                     0.241     0.625
 2018-19, original calibrate                           0.773          0.767          1.383               0.879                0.744                     0.242     1.571
 2018-19, new calibrate                                0.545          0.443          0.668               0.879                0.542                     0.078     1.612
 2018-19, joint                                                     0.544                                0.879                0.676                         0.318

 2016 Sites (2017, Current sites)                       11 (5)          3 (2)          6 (1)              4 (4)        7 (5+)              5 (5)         5 (4)          2 (1)

                                                                                                                                                                  P a g e | 26
Table 2. Estimates of reef area and legal-sized biomass from different methods of estimation and calculation, and used in calculations of legal-sized biomass in recent years.
SMU, Area, Reefcode Portland Julia Percy Port Fairy Warrnambool
B’water OutsideN InsideN JPercy PFairy Crags MKC W’bool
Method 1.02-1.08 2.01-2.03 2.04-2.10 3.01-3.04 3.06-3.08 3.05 3.09-3.11 3.12-3.14
Reef area, previously used 212 121 43 59 144 (223) 71 (164) 265 78
376 59 387 343
Succorfish, 2019, >20 min per Ha 150 23 124 110
Succorfish, 2019, >5 min per Ha 295 39 204 239
Succorfish, 2017-19, >20 min per Ha 260 28 200 204
Succorfish, 2017-19, >5 min per Ha 456 56 330 374
Succorfish, 2017-19, 20-5/20% 7.3% 5.7% 5.0% 8.9%
Succorfish, 2017-19, >20 min av per Ha 112 min 164 min 151 min 104 min
Succorfish, 2017-19, >5 min av per Ha 69 min 87 min 95 min 62 min
Succorfish, 2017-19, max per Ha 1067 min 847 min 807 min 657 min
Reef area, 3 yr dive effort, 2018 471 36 387 386
Reef area, 3 yr length >20, 2018 344 38 227 183
Biomass, 2016-17 182 129 52 53 104 43 117 111
Biomass, revise density, 2017-18 165 132 74 50 104 38 100 169
Biomass, density and area, 2017-18 196 152 134 31 161 88 113 184
Biomass, VFA modified, 2018 209 47 146 (263 area) 148
Biomass, WADA comparable 2018 217 53 158 (285 area) 146
Biomass, joint 2018-19 205 52 262 109
P a g e | 27You can also read