2018 CATEGORY HIGHLIGHTS - British Association for Screen Entertainment
←
→
Page content transcription
If your browser does not render page correctly, please read the page content below
2 018 C AT E G O R Y H I G H L I G H T S

    C H A M P I O N I N G T H E G R O W T H O F S C R E E N E N T E R T A I N M E N T
                          ACROSS D ISC A N D D I G ITAL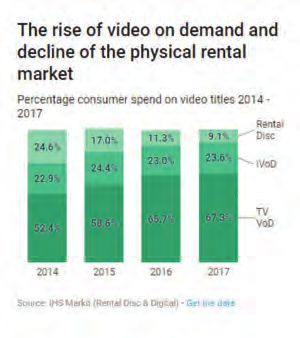
M A R K E T TO P L I N E
                                                                            “the2017  saw the third consecutive year of growth across
                                                                                 category, with the total value of the market up by 7.5%
                                                                            to a staggering £2.69 billion. A year of diverse content,
                               £2.689M
                                                                            audience engagement with premium formats and growth in
                          TOTAL VIDEO MARKET
                                                                            the digital market have all contributed to an ongoing success
                                                                            story and, in an evolving market, have all played their part
                                                                            in maintaining engagement with the category.
            OWNERSHIP                                  RENTAL               At the heart of BASE lies the belief that we all benefit from innovation
                DVD                                       SVoD              born out of challenging the status quo. Running parallel to this is the
              DIGITAL                                     TVoD              appreciation that understanding our customer is key to enhancing
                U-RA                                     HYSICA             success and so we must respond to changing consumer behaviour
              BL
                    Y

                                                     P

                                                              L
     +16%    -11%        -18%               +17%      -16%           +26%   whenever we’re given the chance. In particular, we should look at
             £162 M                                     £40 M
                                                                            the younger end of our audience base, given how much they have
              £271 M                                   £402 M               traditionally invested in the content we deliver. They continue to be
              £580 M                                  £ 1,2 34 M            offered more choice, more distraction, and more opportunity to be
                                                                            entertained than ever before, which needn’t be a negative: by
                                                                            spending time understanding their needs we place ourselves at the
                                      OVER
                                                                            heart of being able to deliver them, whether we’re looking at content,
                                                                            value or platform.
                                      215m
                                RA                                          2018 will undoubtedly be another year of evolution, but few would
                                              NS
                               T

                                     N S A C TIO
                                                                            question the ongoing love affair the consumer has with screen
                                                                            entertainment. We’re surrounded by opportunities so it’s critical we take
                                                                            advantage of them, that we move forward together to offer a modern,
                                                   DIGITAL                  forward-thinking industry that makes our already brilliant content all
                        DISC
                                                                            things to all audiences. At BASE, our growing, increasingly diverse
                                115M
                                                                                                                                                   ”
                                     COPIES SOLD
                                                                            membership underlines that there’s entertainment for every mood and
                                                                            every moment so let’s make sure we’re delivering to every audience.

                                                                            Robert Price
                                                                            Chairman, BASE
                                                                            Managing Director, Twentieth Century Fox Home Entertainment UK
                                                   62%
                                               of all content paid
                                               for is now rental/
                                               subscription

02
BA S E I N 2018
“theAscategory.
        our membership continues to grow, BASE remains wholly committed to championing the interests of stakeholders across
                By adopting this approach, and by challenging ourselves to work to promote the category in an inclusive,
insightful way, we truly believe that we’re in a fantastic space to deliver.
As we gather pace in 2018, we aim to work hand in hand with retail to energise the category space in store; we’re taking steps to elevate consumer
understanding around and engagement with the digital market; uniting global and local partners to seize the opportunity 4K UHD presents us
with and giving the category a forward-facing voice in the development of a consumer chart offering. This is all part of a packed agenda that
includes a full roster of educational opportunities and events that get the category talking, ensuring our four core tenets remain at the heart of all
our deliverables:

                              1. Youth                                                                   2. Leadership

   This year, the Breakthrough Group takes shape, inviting                       It’s a constant source of pride to see how engaged
   those starting their careers to get involved and influence                    BASE members are, a constant reminder of the
   the conversation. The Breakthrough Panel at this year’s                       brilliance of a category replete with ideas on how
   Insight Forum is just one aspect of how we’re striving to                     to move forward. Seen as a home for best practice,
   deliver the full mix of opinion as we develop strategy in                     BASE aims to hone those ideas into positive outputs
                     an ever-evolving market                                                   and measurable successes

                            3. Diversity                                                                 4. Innovation

   Every consumer is different but every consumer must                           Tried and tested routes shouldn’t be ignored, but nor
   be considered. Our members offer a rich mix in                                must new ways of thinking that challenge and stretch the
   terms of both content and delivery but central to our                         field of what we can achieve together. With so much
   considerations should always be the consumer and all                          passion for the category on offer, we aim to be a haven
   of his or her nuances – a represented audience is an                                        for innovation and creativity
                     engaged audience

                                                                                    ”
Central to BASE is the desire to create an environment where partnership and collaboration can thrive, one where growth is incubated through
shared knowledge and where industry-wide activity can stimulate shared success.

Liz Bales
Chief Executive, BASE

                                                                                                                                                   03
S AV E T H E DAT E
               BA S E E D U C AT I O N DAY
           M AY 17 T H – D I S N E Y H A M M ERS M I T H

                     BA S E AWA R D S
            J U N E 7 T H – TO BACCO D O CK

C AT E G O RY S H OWC A S E & I N N OVAT I O N FO R U M
          J U LY 4T H – PI C T U R EH O US E CEN T R A L
CO N T EN T I S K I N G
The depth and rich variety of titles that topped the charts
meant that 2017 most certainly didn’t disappoint when it
came to flagship releases.
The biggest success story belonged to Walt Disney Studios Home
Entertainment with its live action remake of Beauty and the Beast
seeing off robust competition by selling more than 1.55 million
copies across physical and digital retail (including box sets). Disney’s
success continued with its release of Rogue One: A Star Wars Story,
which sold in excess of 1.38 million copies across all formats.

The rest of the top 10 (including box sets), which included Disney’s
Moana and Guardians of the Galaxy – Vol. 2., Twentieth Century
Fox Home Entertainment UK’s Trolls, Universal Pictures Home
Entertainment Sing, Bridget Jones’s Baby and Despicable Me 3
and Warner Bros. Home Entertainment Group’s Fantastic Beasts And
Where To Find Them and Dunkirk, all sold more than 500,000
copies each, with the top five titles each selling more than one million
units across combined physical and digital platforms.

Non-film titles (including box sets) also enjoyed success, with key
performers including Game of Thrones - Season 7 and The Crown
Season 1, documentaries such as Blue Planet II, sports & fitness
including Joe Wicks – The Body Coach Workout and The British &
Irish Lions 2017: Lions Uncovered, non-theatrical children’s including
Pokemon the Movie – Volcanion and the Mechanical Marvel,
whilst Micky Flanagan – An’ Another Fing Live dominated the
stand-up comedy market outselling the combined performance of the
top 90 laughter titles, as classified by The Official Charts Company.

Independent studios continued their strong performance in the Blu-ray
market, with Arrow Films becoming the eighth largest supplier of high-
definition content with a 32% year-on-year uplift. These growth figures
were contributed by the Blu-ray release of The Thing, which bought
in total sales of £335,000, and Phantasm I-IV with £214,000 worth
of sales in 2017.

Many blockbusters also flew the British flag in 2017, as half of the top
10 films were British productions, with Beauty and the Beast, Rogue
One: A Star Wars Story, Fantastic Beasts And Where to Find
Them, Bridget Jones’s Baby and Dunkirk all being shot in the UK.

                                                                           05
M A R K E T S H A R E – D I ST R I B U T I O N
Universal Pictures Home Entertainment once again
dominated the market across volume and value share from
the start of the year, and it lead the way in terms of physical
sales for six months over the year. The studio took a
                                                                                                            EST FILM
                                                                                                          MARKET SHARE
19.7% share of volume and an 18.2% share of value
across physical retail, powered by a diverse slate from both
Universal Pictures Home Entertainment and Paramount                                                                                            15.7%
Pictures that featured a strong mix of original content,
                                                                                                                                               15.1%
such as Get Out and the latest reboots of Baywatch and
The Mummy.                                                                                                                                     10.2%
Universal Pictures Home Entertainment’s diverse slate in 2017 saw                                                                              10.1%
them being ranked number one for volume sales across film (including
animated content), pre-school/school-age and sports & fitness genres,                                                                           8.1%
and ranked second and third within the Music and TV genres.

Warner Bros. Home Entertainment Group reclaimed the number one                The leading EST label was Universal Pictures Home Entertainment with
slot within the Blu-ray format with a 21.5% value share and 18.6%             a 15.7% share.
share of volume. This performance was supported by its TV sales which
represented 25% of its Blu-ray consumer spend, a spend that is more           There was also good news for independent studios, with
than double that of the next nearest TV distributor on this premium format.   Spirit Entertainment and RLJ Entertainment both moving into the top
                                                                              10 rankings in 2017 with a 44% and 16% physical video consumer spend
                                                                   18.2%      growth respectively.
                                                                   16.3%      With over 100 titles selling more than 100,000 discs across the year,
                                                                   14.5%      the market saw an even spread of distributors titles hitting this milestone
       SHARE OF                                                    14.5%      with Twentieth Century Fox Home Entertainment UK and Warner Bros.
      RETAIL DISC                                                             Home Entertainment Group leading the way with 19 titles, Universal
      MARKET (£)                                                              Pictures Home Entertainment with 18, Walt Disney Studios Home
                                                                    7.4%      Entertainment with 16 and Sony Pictures Home Entertainment with 15.

06
I N TRO D U CI N G T H E BASE D I G I TA L YE A R B O O K
ACCES S N OW V I A T H E M E M B ERS A R E A O F T H E BA S E W EB S I T E
B uil d y o u r ow n u niq u e Ye a r b o o k u sin g t h e n e w int e ra c t i v e p l a t fo r m, w h e re
y o u c a n a c c e s s a ll t h e l a t e s t c a t e g o r y s t a t is t ic s t h a t y o u w ill n e e d a n d w a nt.
V i s u a l s s h o w n a r e e x a m p l e s o n l y a n d d o n o t r e f l e c t t h e f i n a l v e r s i o n.M A R K E T S H A R E – R E TA I L
MARKET SHARE MARKET SHARE MARKET SHARE MARKET SHARE
21.7%
2016
23.5%
2017
6.7%
2015
11.5%
2017
BLU-RAY ONLY
High street specialist HMV saw the largest growth in In the grocery sector, the combined performance of the top four (Tesco,
consumer spend market share for physical disc (for the 52 Sainsbury’s, Asda and Morrisons) saw volume market share at 40.5%,
w/e period to 14 January 2018), up 1.8 percentage points driven from the 43% market share seen on DVD. When looking at grocer
to 23.5%. Amazon remains the largest disc retailer with a volume share of DVD sales, Morrisons stands alone as the only grocer to
24.3% share of the market. grow its market share year-on-year, now standing at 6.3%.
Seasonal performance during Q4 of 2017 played a key role for both For over-the-top (OTT) platforms, increases in retail share during the 12-
retailers, with HMV coming out on top with a 26.8% share of the week period to 14 January 2018 were seen by both Amazon Instant
market for the 12 weeks to14 January 2018. The combined share of Video and Google Play Store generating a higher share during this
spend for both HMV and Amazon increased by over three percentage period compared to their market share for the year. Amazon Instant
points from the previous two years to 53%, further endorsing the Video achieved 17.5% market share in this period, compared to
healthy slate during this period. 14.6% for the year, whilst Google Play Store saw 8.4% compared to
its total share of 5.2%.
Impressively, Zavvi grew its Blu-ray market share to double digits,
representing 11.5% of consumer spend, over 70% growth on its market The digital market continued to thrive in 2017, with Sky and iTunes
share achieved two years ago. remaining the leading platforms with combined value share static at 76%.
PHYSICAL RETAIL DIGITAL RETAIL
SHARE (VOLUME) SHARE (£)
2017 2017
15.1% 49.7%
2016 2016
17.2% 41.7%
2017 2017
10.3% 26.7%
2016
2016
11.3% 35.4%
2017
2017
9.5% 14.6%
2016
2016
10.1% 12.6%
2017
2017
5.6% 5.2%
2016
2016
4.9% 5.1%
08M A R K E T S H A R E – R EN TA L & SU B S CR I P T I O N
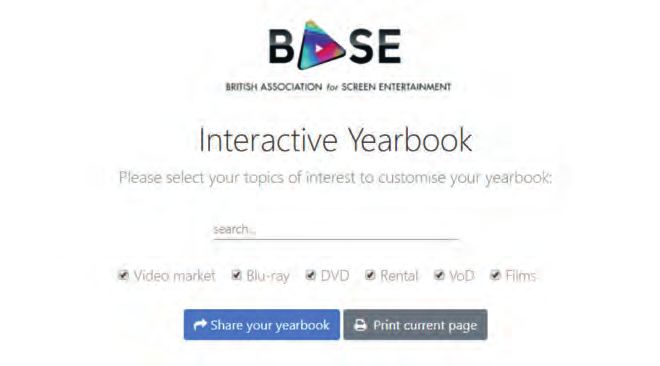
Due to the growth in available digital platforms, the RENTAL SHARE PAY TV TVoD (£)
rental & subscription market is now worth £1.675 billion,
representing 62% of the overall category in 2017.
SVoD saw year-on-year growth of 26%, whilst the combined TVoD (Pay 83.4% VS 11.7%
TV VoD and iVoD) share of rental spend for 2017 saw a year-on-year
decrease to 24% as a result of growth in the subscription market.
With a UK & Ireland customer base of 12.9 million, Sky’s year-on-year
market share in the Pay TV VoD rental space remained at 58%, underlining 31.4% 23.1% 17.7%
that digital rental is a key route for consumers to access content.
Delving into the differences between Pay TV VoD and iVoD, there are
two front runners in the former with Sky and Virgin making up 95% of
this market, with iVoD seeing more of a diverse offering.
iVoD saw Amazon Instant Video take the largest share for the first time
with over 30%, whilst iTunes stands at 23%. Google Play Store saw
the largest market share growth of 58% year-on-year to near 18% share
of consumer spend.
LoveFilm’s exit from the physical rental market towards the end of 2017
naturally had an impact on its market share, dropping 11% to 55%
market share across a market total of 12 million rentals for 2017.
With market spend at £1.234 billion, subscription services now
account for 46% share of the overall home entertainment category. RENTAL SHARE iVoD (£)
The growth of subscription services is largely influenced by the different
routes of access on offer to consumers, such as viewing content via internet
enabled TVs, a route taken by 37% of the population. Last year also saw
SVoD penetration at 32%, up 2% on the previous year.
The number of consumers paying for a subscription package as a 75.5% PAID
standalone cost now accounts for 75.5% of subscriptions. The
remaining 24.5% is made up of free trials (13.8%), with 10.7% viewing 13.8% FREE TRIAL
as part of a wider TV package. RENTAL SHARE
SUBSCRIPTION 10.7% FREE WITH OTHER
SUBSCRIPTION
09The Entertainment Quiz committee, formed by members of BASE, Lee & Thompson,
Lionsgate, Paramount, Pulse, Snapchat, The Telegraph, Universal and Way to Blue
invites you to attend the 3rd annual
ENTERTAINMENT
QUIZ OF THE YEAR
Thursday 27th September 2018, 18:30
Plaisterers’ Hall, One London Wall, London EC2Y 5JU
in support of add.org
Enjoy an evening of food, unlimited wine and beer served to your table and the chance
to steal the ‘Ultimate Entertainment Team’ trophy from last year’s winners, Disney.
Tables available from £2,500 for tables of ten
To book, please contact us:
Tel: 07850 929 805 Email: entertainmentquiz@actionforchildren.org.uk
actionforchildren.org.uk/entertainmentquizOW N ERS H I P
PLANNED BROWSED /
PURCHASE IMPULSE PURCHASE
57%
56.7% 43.3%
27%
FILM
15%
1% 74.8% 25.2%
VALUE TV
SHARE OF
OWNERSHIP
41.0% 59.0%
CHILDREN’S NON-THEATRICAL
Ownership continued to be a significant driver to the video Sales figures for 4K UHD saw a healthy year-on-year increase of more
category’s success as it was worth over £1.013 billion than 279% to be worth £10.3 million. Planet Earth II led the way in
in 2017, with DVD remaining the favourite format amongst terms of 4K UHD sales, with 31% of its volume sales across 2017 being
UK consumers. delivered by the premium format. Classic titles enjoying new life on the
format also benefitted, such as Blade Runner – The Final Cut, with 21%
Last year saw 57% of all value sales being driven by DVD, whilst EST of overall Blu-ray units sold for this reissue coming from 4K UHD sales.
continued to show strong growth in 2017, increasing 16% year-on-year
to make up 27% of consumer spend in the ownership market.
Impulse purchasing of discs remained key to the category with non-
theatrical Children’s content leading the way with 59% of spend,
increasing to 74% of disc impulse purchases made in-store. For Film,
over 43% of consumer spend was based on the same purchasing
behaviour, representing over £500 million during 2017.
Supported by the first full year of 4K UHD, Blu-ray’s share of spend
for 2017 remained static at 16%. Sales across this premium format
represented 6.4% of Blu-ray consumer spend, thanks to the number
of available titles doubling as more and more distributors, such as
StudioCanal, BBC Worldwide and Walt Disney Studios release 4K
UHD content.
11PRO D U C T AG E – N E W R EL E A S E
NEW RELEASE SHARE OF SPEND
PLANNED PURCHASE BROWSED / IMPULSE PURCHASE
65.2% 34.8%
77.5% 22.5%
68.7% 31.3%
Worth a total of £345.6 million, physical new release 4K UHD continues to support the growth of the Blu-ray share within
sustained its share of the total disc market at 47%, despite the new release disc market, which now represents 26% of consumer
2017 seeing a reduced number of new unique titles being spend. 2017 saw over 100 titles released on this premium format,
released. The total physical new release share was driven from with 62% of these coming to market alongside the main DVD/Blu-ray
release (the remaining 38% are known as new to the format). These
the middle part of the year where 42% of new release sales
new titles drove 64% of the total 4K UHD consumer spend within 2017
were delivered; the first time in the past four years that market
and represented near 8% of all Blu-ray new release sales.
share during this period of the year has been over 40%.
For the first time in three years the average selling price for new releases
In 2017, the film slate represented 49% of all new titles coming to
remained flat at £11.39, which was driven by a second year of higher
market, which drove 78% of consumer spend across new titles. The
pricing on Blu-ray, and the average price across DVD dropped by less
largest contributor to this was new family content (including animated
than 1%, compared to a 2% drop for the previous two years.
film and child/family combined), with share of spend at 23%, which
was driven from just 6% of new unique titles.
The Q4 period played an important role in the new release market;
with over 36% of the annual consumer spend occurring during this
period. The genres that made the largest contributions during Q4
were TV, with titles such as Game of Thrones - Season 7, The Crown
Season 1 and Blue Planet II playing a role in the 60% of total
consumer spend, and Pre-School/School-Age titles such as Trolls –
Holiday and Olaf’s Frozen Adventure contributing towards the 51%
of its total consumer spend.
12PRO D U C T AG E – C ATA LO G U E
CATALOGUE SHARE OF SPEND
PLANNED PURCHASE BROWSED / IMPULSE PURCHASE
53.1% 46.9%
64.1% 35.9%
61.1% 38.9%
The catalogue market saw share of spend remain at 53% saw a 182% uplift month-on-month, with nearly 30,000 units sold in
during 2017, whilst volume share came in at a larger share November following the BBC TV airing of the new series.
of 63%. One of the biggest opportunities for the catalogue market came during
Drafting content against theatrical releases continued to be a Q4, with the total share of spend tracking at between 35% and 37%
key opportunity, with strong successes during 2017 coming from for the genres of film, children and TV.
Paddington, Blade Runner, and Trainspotting benefitting from sequels The in-store retail market remains key for catalogue sales with 60% of
or relaunches. all spend being driven from impulse shopping, which is significantly
The same trend in drafting success was seen with TV content, with the higher than the 45% total impulse shopping spend across catalogue.
Sky Atlantic airing of Game of Thrones - Season 7 in July delivering a Supported by content across film and children genres, the average
catalogue sales uplift of 58% month-on-month. Similarly, Peaky Blinders price in 2017 bounced back into growth, up by nearly 2%, which was
driven in Q2 of the year. The average price during Q3 came in at
£7.47, the highest seen during the period of July to September across
the past four years.
13CO N SU M ER T R EN DS
Over 15.7 million people bought into the category in 2017,
CONSUMER SPEND
with the average shopper either picking up 6.0 physical
discs across the year or making 4.7 digital purchases.
There was a decrease in spend amongst those buying 10 or more discs,
AVERAGE ANNUAL which now represents 13% of the consumer base. However, the younger
15.7M
PEOPLE BROUGHT
SPEND UP £2.00
YoY TO £58.21
shopper remained a strong advocate of the physical format, with their
share of spend above 50% for those aged between 20 and 34.
CONTENT
When looking at the Blu-ray market, 6% of buyers bought 10 or more
discs, making up nearly 44% of the total share of spend, a growth of
6.5 percentage points year-on-year.
13.8M
PEOPLE PAYING FOR
5.4M
PEOPLE PAYING FOR Digitally, the share of consumers buying more than 10 copies fell
SUBSCRIPTION RENTAL
slightly year-on-year, down 1.3 percentage points. Encouragingly, the
share of buyers purchasing between 2 and 5 digital copies increased
by 5.0 percentage points year-on-year, and consumers buying just
CONSUMER BUYING 10 OR MORE COPIES
once declined by 3.9%. These shifts won’t come as a surprise as this
purchase format continues on its growth trajectory.
When viewing people’s purchase intent for either personal use or
family use, Kantar Worldpanel found that digital proved to be the
13.0% 5.8% 7.8%
best way to connect with consumers watching as a family, as 55% of
BUYER BUYER BUYER
all spend on EST was claimed for family use, taking it ahead of DVD
56.1% 43.7% 47.1% with 54% of spend.
SPEND SPEND SPEND
Gifting remains core to physical disc sales, with over 26% of all
DVDs bought in the last year being purchased with gifting in mind.
CONSUMER PURCHASE INTENT Digital purchase remains a key opportunity for this market, with 5%
of all digital new release purchases being gifted, a 260 percentage
growth on the previous year.
46.4%
51.5%
45.0%
PERSONAL USE
53.6%
48.5%
55.0%
FAMILY USE
14CO N SU M ER T R EN DS
In 2017 females accounted for 39% of category consumption, a drop figure. The largest shift in where males consume content is from digital
of 2.5% year-on-year. When looking at the content purchased/rented platforms, which grew to 18.5% share, up from 14.5% and now higher
by females, 61% was via the physical format, matching that from the than TVoD.
previous year. The number of discs rented dropped from 11.6% to 9%
Even though males lead the way with higher consumption of content
in 2017, largely as a result of the transition to digital platforms, which
across transactional routes, there is more of an even share for SVoD
is now up to 30%.
with a split of 55% of males and 45% of females. When looking at
Males now account for 61% of all discs purchased, with this peaking total SVoD with a view of consumers with access but no subscription,
on Blu-ray at 74% share of all total sales, with EST sharing the same the split shifts to 51% for males and 49% for females.
CONSUMER SHARE OF SPEND
61.9%
16.9%
Disc Purchase
12.6%
Transactional VoD
9.0%
50.7%
EST
16.4%
Disc Rental
18.5%
14.4%
15WITH TH A N KS...
Films
S O U RCES...
FOOTNOTES
Kantar; The Kantar Worldpanel data is based on the 52 week period to 14th January 2018, which is four weeks later than what has previously been reported.
This is to ensure that all market performance and shopper behaviour includes Christmas purchasing throughout December. The 2017 Category Highlights used
Kantar data for the 52 week period to 18th December 2016.
IHS Markit; The overall entertainment content breakdown is in accordance with data from global information services provider IHS Markit. Due to additional data
sources becoming available, IHS Markit has restated its digital market estimates during the past year, resulting in this new information not being directly comparable
to previous Category Highlights documents.
ACKNOWLEDGMENT FOR USE OF IM AGES
20th Century Fox Home Entertainment, Abbey Home Media, Arrow Films, BBC Worldwide, Entertainment One, Lionsgate UK, Manga Entertainment, Paramount
Pictures, RLJ Entertainment, Sony Pictures Home Entertainment, Spirit Entertainment, StudioCanal, Universal Pictures UK Ltd, The Walt Disney Company, Warner Bros.You can also read