Investor Presentation - The Fresh Winner in Discount Retail
←
→
Page content transcription
If your browser does not render page correctly, please read the page content below
Investor
               `
                  Presentation
The Fresh Winner in Discount Retail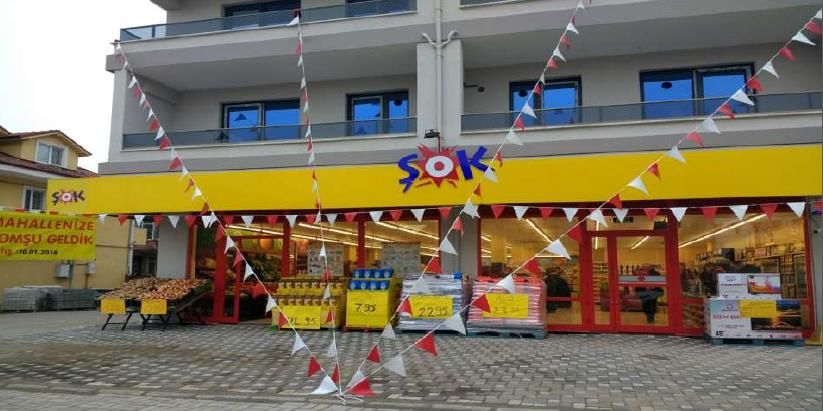
Research Guidelines
AGENDA

Company summary

Investment proposition

Key Drivers of growth

Financials

Appendix: - Senior Management
          - Shareholder structure   Confidential

                                             1
We are The Fastest Growing Grocery
Retailer in Turkey

                                                                                      $2.4bn                                           5,100                                     +c.1,000
                                                                                                                                                                                 New stores
                                                                                        Turnover                                       Stores(1)
                                                                                                                                                                                opened p.a.(2)

                                                                                           40%                                           16%                                           $94m
                                                                                                                                     LFL sales
                                                                                         CAGR(3)                                                                                     EBITDA(5)
                                                                                                                                     growth(4)

                                                                                           96%                                         1,500                                           650m
                                                                                      Cash                                                                                      Transactions
                                                                                                                                        SKUs(7)
                                                                                   conversion(6)                                                                                    p.a.(7)

Source: Management information, Central Bank of Turkey.
Note: Financials converted from TL to USD at FX 3.6445, average for 2017, based on TCMB.
        Unless otherwise noted, financials presented for Şok, excluding impact of UCZ and Non-Şok operations (5)      Adjusted EBITDA FY2017A. Defined as operating profit / loss plus depreciation & amortisation, before
        of Teközel.                                                                                                   other income / (expense), historical royalty payments on brands acquired and results of Non-Şok
(1)     As at 31 December 2017.                                                                                       operations of Teközel.
(2)     Last 3 years average p.a.                                                                               (6)   Consolidated financials for FY2017A; defined as Net cash generated in operating activities – capex
(3)     Turnover CAGR 2015A-2017A.                                                                                    (excludes refurbishment of old stores & warehouses) / Adj. EBITDA.                                   2
(4)     Şok stores only. Like-for-like sales for FY2017 calculated on the basis of daily net sales generated in (7)   Şok stores only.
        2017 by stores operating on 31 Dec 2015 and that were still open on 31 Dec 2017.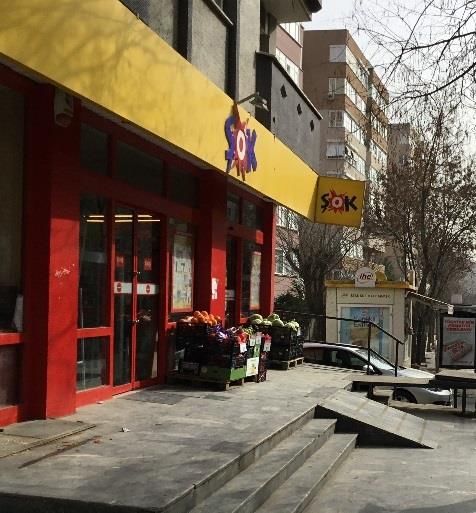
We Have Come a Long Way
Phase III: 2015 …
Transformation & Organic Growth
Phase II: 2015 c.2,700 stores transformed in 2016
New Format Design and 2017
Phase I: 2011-2014 Strong store opening of c.1,000
Acquisitions & Integration New management stores p.a.
New discount format Şok became fastest growing
Acquisition of DiaSA and enhancing shopping retailer in the market
Onurex experience
White Space Opportunity
Refined SKU and product Introduced Fresh and
mix Personal Care
Introduced strong Private
Label brands
Founded in
1995
2011
Turkish Retail Investments B.V.(1) Stores Sales (TLm)(2)
acquired Şok stores from Migros
Saw significant opportunity
8.713
in Discount retail segment 5.100
4.5x 6.6x
Believe Şok was an asset
with a huge potential if
properly managed 2.301 3.584
1.144 1.325
(3)
2012A 2014A 2017A 2012A 2014A 2017A
Source: Management Information.
(1) Yıldız Holding currently controls 100% of Turkish Retail Investments B.V. 3
(2) All financials presented for Şok, excluding impact of UCZ and Non-Şok operations of Teközel.
(3) 2012 sales as per IFRS audited financials.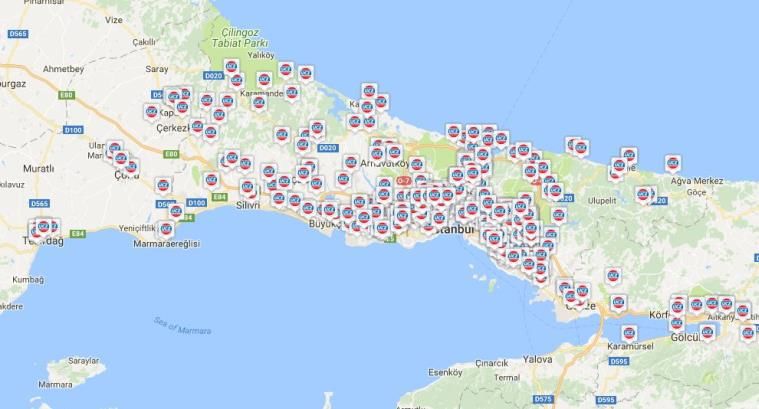
Research Guidelines
Our Investment Proposition is Exciting

Most Attractive Grocery Market
in Europe

Winning Proposition with
a Differentiated Format

Excellent Operational Execution

Superior Growth and Cash Flow
Generation

Significant Profitable Growth
Opportunity                              Confidential

                                                  4
One of Europe’s Fastest Growing
Markets, where Discount Outperforms

                                                                                                                                                                                                  High growth
                                                                                                                                                                                                  market
                   Grocery Market Growth in Turkey(1)(2)

                                                                                                                                   Modern channel is taking share

                                                                                                                                                                                                  proposition
                                                                                                                                                                                                  Winning
                                                                                          46%

                                                                                                                                                                                                  Operational
                                                                                                                                                                                                  excellence
                                                                                                                                    Discount is the winning format
                                                                     28%
                                                                                                                                       with highest share gains

                                                                                                                                                                                                  performance
                                                19%

                                                                                                                                                                                                  Superior
       13%
                           11%

                                                                                                                                                                                                    Future growth
                                                                                                                        Discount satisfying consumer demands of
                                                                                                                                   proximity and price
      Total           Traditional             Modern             Discount                 Şok
                                                                (incl. Şok)

Source: MK Novo Analysis for Traditional, Modern & Discount growth rate, Management information for Şok growth rate.
(1)     2012-17A Grocery Retail Market Size CAGR, calculated by annual household consumption, at fixed 2017 exchange rates and using current prices; market data based on MK Novo analysis.
(2)     Revenue growth between 2012-2017 (CAGR) presented for Şok, excluding impact of UCZ and Non-Şok operations of Teközel. 2012 sales as per IFRS audited financials.
                                                                                                                                                                                              5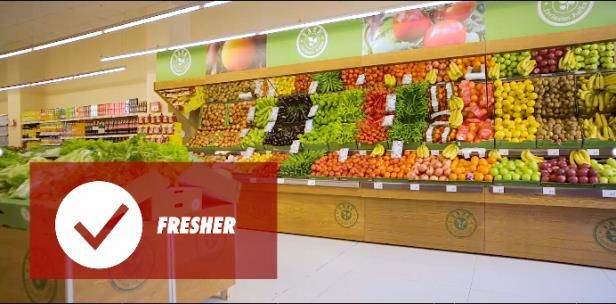
Increasing Modern Penetration with
Continued Momentum
High growth
market
Wave of Change in Turkey Turkey Behind Other European Markets
Evolution of Store # by Channel (‘000) Share of Grocery Market (value)
proposition
Forecast
Winning
240
15%
19%
28 203
34%
55%
60%
165
68%
72%
Operational
excellence
14
85%
81%
10
66%
45%
40%
32%
28%
performance
2008 2012 2017
Russia
2023P
Poland
Germany
2008
2012
2017
2008 2012 2017
Superior
Modern Retail Traditional Retail
Turkey 2017
Modern Traditional
Future growth
Large base of traditional stores still exists
Modern penetration significantly lower than
Also c.400 local supermarket operators other markets
with c.8,100 stores
Source: MK Novo Analysis.
6
Fragmented Market Creates Major
 Market Share Opportunity

                                                                                                                                                                                                                              High growth
                                                                                                                                                                                                                              market
                                                                           Modern Channel                                                                                      Traditional Channel

                                Supermarket                                   Supermarket                                   Discounters
   (As of 2017)

                                                                                                                                                                                                                              proposition
                               National Players                               Local Players                                                                                 Mom & Pop’s / Others

                                                                                                                                                                                                                              Winning
    Number of
    Players(1)                               2                                       c.400                                           3                                                  c.166,000

    Number of
                                         2,271                                       8,100                                      18,250                                                  c.166,000

                                                                                                                                                                                                                              Operational
     Stores(1)

                                                                                                                                                                                                                              excellence
Total Selling Area
  (‘000 sqm)(1)                          2,265                                       5,500                                       4,340                                                      7,111

Average Store Size

                                                                                                                                                                                                                              performance
    (sqm)(1)(2)
                                        c.1,000                                      c.680                                       c.240                                                      c.45

                                                                                                                                                                                                                              Superior
Revenue (TLbn)(1)                           19                                          37                                          45                                                       154

 Revenue Growth

                                                                                                                                                                                                                                Future growth
    2012-2017
                                          17%                                         12%                                         28%                                                       11%

 Market Share(1)                          7.5%                                      14.5%                                        18.0%                                                     60.0%

  Market Share
                                          1.1%                                      (1.3%)                                        8.0%                                                     (7.8%)
Change 2012-2017

  Source: MK Novo Analysis.
  (1)     Data as of 2017.
  (2)     Average Store Size figures represents an average selling area for each retail model consisting of multiple formats with different store sizes. National supermarket have multiple retail formats that include   7
          hypermarkets and large supermarkets (>1000 sqm), supermarkets (>400sqm) and small store formats (
Şok is Already Best-in-Class

                                                                                                                                                                                      High growth
                                                                                                                                                                                      market
                                                                                             Market Evolution

                                                                                                                                                                                      proposition
                          Revenue Growth                                                             # of Stores Growth                     Şok’s Market Share

                                                                                                                                                                                      Winning
                          ’12-’17A (CAGR)                                                             ’12-’17A (CAGR)                           ’12-’17A(1)

          46%                                                                                                                               +2.6ppt           +11.0ppt
                                                                                       35%

                                                                                                                                                                                      Operational
                                                                                                                                                                                      excellence
                                                                                                                                                                          19,3%

                              25%

                                                                                                                                                                                      performance
                                                                                                           19%

                                                                                                                                                                                      Superior
                                                                                                                              16%
                                                 17%                                                                                         8,3%

                                                                                                                                                              3,4%

                                                                                                                                                                                        Future growth
                                                                                                                                    0,8%

                    (2)                                                                        (3)
          Şok                 Other    Supermarkets                                    Şok                Other    Supermarkets
                           Discounters                                                                 Discounters
                                                                                                                                           2012                 2017
                                                                                                                                                  Total Grocery Market Share

Source:   Management information, MK Novo Analysis.                                                                                               Discount Market Share
(1)       Denotes market share in Turkey in Discount and Total Grocery Market, per MK Novo Analysis, determined by Revenue.
(2)       2012 sales as per IFRS audited financials.                                                                                                                              8
(3)       Stores for Şok excluding UCZ per management information.
We Created the Most Relevant
Consumer Offering

                                                                                                          High growth
                                                                                                          market
                                                                                                          proposition
                                                                                                          Winning
                                                                    Exclusive
                                                                                       Shopping
   Proximity                        Price          Choice           & branded
                                                                                      experience

                                                                                                          Operational
                                                                                                          excellence
                                                                    products

                                                                                                          performance
                                                                                                          Superior
                                                   Most relevant       Unrivalled
                                                                                         Carefully
                                   Competitive   product choice,       choice of

                                                                                                            Future growth
      Experts in                                                                       engineered,
                                  everyday low     differentiated   national brands
      convenient                                                                         enjoyable
                                   prices and        by strong       and heritage
       small-box                                                                       atmosphere,
                                    effective     fresh, tobacco       exclusive
        format                                                                        easy shopping
                                   promotions      and personal     brands among
                                                                                        experience
                                                   care offering      discounters

Source: Management information.                                                                       9
Convenient Neigbourhood Locations in Proximity
Every City
High growth
National Store Footprint Conveniently Located in Your Neighbourhood
market
Kırklareli
26 İst. Europe Bartın Store numbers(1)
667 İst.Anatolia 26 Sinop
Edime 436 Zonguldak Kastamonu 26 Artvin Ardahan 101 – 1.000
25 Tekirdağ Kocaeli 55 Karabük 20 Samsun 20
Rize 8
104 103 Düzce 17 97 Trabzon 51 – 100
18 Ordu Giresun 24
Çankırı 62
proposition
Yalova Sakarya Amasya
32 45 83 Bolu 13 30
24 21 Kars 21 – 50
16 Çorum Tokat Gümüşhane 18 Iğdır
5,100 Bursa
11 – 20
Winning
Çanakkale Bilecik 25 27 9 Bayburt Erzurum 9
188
21 5 56
Balıkesir Ankara Kırıkkale Ağrı
1 – 10
stores 186
Kütahya
Eskişehir
66
302 18
Kırşehir
Yozgat
15
Sivas
25
Erzincan
14
Tunceli
20
34 Bingöl Muş
across Manisa
90 Uşak
Afyon
12
Nevşehir Kayseri
1
Elazığ
13 1
Van
33 Malatya Bitlis 7
İzmir
every city 411
16
Denizli Konya
Aksaray
13
19 113 17
24
Diyarbakır
45 Batman
4
Siirt
Aydın Isparta
Operational
in Turkey 53 36 Niğde
K.Maraş Adıyaman
10 1
excellence
99 39 Hakkari
Burdur 10
33 18 Şırnak 1
16 Adana Mardin
Muğla 117 Osmaniye
1
107
Karaman Ş.Urfa 16
Antalya 9 23 Gaziantep 32
323 Mersin 54
154 Kilis
Hatay 5
89
performance
Small-Box Format Maximising Options for Site Locations
Superior
Future growth
Avg. store
size:
218sqm(1)
Source: Management information. 10
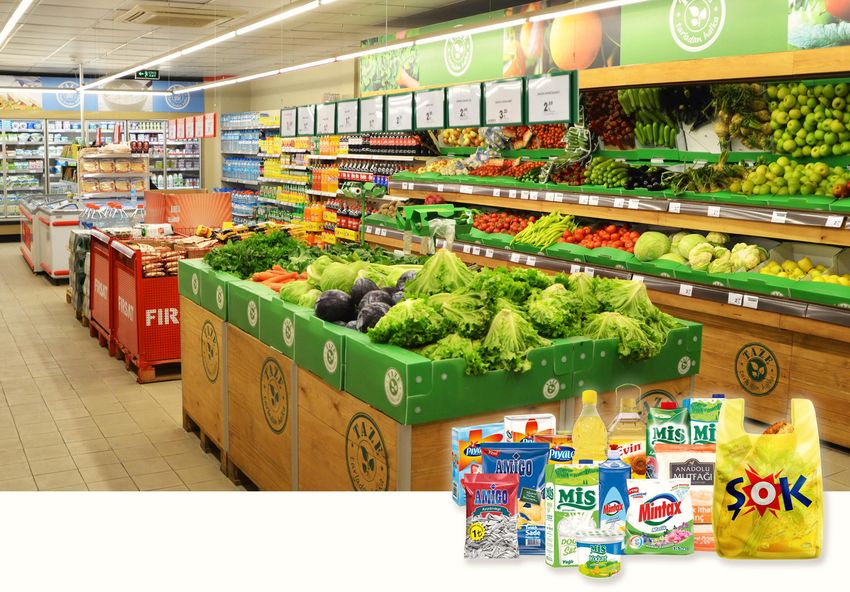
(1) As of Dec-17, excluding Şok Mini.Everyday Low Prices Supported By Price
Powerful Promotions
High growth
Everyday Low Price Model
market
vs.
vs.
Supermarket
proposition
Discount
competitors:
Winning
competitors:
Price match
Price match
or below on
on all
all national
Operational
comparable
excellence
branded
products
products
Discount Supermarket
Competitor Competitor
performance
Greater Variety of Highly Effective, Regular Promotions, Determined on a Network-Wide Basis
Superior
Discount Discount
Promotion type Description Competitor 1 Competitor 2
50% off Buy 1 product, second product 50% off
Future growth
Check-out offers Cashier offers product at check-out
25 TL basket Discount on specific product if basket > TL 25
In&Out Offers on selected non-food products
Source: Management Information. 11Most Relevant Product Choice Choice
High growth
market
National or Exclusive Brand Choice
Broad Portfolio of SKUs Covering More Customer Needs
for Almost Every Customer Need
# of core SKUs (December 2017)
proposition
Winning
95% 76%
1.500
c.700
Operational
excellence
Şok Discount Competitor 1
% of customer needs covered(1)
performance
Fresh, Personal Care, Non-Food and Tobacco Differentiate and Drive Traffic
Superior
% of FY2017A Şok Store sales(2)
70% Grocery
13% Tobacco
Future growth
7% Non-food spot items
6% Fruit & Vegetables (Fresh)
3% Personal care
1% Other(3)
Fresh Personal Care Tobacco
Source: Management information.
(1) Based on management estimates and defined as a product meeting basic needs of the customer, used everyday. 12
(2) As of FY2017 sales based on Şok store sales.
(3) Includes mobile phone airtime.Unrivalled Choice of National Brands Exclusive
& Branded
and Heritage Exclusive Brands Products
High growth
market
National Brands Exclusive Brands
%
46% (vs. 28% for Discount Competitor 1(1)) 27%
sales
proposition
Winning
#
240 46
brands
#
884 (vs. 194 for Discount Competitor 1(2)) 466
Operational
SKUs(2)
excellence
Food Beverage Heritage Brands Other Brands
performance
Since 1970s Since 1980s
Superior
Examples
Personal care Home Care Since 1920s Since 1970s
Future growth
Since 1970s
#1 selling brand for almost every category We price our well-known heritage brands at
available same level as competitors’ own brands
Source: Management information, Discount Competitor 1 reporting. 13
(1) 2017A, including Branded (22%) and Exclusive (6%) products.
(2) Latest available, 2016A, including Branded (22%) and Exclusive (5%) products.Shopping
Easy Shopping Experience experience
High growth
market
proposition
55 modules Mid-high section
Winning
Operational
excellence
On-Shelf
Fresher
Availability
performance
Superior
Future growth
Visibility &
Eye-catching
Natural light
Differentiated consumer offering reflected in excellent Mystery Shopper score of 87(1)
Source: Management information. 14
(1) As of December 2017. Source: Mia Organizasyon Restorasyon Yayıncılık (Günışığı Kitaplığı); Score range: 0-49 (Inadequate), 50-60 (Medium), 70-84 (Good), 85-100 (Excellent).Conclusion: Şok’s Offering is Ahead of
Competitors
High growth
market
proposition
Winning
Experts in convenient
Proximity small-box format
Operational
excellence
Competitive everyday low prices
Price and effective promotions
Most relevant product choice,
performance
differentiated by strong fresh,
Choice tobacco and personal care
Superior
offering
Unrivalled choice of national
Brands brands and heritage exclusive
Future growth
brands
Carefully engineered, enjoyable
Experience atmosphere, easy shopping
experience
Source: Management Information.
15Operational Excellence from End-to-End
High growth
market
Efficient
Logistics
proposition
Management
Winning
Carefully
Engineered
In-Store Disciplined Store
Operational
Execution Roll-out Process
excellence
performance
Our
Superior
People
Highly Effective
Communication
Future growth
Integrated IT Collaborative
Infrastructure and
Accountable
Procurement
16Track Record of Successful Roll-out
High growth
market
Şok Net Stores Opened(1)
Low average TL 208k per new store
If closed, c.80% of capex is recoverable and can
proposition
1,144 2,043(2) 2,301 3,000 4,000 5,100
be transferred to another store(3)
Winning
1.100
1.000
Operational
excellence
10-year lease all in TL
699 (1 month notice period to cancel lease)
performance
Superior
258
199 Underperforming stores reported on
daily/weekly basis and supported with
9 weekly promotions
Future growth
2012A 2013A 2014A 2015A 2016A 2017A
Total Number of Stores
c.2% of new stores closed in the last 2 years
CEO has visited 1,069 stores in 56 different with limited sunk cost of only TL 40k upon
cities, travelling 64,880 km during 2016 & 2017 closure
Source: Management information.
(1) Net new store openings, excluding acquisition of UCZ stores. 17
(2) Including stores acquired from DIA (584) & Onurex (116).
(3) As of 2017A, excluding UCZ stores.Improving Customer Perception and Top
of Mind Awareness
High growth
market
Highest Net Promoter Score(1) Top of Mind Awareness(2)
%
proposition
Winning
47
43
41
37 38
50
33
46 31
Operational
29
excellence
Start of Şok TV campaign
26
18 17 18 19 22
16
12 13 13 16
12 16 17
24 8 9 8 12
performance
7 13 12
5 11 11
4
Superior
4 6 6
YE12 YE13 YE14 YE15 YE16 Q1'17 Q2'17 Q3'17 Q4'17
Şok Discount Competitor 1
Future growth
DiscountCompetitor
Discount Competitor11 Discount Competitor 2 Discount Competitor 2 Supermarket Competitor 1
Achieved #1 position from survey participants across Şok rapidly catching up to the
socio-economic groups A, B, C2, D+E leading key competitor
Source: Management information, GfK 2017, Consumer survey conducted by Twentify in March 2018.
(1) Source: Consumer survey conducted by Twentify in March 2018. 18
(2) Unaided awareness. Source: GfK 2017.Strong Track Record of Revenue
Growth
High growth
market
Revenue Bridge(1)
Fastest growing Turkish
TLm grocery retailer
proposition
Winning
1.806 16 8.713
801
1.242 (42) 6.090 Refurbished stores,
4.462 428
SKU count,
Operational
convenience driving traffic
excellence
2015A LFL Revenue Non-LFL Other (2) 2016A LFL Non-LFL Other (2) 2017A
Revenue Revenue Revenue
Total
Basket driven by availability
performance
3,000 4,000 5,100
Stores
of fresh produce and effective
Superior
LFL Number of Tickets Growth(3) LFL Basket Size Growth(3) Like-for-Like Growth(3)(4) promotions
YoY, growth YoY, growth YoY, growth
Future growth
Average: 3.6% Average: 8.7% Average: 12.6%
Average Internal Inflation = 7.4%
15,7%
11,7
10,7 10,4
%
c.1,000 stores added every
%
9,2% % year in the past 3 years
6,1%
4,0% 4,6%
2,3% 1,782 2,129 2,900
2015A 2016A 2017A 2015A 2016A 2017A 2015A 2016A 2017A
Number of LFL stores
Source: Management Information. (3) Data provided for LFL stores only. 19
(1) Financials presented for Şok, excluding impact of UCZ and Non-Şok operations of Teközel. (4) Like-for-like sales for FY2017 calculated on the basis of daily net sales generated in 2017 by stores
(2) Includes Şok closed stores, warehouse sales and third-party sales of Mevsim. operating on 31 Dec 2015 and that were still open on 31 Dec 2017.Daily Sales Ramp-up Analysis
High growth
market
Further upside potential 6.301
5.345
proposition
Potential growth
4.779
from maturing 488
Winning
4.221
stores 3.813
409
368
323
285
Operational
excellence
22.7% 16.5% 13.4%
Stores opened in 2017 Stores opened in 2016 Stores opened in 2015 Stores opened in 2014 Stores opened in 2013
and before
(1) (1)
2017A Daily Avg. Sales per Store (TL) 2017A Daily Avg. # of Tickets per Store 2017 LFL Growth (2)
performance
Superior
Total Number
of Stores 1,198 1,002 771 347 1,782
New stores LFL stores
Future growth
Drive LFL with fresh, Gain customer loyalty
Increase brand
Key Actions personal care, bakery through continued
awareness
and other initiatives operational excellence
Source: Management Information.
(1) Financials presented for Şok, excluding impact of UCZ and Non-Şok operations of Teközel. As of Dec-17. In 2017, store operating days of 201 on average for stores opened in 2017 and 359 on average 20
for stores opened in 2016.
(2) Like-for-like sales for FY2017 calculated on the basis of daily net sales generated in 2017 by stores operating on 31 Dec 2015 and that were still open on 31 Dec 2017.Efficiency and Scale Underpinning
Margin Improvement
High growth
market
Evolution of Gross Margin(1) Evolution of Operating Expenses / Sales(1)(2)
proposition
8.713 1.648
Winning
6.090 1.191
22,7%
4.462 909
Operational
excellence
21,4%
20,4%
20,3% 19,6%
18,9%
2015A 2016A 2017A 2015A 2016A 2017A
performance
Revenue Gross Margin Opex Opex as % of Sales
Superior
Improvement in gross margins driven by Centralised executive management
economies of scale for SG&A cost management
Future growth
Use of exclusive brands creating additional Cost-centric approach
bargaining power to personnel, transportation and rent
c.150 bps Improvement in Operating
c.240 bps Improvement in Gross Margin(1)
Expenses / Sales(1)(2)
Source: Management Information. 21
(1) Financials presented for Şok, excluding impact of UCZ and Non-Şok operations of Teközel.
(2) Excluding depreciation and amortisation.EBITDA Margin Driven by Scale and
Rationalisation of SG&A
High growth
market
Evolution of Adj. EBITDA(1) Ramp-up of Şok Store Adj. EBITDA Margin(2)
(TL in millions) # of Şok 2017 LFL
341 Vintage stores 2015A 2016A 2017A Growth(3)
proposition
Winning
3,9% 2013
and 1,782 1.5% 3.5% 5.5% 13.4%
before
Operational
excellence
1,9%
2014 347 (1.2%) 2.4% 4.9% 16.5%
117
2015 771 (5.4%) (0.2%) 3.3% 22.7%
performance
(0,0%) 2016 1,002 (1.9%) 1.7%
Superior
(1)
2017 1,198 0.1%
2015A 2016A 2017A
Future growth
Total 5,100 (0.1%) 1.8% 3.8% 15.7%
Revenue Gross Margin
Ramping-up vintages with
From Breakeven in 2015, c.400 bps Improvement driven by procurement
significant “embedded” margin
Improvement in Adj. EBITDA(1) scale and operational discipline
upside
Source: Management Information.
(1) Financials presented for Şok, excluding impact of UCZ and Non-Şok operations of Teközel. Adjusted EBITDA defined as operating profit / loss plus depreciation & amortisation, before other income /
(expense), past royalty payments on brands acquired and results of Non-Şok operations of Teközel.
(2) Financials presented for Şok stores only. Adjusted EBITDA defined as operating profit / loss plus depreciation & amortisation, before other income / (expense), past royalty payments on brands 22
acquired and results of Non-Şok operations of Teközel.
(3) Like-for-like sales for FY2017 calculated on the basis of daily net sales generated in 2017 by stores operating on 31 Dec 2015 and that were still open on 31 Dec 2017.Asset-light Model Driving Excellent Cash
Conversion
High growth
Capex(1) Free Cash Flow(5)(6)
market
(TL in millions) (TL in millions)
# net new Cash
additions Conversion (44) (60) (66)
proposition
699 1,000 1,100
Cycle(7)(8)
Winning
# stores
199
refurbished
24 1,648 1,075
Operational
excellence
432 7
356 6 10
18 15 21
113
6 10
131
performance
178
5
Superior
14 271
143 187
2015A 2016A 2017A
(125)
Future growth
(2) 2015A 2016A 2017A
New stores Store Transformation New warehouses (2)
(3)
Maintenance Others (4) Warehouse reorganisation
Asset-light model
Significant improvement in cash flow conversion
with limited maintenance capex of TL1.5k per store
Source: Management Information, audited financials. (6) Defined as net cash generated in operating activities minus capex reduced for the carrying value of leased
(1) Defined as additions to tangible assets during the year. equipment which are not yet paid for as of the balance sheet date. Consolidated based on audited financials.
(2) Including spillovers from previous years. (7) NWC days refers to the sum of Receivable days, Payable days and Inventory days. Receivable days defined
(3) Warehouse reorganisation capex conducted for the buyout of warehouse assets from the third party operators as Revenue for the year divided by Trade Receivable as at year-end, Payable days defined as COGS for the
and for a one-off warehouse relocation. year divided by Trade Payables as at year-end, Inventory days defined as COGS for the year divided by
(4) Other includes HQ, Mevsim and Teközel capex and transformation capex of UCZ (2016: TL 2m; 2017: TL 9m). Inventory as at year-end.
23
(5) Based on consolidated financials. (8) Components of calculation include change in Trade Receivables, change in Trade Payables and change in
Inventory for the year.Pro Forma Capitalisation & NOLs
High growth
market
Pro Forma Capitalization Tax Impact of NOLs
Substantial majority of Offering Consolidated net operating losses of TL 2,011m(5) as of
TLm Current
net proceeds to repay December 31, 2017
proposition
substantially all of our current
Net Debt(1) 2,230 financial indebtedness Expiry schedule
Winning
Equity (2,185) 2018: TL 429m
2019: TL 392m
2020: TL 448m
Operational
excellence
Debt Facilities
2021: TL 332m
Weighted Average 2022: TL 410m
TLm Amount Maturity
Interest Cost
performance
Within one Dividend(6)
Bank Debt(2) 1,402 18.5%
year
Superior
Shareholder
611 Current 17.3% We intend to adopt a progressive dividend policy with
loans(3)
flexibility over growth
Financial Leases 204 1-4 years 13-14%
Future growth
Initial target payout ratio of a minimum of 30% of
Within one
Financial Leases 102 13-14% distributable net profit
year
Other Payable with
35 Current 3.4%
Financing Nature(4)
Total 2,355
Source: Management Information, audited financials. (5) Including 208m TL UCZ NOLs (2018: 38 TLm, 2019: 38 TLm, 2020: 27 TLm, 2021: 20 TLm,
(1) Total debt of 2,354.7 TLm less cash of 92.1 TLm and amount due from related parties of 32.1 TLm. 2022: 85 TLm).
(2) May be partially upstreamed to Yıldız Holding level based on the ongoing refinancing negotiations of (6) The exact amount of dividend distribution and the dividend policy will be subject to shareholder
Yıldız Holding and group companies (including Şok) with their lenders. approval. The distribution of dividends is subject to certain conditions, including but not limited
(3) Refers to non-trade payables to related parties. Subject to increase (in proportion to the Şok bank debt to to the existence of distributable earnings, liquidity requirements and indebtedness levels. 24
be upstreamed to Yıldız Holding) based on the Yıldız Holding refinancing agreement.
(4) Refers to loans of UCZ due to former shareholder.Key Drivers of Growth
High growth
market
A B
proposition
Attractive
Robust LFL
Winning
white space
growth
opportunity
Operational
excellence
performance
Superior
C D
Future growth
Significant
margin Şok Mini
expansion
Source: Management Information.
25A White Space Opportunity for Şok
High growth
market
Store Potential for Discount 34k store potential based on
Şok New Store Potential (Stores)(2)
Channel(1)
regional bottom-up analysis
of geographies and saturation
proposition
Winning
Şok potential for additional
10.900
Operational
5.800 5.8k stores by 2023, supported by
excellence
independent commercial consultant
16k
performance
5.100 Şok projected to gain c.1.3% market
Superior
34k
share per year in line with last 3 years
18k
(2)
Future growth
1.216
Şok market shares projected to
2017 Additional Total 2012 2017 New Store 2023P improve from 19% in 2017 to 27% in
White Space Potential Potential
(mid-term) 2023
Source: MK Novo Analysis.
Note: Forward stores figures rounded.
(1) Market potential for number of stores is not a time bound calculation. This approach, sourced from MK Novo analysis, is used for estimating the full potential that the market can reach by region based
on various benchmarks.
26
(2) As per MK Novo.A
Significant Growth Opportunities Even
in Penetrated Cities
High growth
market
Istanbul Bursa, Eskişehir, Bilecik Trabzon, Ordu, Giresun,
Turkey
Rize, Artvin, Gümüşhane
Total Potential 5,970 Total Potential 1,914
Total Potential 1,284 Total Potential 34,063
Competitor Stores 2,526 Competitor Stores 648
proposition
Competitor Stores 445 Competitor Stores 12,878
Şok Stores Şok Stores
Winning
1,105 275
Şok Stores 160 Şok Stores 5,100
2018 Plan 184 2018 Plan 83
2018 Plan 31 2018 Plan 1,100
İzmir
Operational
excellence
Total Potential 1,870
Competitor Stores 801
Van, Muş, Bitlis, Hakkari
Şok Stores 411
performance
2018 Plan 63 Total Potential 798
Superior
Competitor Stores 170
Şok Stores 13
Ankara 2018 Plan 35
Antalya, Isparta, Burdur
Future growth
Total Potential 3,041
Total Potential 1,360
Competitor Stores 974
Current Discount stores / Discounter Potential ratio by Turkish cities
Competitor Stores 620
Şok Stores 302 0 0.25 0.50 0.75 1.00
Şok Stores 376
2018 Plan 83
2018 Plan 54 Unpenetrated Market Penetrated Market
Source: Management Information (2018 Plan and Şok Stores), MK Novo Analysis (Total Potential and Total Stores). Competitor stores calculated as Total Stores less Şok Stores.
Note: Market potential for number of stores is not a time bound calculation. This approach, sourced from MK Novo analysis, is used for estimating the full potential that the market can reach by region based on
27
various benchmarks.B
LFL to be Driven by Multiple Factors as
Stores Mature
High growth
market
Ramp-up from Young Store Portfolio Fresh has positive
multiplier effect on average
Number of stores
basket size and footfall
proposition
Winning
>3 yearsC Significant Margin Expansion Potential
High growth
market
Ramp-up of Şok Store Adj. EBITDA Margin(1)(2)
Ramping-up vintages with
# of Şok 2017 LFL
significant “embedded” margin
proposition
Vintage stores 2015A 2016A 2017A Growth(3)
upside
Winning
2013 and
1,782 1.5% 3.5% 5.5% 13.4%
before
Operational
excellence
2014 347 (1.2%) 2.4% 4.9% 16.5%
Newer stores achieve break even
faster due to enhanced Şok brand
2015 771 (5.4%) (0.2%) 3.3% 22.7% equity from marketing campaigns
performance
2016 1,002 (1.9%) 1.7%
Superior
2017 1,198 0.1%
Future growth
Economies of scale through
Total 5,100 (0.1%) 1.8% 3.8% 15.7% operating leverage
Source: Management information.
(1) Financials presented for Şok stores only.
(2) Adjusted EBITDA defined as operating profit / loss plus depreciation & amortisation, before other income / (expense), past royalty payments on brands acquired and results of Non-Şok operations of Teközel.
(3) Like-for-like sales for FY2017 calculated on the basis of daily net sales generated in 2017 by stores operating on 31 Dec 2015 and that were still open on 31 Dec 2017.
29D Şok Mini
High growth
market
Acquired UCZ Mağazacılık A.Ş in Dec-17
with c.500 stores
proposition
Winning
Turnover of TL 292m in 2017A
Operational
excellence
Average store size: 82sqm(1) with 1,382 SKUs(1)
Increased
performance
penetration in
Superior
Istanbul
Conversion capex per store of TL 100k(2)
Future growth
48 stores converted to Şok Mini as of Q1 2018, with full For the converted stores, revenue growth 2x higher
conversion plan within in FY2018 in Jan-18 vs. Jan-17
Source: Management Information.
(1) As of Dec-17. 30
(2) Estimated amount.Research Guidelines
Most Attractive Grocery Market
in Europe
Winning Proposition with
a Differentiated Format
Excellent Operational Execution
Superior Growth and Cash Flow
Generation
Significant Profitable Growth
Opportunity
Confidential
Source: Management Information.
31Research Guidelines
Financials
Confidential
32Consolidated Financials Build Up - 2017
To be gradually
discontinued
during 2018
Total excl.
Non-Şok
Inter-Company Non-Şok
TLm (2017) Şok UCZ Operations of Consolidated
Eliminations Operations of
Teközel
Teközel
Revenue 8,713 292 (112) 8,893 620 9,512
Gross Profit 1,981 45 2,026 7 2,034
Gross Margin (%) 22.7% 15.4% 22.8% 1.1% 21.4%
Opex (including D&A) (1,807) (66) (1,873) (3) (1,877)
Opex as % of Sales 20.7% 22.6% 21.1% 0.5% 19.7%
(1)
D&A 159 6 165 165
Adjustments 8 8 (4) 4
Adj. EBITDA 341 (15) 326 (0) 326
Adj. EBITDA Margin (%) 3.9% (5.1%) 3.7% 3.4%
Rent 400 11 411 411
Adj. EBITDAR 741 (4) 737 (0) 737
Adj. EBITDAR Margin (%) 8.5% (1.4%) 8.3% 7.7%
Capex 422 9 432 432
(3)
NWC (1,257) (33) (1,290) (1,290)
Source: Management Information, audited financials.
(1) Defined as operating profit / loss plus depreciation & amortisation, before other income / (expense), past royalty payments on brands acquired and results of Non-Şok operations of Teközel. 33
(2) Defined as operating profit / loss plus depreciation & amortisation, before rent, other income / (expense), past royalty payments on brands acquired and results of Non-Şok operations of Teközel.
(3) Refers to the sum of Trade Receivables and Inventory minus Trade Payables for the year.Consolidated Summary Profit and Loss
TLm 2015 2016 2017 CAGR / Expansion
Year End Şok Stores 3,000 4,000 5,100 30.4%
Growth (%) 30.4% 33.3% 27.5%
Revenue 5,072 6,726 9,512 36.9%
Growth (%) 32.6% 41.4%
Gross Profit 911 1,325 2,034 49.4%
Gross Margin (%) 18.0% 19.7% 21.4% ∆ +342 bps
Operating Expenses(1) (1,003) (1,327) (1,877) 36.8%
Other Income / Expenses (Net) from
(5) (11) (34)
Operating Activities
Operating Profit (97) (13) 123
Operating Profit Margin (%) (1.9%) (0.2%) 1.3% ∆ +321bps
Financial Income / Expenses (Net) (256) (357) (552)
Loss before Taxation (353) (370) (429)
Tax (19) (4) (5)
Loss for the period (373) (375) (434)
TLm 2015 2016 2017 CAGR / Expansion
(2)
Adj. EBITDAR 222 402 737 82.0%
Adj. EBITDAR Margin (%) 4.4% 6.0% 7.7% ∆ +336 bps
(3)
Adj. EBITDA (1) 110 326 NA
Adj. EBITDA Margin (%) (0.01%) 1.6% 3.4% ∆ +344 bps
Source: Audited financials.
(1) Includes sales and marketing and general and administrative expenses.
(2) Defined as operating profit / loss plus depreciation & amortisation, before rent, other income / (expense), past royalty payments on brands acquired and results of non-Şok operations of Teközel. 34
(3) Defined as operating profit / loss plus depreciation & amortisation, before other income / (expense), past royalty payments on brands acquired and results of non-Şok operations of Teközel.Consolidated Summary Balance Sheet
TLm 2015 2016 2017
Cash and cash equivalents 33 61 92
Trade receivables 286 337 267
Other current receivables 20 22 37
- of which, due from related parties 17 19 32
Inventories 418 503 636
Prepaid expenses 4 9 8
Other current assets 2 10 35
Other non-current receivables 3 4 6
Property and equipment 344 608 850
Intangible assets 673 672 677
Other non-current assets 0 0 0
TOTAL ASSETS 1,784 2,226 2,608
Short term borrowings 874 1,100 1,402
Short term portion of long term borrowings 250 0 0
Obligations under finance leases 34 57 102
Trade payables 1,154 1,665 2,193
Other current payables 148 601 646
Payables regarding employee benefits 23 49 79
Deferred income 2 3 9
Other short term provisions 30 37 43
Other current liabilities 8 16 18
Obligations under finance leases 81 154 204
Provision for long term employee benefits 20 30 40
Deferred tax liabilities 44 46 47
Deferred income 0 0 10
Other non-current payables 1 1 1
TOTAL LIABILITIES 2,668 3,757 4,794
Shareholder's equity (884) (1,412) (2,023)
Non-controlling interests 0 (119) (162)
Total Equity (884) (1,531) (2,185)
TOTAL LIABILITIES AND EQUITY 1,784 2,226 2,608
35
Source: Audited financials, Management Information.Free Cash Flow of Şok
IFRS – TLm 2015 2016 2017
(1)
Adj. EBITDA (1) 110 326
Less: Due date income from credit purchases (144) (207) (274)
Due date expense from credit sales 49 87 91
Changes in NWC 130 365 469
Other operating cash inflow 19 21 19
Less: Capex(2) (178) (356) (432)
Free Cash Flow (125) 21 199
Source: Management Information, Audited financials. 36
(1) Defined as operating profit / loss plus depreciation & amortisation, before other income / (expense), past royalty payments on brands acquired and results of Non-Şok operations of Teközel.
(2) Capex reduced for the carrying value of leased equipment which are not yet paid for as of the balance sheet date.Research Guidelines
Appendix
Confidential
37Senior Management
25 28
years of years of
experience experience
Retail Days 2016 - Most
Successful Retail CEO of 2016
38Shareholder Structure before IPO
Turkish Retail Gözde: Turkish Holdings IV Templeton:
Investments B.V.(1): Publicly held Cooperatief UA: Global asset
Investment Fund private equity company Investment Fund management firm
Gözde Girişim Templeton Strategic
Turkish Retail Turkish Holdings IV
Sermayesi Yatırım Emerging Markets Individuals(2)
Investments B.V. Cooperatief UA
Ortaklığı Fund IV., LDC
40% 39% 10% 10% 1%
Şok Marketler A.Ş
Source: Management information.
Note: Shareholding structure as of 16 April 2018. Prior to the Offering, Murat Ülker and certain members of his family, through their indirect majority ownership stakes in Turkish Retail Investments
B.V. and Gözde, have effective beneficial ownership over 70.9% of shares. 39
(1) Yıldız Holding controls 100% of Turkish Retail Investments B.V.
(2) Includes Uğur Demirel (0.40%), Mustafa Y. Serdengeçti (0.07%), Hüseyin Avni Metinkale (0.20%), Yasemin Tokuş (0.25%) and Yahya Ülker (0.08%).Shareholder Structure after IPO
Turkish Retail Gözde: Turkish Holdings IV Templeton:
Investments B.V.(1): Publicly held Cooperatief UA: Global asset
Investment Fund private equity company Investment Fund management firm
Templeton
Turkish Retail Gözde Girişim
Turkish Holdings Strategic Emerging
Investments Sermayesi Yatırım Yıldız Holding) Listed Other
IV Cooperatief UA Markets Fund IV.,
B.V. Ortaklığı
LDC
23,5% 22,9% 5,9% 5,9% 5,5% 35,7% 0,6%
Şok Marketler A.Ş
40Disclaimer This presentation contains information and analysis on financial statements and is prepared for the sole purpose of providing information relating to Şok Marketler Ticaret A.Ş. (Şok Marketler) This presentation contains forward-looking statements which are based on certain expectations and assumptions at the time of publication of this presentation and are subject to risks and uncertainties that could cause actual results to differ materially from those expressed in these materials. Many of these risks and uncertainties relate to factors that are beyond Şok Marketler’s ability to control or estimate precisely, such as future market and economic conditions, the behavior of other market participants, the ability to successfully integrate acquired businesses and achieve anticipated cost savings and productivity gains as well as the actions of government regulators Readers are cautioned not to place undue reliance on these forward-looking statements, which apply only as of the date of this presentation. Şok Marketler does not undertake any obligation to publicly release any revisions to these forward-looking statements to reflect events or circumstances after the date of these materials This presentation merely serves the purpose of providing information. It neither represents an offer for sale nor for subscription of securities in any country, including Turkey. This presentation does not include an official offer of shares; an offering circular will not be published This presentation is not allowed to be reproduced, distributed or published without permission or agreement of Şok Marketler The figures in this presentation are rounded to provide a better overview. The calculation of deviations is based on figures including fractions. Therefore rounding differences may occur Neither Şok Marketler nor any of its managers or employees nor any other person shall have any liability whatsoever for any loss arising from the use of this presentation
You can also read