Residential Developer Market Intelligence

Page created by Jessie Perry
 
CONTINUE READING
Residential Developer Market Intelligence
Residential Developer
 Market Intelligence

               MAJOR RESEARCH PARTNER

Q2 –2019
Residential Developer Market Intelligence
Welcome to the Q2-2019 edition of the UDIA NSW Residential Developer Market Intelligence (RDMI)
report. The quarterly RDMI aims to provide a targeted residential market performance update across
the Greater Sydney, Lower Hunter, Central Coast, Illawarra and ACT housing markets.

This publication is prepared with the understanding that residential property market dynamics are
complex and nuanced, and thus quality, timely market intelligence is essential for market participants
supplying new products.

The publication draws upon a range of information sources including exclusive and bespoke data
provided by CoreLogic - our key research partner. A key feature of the RDMI report is the inclusion of
‘bottom-up’ insights provided by our leading developer members on the state-of-play in their regional
market of operational focus.

The RDMI reporting output and content inclusions continues to evolve, and in this edition we include
residential construction sector revenues and employment metrics (from Ibis World), in addition to
new greenfield lots sales and completions intelligence. These two new data points provide another
lens on the continuation of the challenging market conditions facing the development sector, as the
property downturn continues to unfold across the State.

UDIA NSW expects the subdued demand profile for new residential products to persist for at least
the next six months and most likely into the 2021 financial year. Underpinned by a ‘credit crunch’ for
both retail consumers and developers in the wake of the Banking Royal Commission, we expect the
soft market conditions to continue to put downward pressure on pricing and sales volumes over the
coming period.

I trust the data and insights in this RDMI are of value for you and your organisation, and would
welcome any feedback or thoughts about the publication emailed to tadams@udiansw.com.au

                   Toby Adams

                   General Manager – Strategy & Research

                   UDIA NSW

                                                                        Cover Image: Oblique Aerial over Parramatta

         Research Partners                              Gold Sponsors                               Silver Sponsors
Residential Developer Market Intelligence
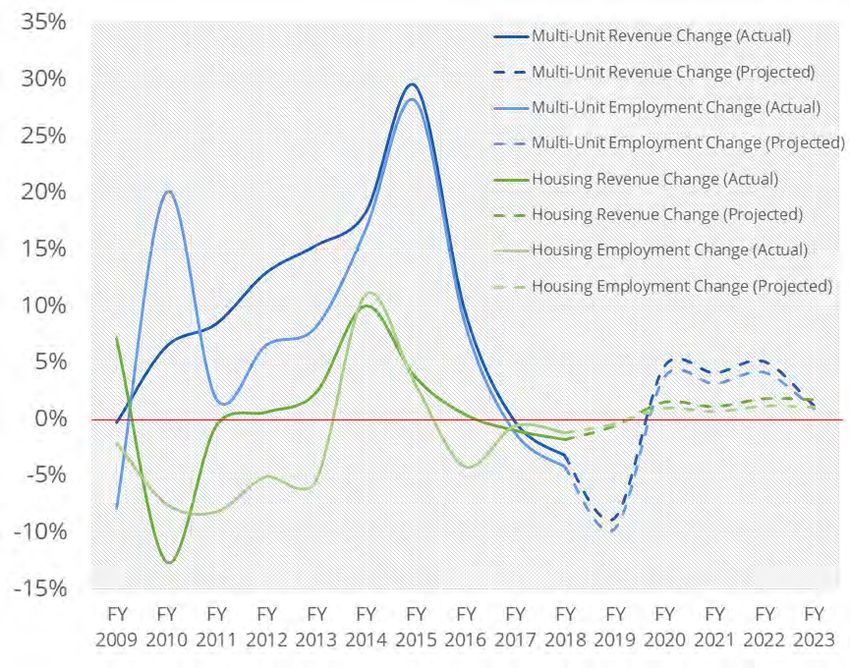
Market Performance Headline Metrics

               Median House        Volume of House     Median Unit Sale     Volume of Unit        Change in Approvals
            Sale Price (settled)     Sales (settled)     Price (settled)     Sales (settled)    (12 months to May 2018
             (3-month change       (3-month change     (3-month change     (3-month change      vs 12 months May 2019)
               to April 2019)        to April 2019)      to April 2019)      to April 2019)
Greater
Sydney           -3.2%                  -5.8%               -1.4%               -7.2%                  -26%
                                                                                               (12 months to June 2018 vs 12
                                                                                                   months to June 2019)

Central
                 -1.7%                  -7.9%               -1.0%               -6.6%                   21%
Coast

Lower
                  -0.4%                 -5.9%               -0.6%               -9.1%                   14%
Hunter

Illawarra         -2.8%                 -5.2%               -1.1%               -2.8%                     4%

ACT                3.2%                 -3.4%               -1.4%               -4.2%                    35%
Residential Developer Market Intelligence
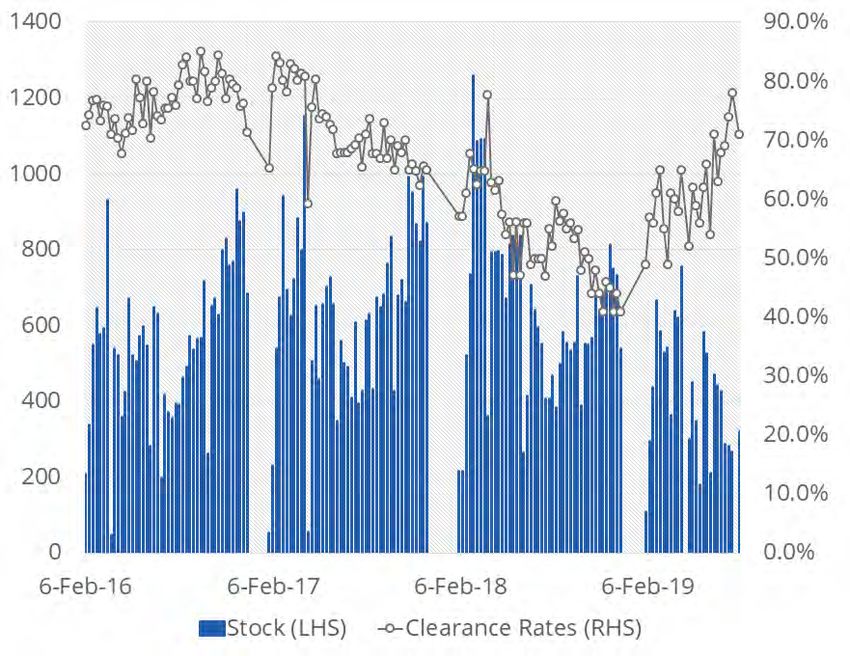
Economic                           Cash Rate and Average Lending Rates

                                 Snapshot
•   The latest ABS statistics to December 2018 show a
    16% drop in the natural population increase from the
    previous quarter. The strong population growth overall
    in NSW remains bolstered primarily by net overseas
    migration. In Q4-2018, NSW experienced a net increase of
    22,440 people which was 28% of the total net Australian
    population increase for the quarter.
•   In May 2019, NSW’s unemployment rate was 4.4% which
    while growing marginally since the start of the year is still
    significantly lower than the twenty year average (5.3%) and
    the current national average (5.2%).
•   The official cash rate now remains at 1.0% following
    recent moves by the RBA to attempt to revive home
    buyer activity. This has flowed to a slight improvement in
    consumer sentiment with both major indices recording
    modest indexation increases.                                     Source: RBA

                                                                    Consumer Price Index (CPI)
Population Growth (NSW)

Source: ABS
                                                                    Source: ABS

NSW Employment/Unemployment                                         Consumer Sentiment
(Seasonally Adjusted)

Source: ABS
                                                                    Source: Roy Morgan
Residential Developer Market Intelligence
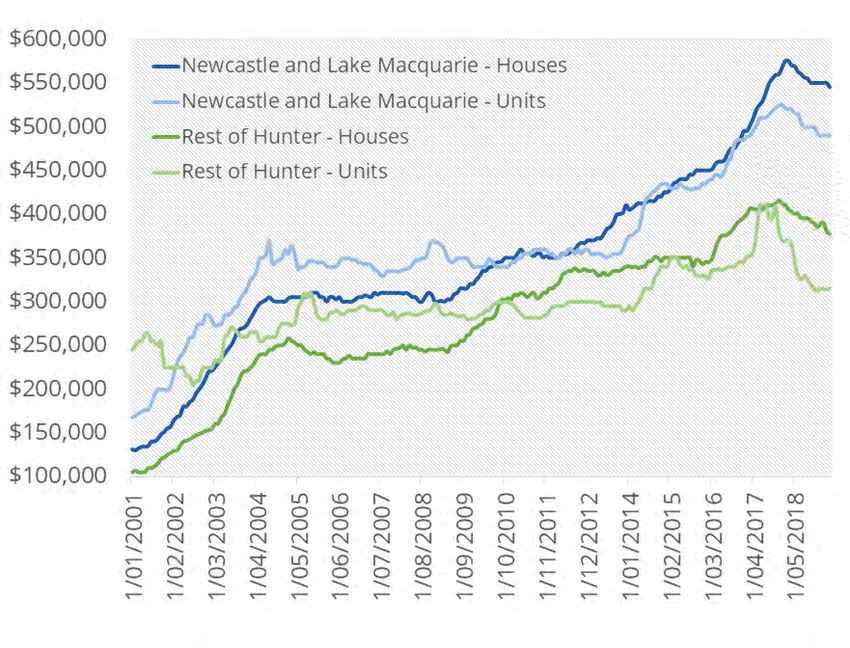
National                                                                                                                                          Construction Industry Revenue and Employment

    Housing Snapshot
                                                                                                                                                      (National)

•    The total volume of residential dwelling approvals continues
     to decline in most capital cities. In the year to June 2019, the
     Sydney and Melbourne approval pipelines both contracted by
     25% and Brisbane’s by 27%.
•    First home buyers accounted for 19% of national house sales
     in May 2019, which is a seven year high and considerably
     higher than the 13% share in Feb 2017.
•    The national residential construction sector has experienced
     a marked contraction of revenues and employment over the
     past two financial years. Multi-unit construction employment
     is forecast to have contracted by circa 10% for FY19, while
     house construction employment by 2%.
•    The median sale price for new houses in Sydney in March
     2019 was $910k, which was 10% higher than Melbourne
     ($826k) and 66% higher than Brisbane ($547k).

                                                                                                                                                                  02

                                                                                                                                                                            04

                                                                                                                                                                                              06

                                                                                                                                                                                                              08

                                                                                                                                                                                                                                10

                                                                                                                                                                                                                                              12

                                                                                                                                                                                                                                                               14

                                                                                                                                                                                                                                                                               16

                                                                                                                                                                                                                                                                                                  18
                                                                                                                                                                20

                                                                                                                                                                          20

                                                                                                                                                                                            20

                                                                                                                                                                                                            20

                                                                                                                                                                                                                              20

                                                                                                                                                                                                                                            20

                                                                                                                                                                                                                                                             20

                                                                                                                                                                                                                                                                             20

                                                                                                                                                                                                                                                                                                20
•    The median sale price for new units in Sydney was $725k
     which was 27% higher than Melbourne ($570k) and 67%
     higher than Brisbane ($432k).

    First Home Buyers Australia, Proportion                                                                                                           Source: IBISWorld

                                                                                                                                                    Total Approvals 12 Months to Jun 2018
                                                                                                                                                    vs 12 Months to Jun 2019
                                                                                                                                                             70,000
                                                                                                                                                                                                                                                                   Detached
                                                                                                                                                             60,000                                                                                                Multi-unit

                                                                                                                                                             50,000

                                                                                                                                                             40,000
                                                                                                                                                Dwellings

                                                                                                                                                             30,000

                                                                                                                                                             20,000

                                                                                                                                                             10,000

                                                                                                                                                                 0
                                                                                                                                                                       Jun-18

                                                                                                                                                                                 Jun-19

                                                                                                                                                                                             Jun-18

                                                                                                                                                                                                       Jun-19

                                                                                                                                                                                                                 Jun-18

                                                                                                                                                                                                                              Jun-19

                                                                                                                                                                                                                                       Jun-18

                                                                                                                                                                                                                                                 Jun-19

                                                                                                                                                                                                                                                             Jun-18

                                                                                                                                                                                                                                                                       Jun-19

                                                                                                                                                                                                                                                                                     Jun-18

                                                                                                                                                                                                                                                                                                Jun-19
                                                                                                                                                                        Sydney MelbourneBrisbane Adelaide                                                      Perth                     ACT
                                                                                                                                                    Source: ABS
    Source: ABS
                                                                                                                                                      Median Unit Price (New): Capital Cities
    Median House Price (New): Capital Cities
                                                                                                                                                            $800,000
    $1,000,000                                                                                                                                                                           Greater Sydney
                                                                                                                                                                                         Greater Melbourne
                              Greater Sydney                                                                                                                $700,000                     Greater Brisbane
      $900,000
                              Greater Melbourne                                                                                                                                          Greater Adelaide
                              Greater Brisbane                                                                                                                                           Greater Perth
      $800,000                                                                                                                                              $600,000
                              Greater Adelaide                                                                                                                                           ACT
                              Greater Perth
      $700,000                ACT                                                                                                                           $500,000

      $600,000
                                                                                                                                                            $400,000

      $500,000
                                                                                                                                                            $300,000
      $400,000
                                                                                                                                                            $200,000
      $300,000
                                                                                                                                                                                                   Jul-10

                                                                                                                                                                                                                                                          Jul-15
                                                                                                                                                                                Nov-08

                                                                                                                                                                                                                                       Nov-13

                                                                                                                                                                                                                                                                                                Nov-18
                                                                                                                                                                                                                     Mar-12

                                                                                                                                                                                                                                                                            Mar-17
                                                                                                                                                                       Jan-08

                                                                                                                                                                                          Sep-09

                                                                                                                                                                                                                              Jan-13

                                                                                                                                                                                                                                                Sep-14

                                                                                                                                                                                                                                                                                       Jan-18
                                                                                                                                                                                                            May-11

                                                                                                                                                                                                                                                                   May-16
                                             Jul-10

                                                                                                   Jul-15
                           Nov-08

                                                                                 Nov-13

                                                                                                                                       Nov-18
                                                               Mar-12

                                                                                                                     Mar-17
                  Jan-08

                                    Sep-09

                                                                        Jan-13

                                                                                          Sep-14

                                                                                                                              Jan-18
                                                      May-11

                                                                                                            May-16

                                                                                                                                                      Source: CoreLogic
    Source: CoreLogic
Residential Developer Market Intelligence
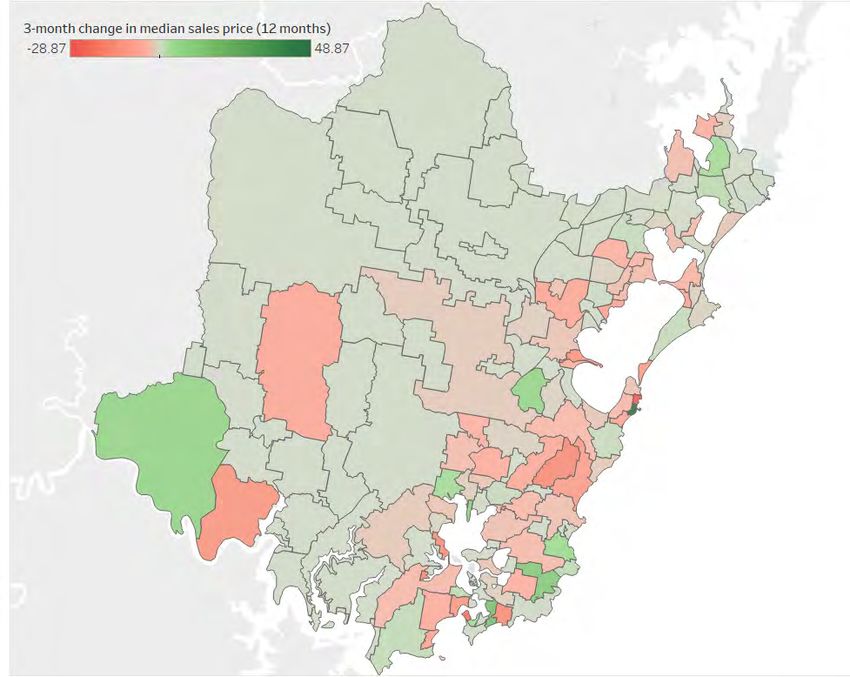
Greater                     Residential Vacancy Rate (Sydney, Monthly)

                                      Sydney
•      Greater Sydney is continuing to feel the effects of the
       current property downturn, with ongoing residential
       pricing declines, soft land and apartment pre-sales and
       a continued retraction in dwelling approvals. This all
       points to a marked reduction in future pipeline delivery
       potential.
•      The median sales pricing for new detached housing
       across Greater Sydney fell 7% over the 12 months to
       April 2019 to $910k, and fell 5% in last three months
       alone.
•      The median sales pricing for new units has thus far
       remained more robust than detached housing falling
       only 1% (based on settled sales transactions) to finish    Source: REINSW
       at $725k as at April 2019. The whole of market median
       pricing for units was $710k supporting a on-going          Total Approvals (Sydney, Monthly)
       trend for new product to command a slight pricing
       premium on second stock.                                      8000
                                                                                                                           Detached                                  Dwellings Excluding Houses
•      Lot sales have taken a serious hit over the last two          7000
       years with a 77% reduction from the Dec 16 net lot
       sales per quarter to the March 19 quarter – where just        6000
       537 sales were recorded across both the North West
                                                                     5000
       and South West Growth Areas.
                                                                     4000
    Change in New House and New Unit Price                           3000
    (Rolling 3 month Average) (Sydney)                               2000

                                                                     1000

                                                                        0
                                                                            Jul-2015

                                                                                                                        Jul-2016

                                                                                                                                                                    Jul-2017

                                                                                                                                                                                                                Jul-2018
                                                                                                  Jan-2016

                                                                                                                                              Jan-2017

                                                                                                                                                                                          Jan-2018

                                                                                                                                                                                                                                      Jan-2019
                                                                                       Oct-2015

                                                                                                                                   Oct-2016

                                                                                                                                                                               Oct-2017

                                                                                                                                                                                                                           Oct-2018
                                                                                                             Apr-2016

                                                                                                                                                         Apr-2017

                                                                                                                                                                                                     Apr-2018

                                                                                                                                                                                                                                                 Apr-2019
                                                                  Source: ABS

                                                                  Approvals by District 12 months to May 2018
                                                                  vs 12 months to May 2019

    Source: CoreLogic

    Weekly Auction Clearance Rates (Sydney)

    Source: CoreLogic                                             Source: ABS
Residential Developer Market Intelligence
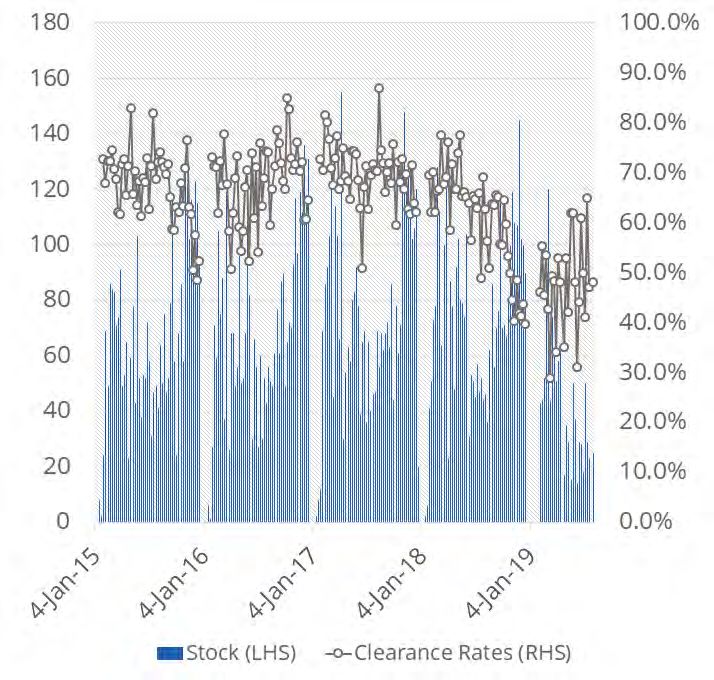
Greater                         Net Lot Sales by Sydney Growth Area, Quarterly
                                           Sydney
Apartment Market Snapshot
                                              Current       Twelve Month
                                                              Change

Total Apartment Completions                   25,136             -
                                           (Year to Date)
                                              43,000           15%
Total Apartment Yield Under Construction
                                            (June 2019)
                                              61,682           -1%
Total Apartment Yields Approved
                                            (June 2019)

Median Sale Price of New Units               $725,000          -3%
                                            (Apr 2019)

Vacancy Rate (Residential)                      3.4%            2.7%
                                            (June 2019)     (June 2018)
                                                                           Source: NSW DPIE
                                               $540            -2%
Median Asking Rent (Residential)
                                            (Apr 2019)                     Growth Area Completions by Suburb (12 Months
                                               4%                -
                                                                           to March 2018 vs 12 Months to March 2019)
Median Rental Yield
                                            (Apr 2019)

Source: CoreLogic

Median Days on Market, Selected LGAs (12 months to Jan 2019)

Source: CoreLogic                                                          Source: NSW DPIE

   Developer Insight
   “At a macro level, the monetary policy stimulus of reduced interest rates and
   the quantitative easing of mortgage serviceability criteria, which added to the
   fiscal benefits of a re-elected federal Liberal government and their commitment
   to a national First Home Buyer’s Scheme from 2020 has had a combined effect
   to revive market confidence. Subsequently, the general slide in market values
   has plateaued since the federal election. We are watching auction clearance
   rates, which have been robust over June and July, and whether they can be
   sustained in a lifting auction volume environment. Where this occurs, we
   could see a stronger and more efficient housing recovery. We do however cite
   caution with the soft conditions present in the wider economy and the limited
   appetite for a credit rebound by regulators over the short-medium term. With
   net migration remaining high, and with affordability now firmly on the agenda,
   it is vital that the NSW Government and the industry enhance their collective
   engagement to ignite policy and delivery. ”

   Cameron Johnson – General Manager, Sun Property
Residential Developer Market Intelligence
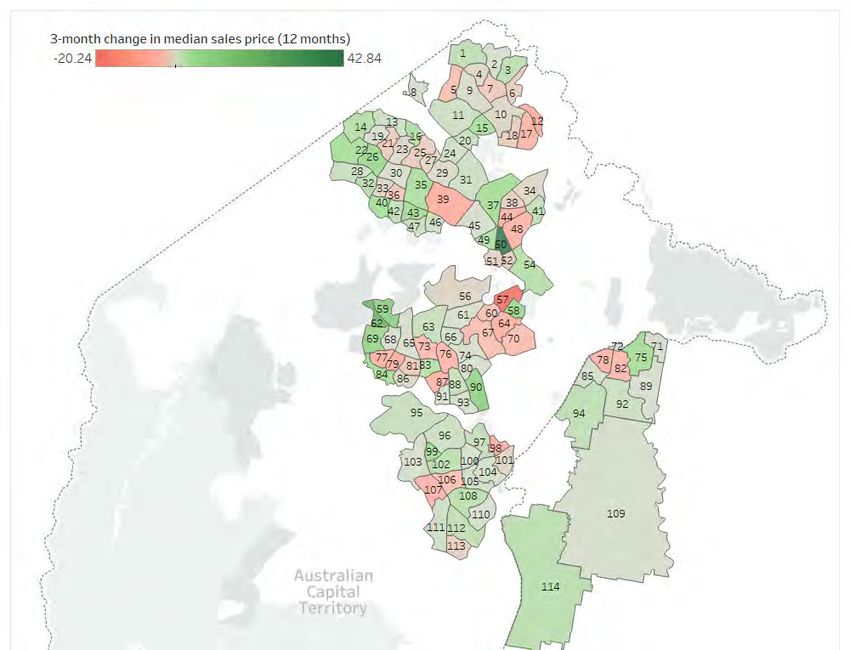
Greater Sydney (Detached)
                                  LGA 3 Month % Change in Median Sales Price
                                  (Whole of Market, as at 30/04/2019)

    %                                                         %

                                                                                                                                1             14
                                                                                                                                         15               1.     Ryde
                                                                                                                                    16         13 12
                                                                                                                                2                         2.     Canada Bay
                                                                                                                                                          3.     Strathfield
                                                                                                                            3 4                     11    4.     Burwood
                                                                                                                                     5        8      10   5.     Inner West
                                                                                                                                                   9      6.     Georges River
                                                                                                                                     7                    7.     Bayside
                                                                                                                            6                             8.     Sydney
                                                                                                                                                          9.     Randwick
                                                                                                                                                          10.    Waverly
                                                                                                                                                          11.    Woolhara
                                                                                                                                                          12.    Mosman
                                                                                                                                                          13.    North Sydney
                                                                                                                                                          14.    Willoughby
                                                                                                                                                          15.    Lane Cove
                                                                                                                                                          16.    Hunters Hill

                                                                                                                     Source: CoreLogic

Spotlight on South District: LGA Market Update

                                                                                             Median days
                                                                   12 month change
                       Median sales price # of listings last 12                             on market for      Median rental yield
                                                                  in total listings (12                                            Average hold period
                        last 12 months           months                                   properties sold in      (12 months)
                                                                        months)
                                                                                           last 12 months

   Canterbury-Bank-             $905,000                  2,822                  -9.4%                    47                 3.4%                         12.5
        stown                   $555,000                  1,800                 -14.1%                    51                 4.0%                          8.7
                               $1,250,000                 1,254                  -2.9%                    47                 2.7%                         11.5
     Georges River
                                $685,500                    937                 -18.5%                    47                 3.8%                          9.6
                               $1,125,000                 2,322                  -0.5%                    45                 3.4%                         11.2
    Sutherland Shire
                                $740,000                  1,666                   1.0%                    47                 3.5%                          8.3

Source: CoreLogic
Residential Developer Market Intelligence
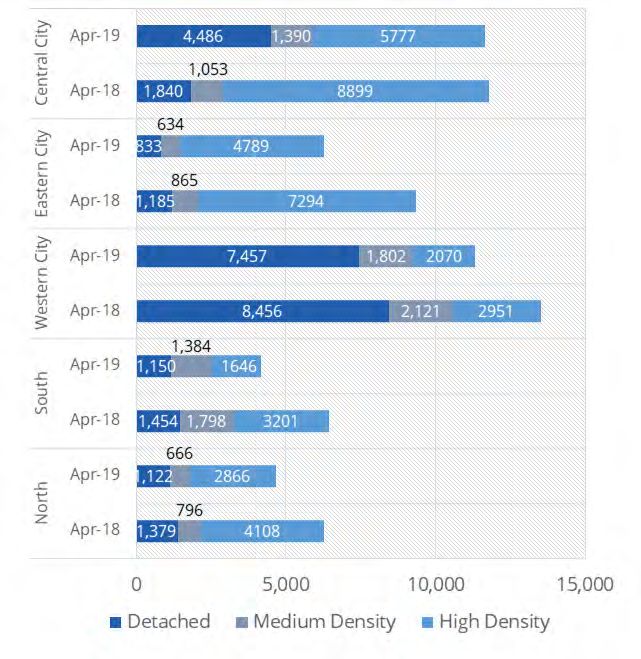
Greater Sydney (Multi Unit)
                                3 Month % Change in Median Sales Price
                                (Whole of Market, as at 30/04/2019)

              %                                          0%                %

                                                                                                                              1             14
                                                                                                                                       15
                                                                                                                                  16         13 12             1.    Ryde
                                                                                                                              2                                2.    Canada Bay
                                                                                                                                                               3.    Strathfield
                                                                                                                        3 4                       11
                                                                                                                                   5        8                  4.    Burwood
                                                                                                                                                   10
                                                                                                                                                               5.    Inner West
                                                                                                                                                 9             6.    Georges River
                                                                                                                                   7                           7.    Bayside
                                                                                                                          6                                    8.    Sydney
                                                                                                                                                               9.    Randwick
                                                                                                                                                               10.   Waverly
                                                                                                                                                               11.   Woolhara
                                                                                                                                                               12.   Mosman
                                                                                                                                                               13.   North Sydney
                                                                                                                                                               14.   Willoughby
                                                                                                                                                               15.   Lane Cove
                                                                                                                                                               16.   Hunters Hill

                                                                                                                 Source: CoreLogic

Spotlight on North District: LGA Market Update
                           Median sales                          12 month change         Median days on
                                           # of listings last                                                Median rental yield                Average hold
                           price last 12                        in total listings (12 market for properties
                                              12 months                                                         (12 months)                        period
                             months                                   months)         sold in last 12 months

                           $1,206,250           1,486                 -6.0%                   46                   3.0%                              14.1
             Hornsby
                            $670,000             678                  -9.1%                   54                   3.9%                              8.9
                           $2,515,000            140                  2.2%                    49                   2.3%                              11.4
           Hunters Hill
                           $1,285,000             68                 -23.1%                   58                   2.2%                              8.5
                           $2,020,000           1,420                 -9.3%                   48                   2.8%                              10.5
           Ku-ring-gai
                            $938,000             800                  4.3%                    55                   3.5%                              7.6
                           $2,175,000            286                  0.7%                    40                   2.3%                              10.5
            Lane Cove
                            $760,000             461                  0.4%                    43                   3.9%                              8.3
                           $3,887,500            259                  -8.3%                   36                   2.2%                              11.6
            Mosman
                           $1,072,500            270                 -25.9%                   38                   3.0%                              9.8
                           $2,398,000            254                 -18.9%                   50                   2.4%                              10.6
          North Sydney
                           $1,052,000           1,165                -12.5%                   37                   3.2%                              10.1
                           $1,700,000           2,570                 -3.8%                   45                   3.0%                              11.2
        Northern Beaches
                            $853,750            2,072                 -5.0%                   40                   3.8%                              8.7
                           $1,501,000            920                  1.8%                    47                   2.4%                              11.1
              Ryde
                            $730,000            1,173                 4.5%                    47                   3.6%                              9.2
                           $2,300,000            602                  0.3%                    50                   2.4%                              10.6
           Willoughby
                            $960,050             563                  -9.6%                   42                   3.4%                              9.5

Source: CoreLogic
Residential Developer Market Intelligence
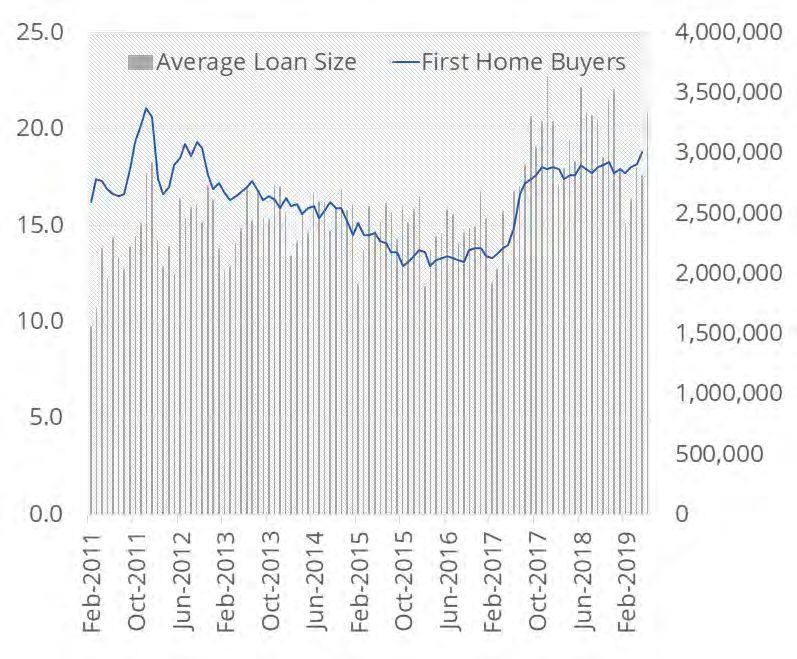
Central                          Approvals (Central Coast, Monthly)

                                              Coast
•      The Central Coast continues to retain a significant
       pricing discount to the Greater Sydney market with
       the April 2019 median price for new houses sitting
       at $648k (40% lower than Sydney) and new units at
       $585k (24% lower than Sydney). While price growth
       has stabilised through the downturn, we are yet to see
       significant value contractions.
•      Approvals in the Central Coast have remained weak                       Source: ABS
       across 12 months to April 2019, recording a 21%
       reduction in the quantum of approvals from the                          Completions (Central Coast, Monthly)
       preceding 12 months.
•      The practical completion of several apartment projects
       has seen a spike in dwelling completions over the last
       six months with a total of 931 completions in the six
       months to April 2019, which was 90% more than the
       preceding six months.
•      The 3 month change (to April 2019) in median sales
       pricing (whole of market) reveals a mixed picture
       across the Central Coast with over half the region’s
       suburbs recording positive house price growth, as
       compared to Greater Sydney where less than 8% of
       suburbs recorded growth.

    Median New House and Unit Price
    (Central Coast, Monthly)                                                   Source: NSW

                                                                               Vacancy Rates (Central Coast, Monthly)

    Source: CoreLogic

      Developer Insight                                                        Source: REINSW
      “Central Coast residential development prices have remained stable throughout the Sydney market downturn.
      However, the volume of sales has declined. This is due to a combination of general market caution and a lack of
      new projects entering the market. Some developers are putting projects on hold or looking for alternative funding
      sources to counter the restrictive lending conditions still being imposed by the banks.

      Projects that were marketed two years ago are now being delivered, and astute investors are enjoying steady
      rental take up, yielding around 4.4%. Agents are reporting a stable vacancy rate of 1.9%. Many developers
      are experiencing strong settlement statistics as most valuers are recognising quality in an emerging Gosford
      apartment market.

      The perceived pre-election negative gearing change and post Royal Commission bank lending criteria changes
      has seen a sustained period without investor interest. Some developers have changed their product to focus
      more on the owner occupier, offering more bespoke options and larger apartments to provide an alternative for
      downsizers in a market known for attracting retirees. The further lowering of interest rates, coupled with an easing
      of bank lending criteria, should see a return of the investor and first home buyer as the Central Coast market still
      represents great value for coastal living in comparison to neighbouring Sydney.”

      Richard Ellis – CEO, Central Real
Central Coast                              3 Month Change in Median Sales Price
                                           (Whole of Market, as at 30/04/2019)

      15%
       %                                                    24%
                           0%

                                                                                                                         6

                                                                                                                 8

                                                                                                                                           1. Avoca Beach
                                                                                        5                                                  2. Copacabana
                                                                                            3      4        7                              3. East Gosford
                                                                                                                                           4. Erina
                                                                                                             1                             5. Gosford
                                                                                                                 2                         6. Hamlyn Terrace
                                                                                                                                           7. Terrigal
                                                                                                                                           8. Wyong

                                                                                                                     Source: CoreLogic

Central Coast Update as at 30/04/2019

                                                                                           Median days on market
                    Median sales price   # of listings last 12   12 month change in total                             Median rental yield (12      Average hold
                                                                                          for properties sold in last
                     last 12 months             months              listings (12 months)                                    months)                   period
                                                                                                 12 months

                       $1,010,000                 93                      -5.0%                        56                           2.7%               7.1
  Avoca Beach
                        $800,000                  25                     -13.3%                        26                           3.1%               8.5
                        $890,000                  78                      -3.6%                        60                           3.2%              10.0
  Copacabana

                        $749,700                  58                      -9.4%                        31                           3.3%               7.8
  East Gosford
                        $550,000                  75                     -13.6%                        43                           4.2%               9.2
                        $852,500                  61                     -27.1%                        40                           3.4%               9.2
      Erina
                        $530,000                  32                      20.0%                                                     4.2%               5.3

    Gosford
                        $430,000                 212                      19.5%                        47                           4.7%               7.7
                        $610,000                 224                      1.8%                         57                           4.3%               7.1
Hamlyn Terrace

                        $904,000                 235                      11.6%                        47                           3.5%               9.3
    Terrigal
                        $700,000                 138                      23.3%                        50                           3.8%               7.4
                        $498,750                 105                      13.8%                        43                           4.2%               9.5
     Wyong
                        $385,000                  21                      15.8%                        111                          4.7%               8.1

Source: CoreLogic
Lower                    Approvals (Lower Hunter, Monthly)

                                         Hunter
•      New residential product pricing continues to contract
       across the Lower Hunter with house prices falling by
       5% in Newcastle and Lake Macquarie (to $545k) since
       peaking in February 2018. Unit prices have also fallen
       by 5% over the 12 months to finish at $490k at May
       2019.
•      Dwelling approvals continue to reduce in volume with
       a 15% reduction in approvals in the 12 months to May
       2019 as compared to the preceding 12 month period.
       Multi-unit approvals in particular have dried up –
       reducing by 27% as compared to the volume recorded
       the year prior.
•      The Lower Hunter’s vacancy rate was just 1.7% for June     Source: ABS
       2019 for which was well below Sydney’s (3.4%) and the
       Illawarra’s (2.3%) rates, which reflects the strong on-    Approvals by LGA May 2018 vs May 2019
       going demand profile for rental accommodation.
•      The Newcastle LGA has the shortest median days
       on market (for properties sold in the last 12 months)
       across the Lower Hunter for detached dwellings (31
       days) with Port Stephens (46 days) the longest. Units
       are also selling faster in Newcastle than the other
       Lower Hunter LGAs (36 days) with the exception of
       Lake Macquarie that recorded the same median days
       on market.
    Median New House and Unit Price
    (Hunter, Monthly)

                                                                  Source: NSW DPIE, ABS

                                                                  Weekly Rents (Newcastle LGAs, Apr 2019)
    Source: CoreLogic
                                                                                                       12 Month Change
     Residential Vacancy Rate (Hunter, Monthly)                                   Median Asking Rent
                                                                                                        in Asking Rent
                                                                                                                         Rental Yield

                                                                                          $375              7.1%            5.0%
                                                                   Cessnock
                                                                                          $290              0.0%            5.4%
                                                                                          $430              2.4%            3.9%
                                                                 Lake Macquarie
                                                                                          $370              2.8%            4.3%
                                                                                          $420              5.0%            4.6%
                                                                    Maitland
                                                                                          $320              6.7%            5.0%
                                                                                          $450              3.4%            3.8%
                                                                   Newcastle
                                                                                          $410              2.5%            4.2%
                                                                                          $440              4.8%            4.0%
                                                                 Port Stephens
                                                                                          $350              2.9%            4.4%

                                                                  Source: CoreLogic
    Source: REINSW
Lower Hunter
Local Government Area (LGA) 3 Month Change in Median Sales Price
(Whole of Market, as at 30/04/2019)

                                                                            ↑ 0.0%
                                                                            ↓ 1.5%                         ↑ 1.1%
                                                                                                           ↓ 0.4%

                                                  ↑ 0.0%
                                                  ↓ 1.9%

                                                                        0.0%                                             ↓ 0.8%
                                                                        0.0%                                                   0.0%
                                                                                              Source: CoreLogic

LGA Market Update as at 30/04/2019
                                                                                        Median days on market
                    Median sales price # of listings last   12 month change in total                                 Median rental     Average hold
                                                                                       for properties sold in last
                     last 12 months       12 months            listings (12 months)                                yield (12 months)      period
                                                                                              12 months

                        $390,000              1,288                  -4.8%                        44                    5.0%               9.1
     Cessnock
                        $279,000              123                    4.9%                         61                    5.4%               8.6
                        $580,000              3,838                  -1.2%                        43                    3.9%              10.7
 Lake Macquarie
                        $445,000              581                    2.0%                         41                    4.3%               7.8
                        $470,000              1,672                  -8.7%                        43                    4.6%               7.8
     Maitland
                        $335,000              119                   -14.3%                        55                    5.0%               7.0
                        $620,000              2,773                  3.7%                         38                    3.8%              10.1
    Newcastle
                        $510,000              910                    3.3%                         42                    4.2%               7.9
                        $568,750              1,586                  4.4%                         52                    4.0%              10.3
  Port Stephens
                        $415,000               397                  -13.7%                        60                    4.4%               9.3

Source: CoreLogic

  Developer Insight
  “The market in general over the past 2 months has seen an increase in both enquiry and sales. Mostly
  thanks to the Coalition’s election win, two interest rate cuts, APRA relaxing lending criteria and income
  tax cuts. There is more certainty in the market. We have seen more first home buyers enter the market
  again thanks to buyer incentives such as the new 5 per cent deposit scheme. The Hunter is proving
  a stable and reliable investment for young families and couples and with the Lake Macquarie Region
  showing exceptional value over the last 2 years with a growth rate of 13.89% (*source Real Estate
  Investar) compared to Sydney where the value of homes have fallen more than 15%.

  However, the delivery of market and government planning expectations for future economic and
  population growth has been made very difficult in recent times, due to increased expectations for
  developer funded infrastructure works, combined with increased local and state contributions and
  difficulty in procuring financing for such works. Urban release areas in particular will continue to
  struggle without government assistance and contributions being directed to the associated enabling
  infrastructure with nexus to unlocking this housing supply.”

  Keith Johnson - Managing Director, JPG
Illawarra                      Approvals (Illawarra, Quarterly)

•      The median sale price of new houses across the
       Illawarra dropped 4.3% over the six months to
       April 2019 to $689k. This represents a 32% pricing
       discount to the Greater Sydney market which has
       narrowed from twelve months earlier from when the
       differential was 37%.
•      New unit median pricing declined 1.4% over
       the six months to April 2019 to $599,500, which
       represented a 21% discount on Greater Sydney new
       unit pricing.
•      Sales volumes remain low across the region, with
       house sales down 20% and unit sales down 16% for
       the Wollongong LGA for the 12 months to April 2019.
       With house sales volumes down 22% and units down
       6.4% for the Shoalhaven LGA.                           Source: NSW DPIE, ABS
•      Approvals for new dwellings across the region
       have held up better than other RDMI reporting
       geographies, assisted by strong multi-unit approvals   Approvals by LGA, 12 Months to May 2018
       pipeline in the Shellharbour LGA.                      vs 12 Months to May 2019

Median New House and Unit Price
(Illawarra, Monthly)

    Source: CoreLogic
Residential Vacancy Rate (Illawarra, Monthly)                 Source: NSW DPIE

                                                              Weekly Rents (Illawarra LGAs, Apr 2019)

                                                                                                  12 Month Change
                                                                             Median Asking Rent                     Rental Yield
                                                                                                   in Asking Rent

                                                                                      $580             0.0%            3.4%
                                                                 Kiama
                                                                                      $470             4.4%            3.9%
                                                                                      $500             0.0%            4.1%
                                                              Shellharbour
                                                                                      $410             0.0%            4.2%
                                                                                      $400             3.9%            3.8%
                                                              Shoalhaven
                                                                                      $325             -1.5%           4.0%
                                                                                      $500             -3.8%           3.6%
                                                              Wollongong
                                                                                      $400             0.0%            3.6%

Source: REINSW
                                                              Source: CoreLogic
Illawarra
Local Government Area (LGA) 3 Month Change in Median Sales Price
(Whole of Market, as at 30/04/2019)

                                                                                                                  Wollongong
                                                      Kiama
                                                                                                                ↓ 3.3%
                                                 ↓ 4.1%                                                         ↓ 3.0%
                                                 ↑ 2.4%

                                                                                                                               Shellharbour
                                                                                                                            ↓ 1.8%
                                                                    Shoalhaven
                                                                                                                            ↓ 1.5%
                                                                    ↓ 1.8%
                                                                    ↓ 2.3%

                                                                        Source: CoreLogic

LGA Market Update as at 30/04/2019
                                                                                             Median days on market
                    Median sales price # of listings last     12 month change in total                                    Median rental       Average hold
                                                                                            for properties sold in last
                     last 12 months       12 months              listings (12 months)                                   yield (12 months)        period
                                                                                                   12 months

                        $882,250              401                     11.4%                            49                      3.4%              11.0
     Kiama
                        $627,500              115                     11.4%                            51                      3.9%               7.5
                        $638,250              1,155                    0.8%                            57                      4.1%               9.6
  Shellharbour
                        $512,000              261                      6.7%                            67                      4.2%               8.4
                        $550,000              2,988                    -1.0%                           83                      3.8%               9.0
   Shoalhaven
                        $425,000              274                     24.6%                            97                      4.0%               7.7
                        $725,000              2,439                    -6.8%                           53                      3.6%              10.3
   Wollongong
                        $572,500              1,172                    7.7%                            54                      3.6%               8.0

Source: CoreLogic

  Developer Insight
 “Against the backdrop of a qualified tough market in Sydney, the Illawarra region’s property
 market has held up well. Sales momentum has slowed but median prices for apartments and
 housing have remained relatively stable, buoyed by the federal election result and consecutive
 interest rate cuts. More recently, we’ve seen specific pockets and projects outperform. A new
 record price for land in the Shell Cove project in Shellharbour was recorded in July, while
 land, housing and apartment pre-sales are secured for settlements over the next two years.
 High quality product near well considered amenity including open space, retail and transport
 connections remains in strong demand, with purchasers continuing to invest in pockets where
 lifestyle opportunities are matched with housing choice.”

 Simone Dyer – Development Director, Frasers Property Australia
ACT &                             Approvals (New, ACT, by Dwelling Type) 12
                                                              Months to May 2018 vs 12 Months to May 2019
                            Queanbeyan
•     The median house price in the ACT (whole of market)
      has increased by 0.8% to $660k in the three months
      to May 2019, while unit prices remained flat at
      $427k.
•     Sales volumes have fallen slightly over the last 3
      months, with house sales down 3.4% and unit sales
      down 4.2%.
•     Approvals in the ACT & Queanbeyan have picked,
      increasing by 11% in the 12 months to June 2019 as
      compared to the previous 12 month period. Both
      multi-unit (+12%) and detached house approvals
      (+8%) helped drive this result.
•     The well stocked multi-unit pipeline saw a three year
      high of dwelling completions in Q1-19 – driven by the
      practical completion of several significant apartment
      projects.
                                                              Source: ABS
Weekly Auction Clearance Rates (ACT)
                                                              Approvals (New, Queanbeyan, by Dwelling Type)
                                                              12 Months to May 2018
                                                              vs 12 Months to May 2019)

                                                              Source: ABS

                                                              Completions (ACT, Quarterly)

Source: Domain

    Approvals (ACT, Monthly)

                                                              Source: ABS
    Source: ABS
ACT & Queanbeyan
3 Month Change in Median Sales Price (Houses), as at 30/04/2019

            15%
              %                                                   29%%
                                 0%

                                                                                                                             Queanbeyan Urban
                                                                                                                             (NSW)

LGA Market Update as at 31/01/2019                                                                                                       Source: CoreLogic

                                                                                        Median days on market
                    Median sales price # of listings last   12 month change in total                                 Median rental     Average hold
                                                                                       for properties sold in last
                     last 12 months       12 months            listings (12 months)                                yield (12 months)   period (years)
                                                                                              12 months

                        $660,000              5,530                  -6.7%                        36                    4.5%               10.8
      ACT
                        $427,500              3,390                  5.0%                         50                    5.6%                8.7
                        $635,000              911                    -1.1%                        54                    4.6%                8.3
 Queanbeyan
                        $341,000              454                   -10.5%                        56                    5.0%                8.3

 Developer Insight
Source: CoreLogic

 “Canberra has managed to avoid most of the downturn felt along the east coast, with all
 indicators showing life across the entire ACT property market. There are a few reasons why
 Canberra has maintained strength, particularly for investors. The first, is Australia’s lowest
 rental vacancy rates, which in some suburbs sit below 1%. We are seeing people line-up down
 the street for quality apartment inspections. Secondly, short supply brings high yield. We have
 a rental crisis in Canberra – there simply isn’t enough quality stock to satisfy the market, which
 makes it more expensive than anywhere else in Australia to rent. Investors love Canberra
 because of these two critical indicators. We don’t foresee any negative impacts manifesting in
 the ACT market while yield remains high and vacancy remains low.”

 Nick Georgalis – Founder and Managing Director, Geocon
National Property Clock
                      Adapted from Herron Todd White, Month in Review July
                      2019

                                        Canberra                    HOUSES
                       Hobart                                Central Coast
                                                             Gold Coast

                  Adelaide
                  Launceston                                      Newcastle

                       Cairns                                Illawarra
                       Townsville                            Southern Highlands
                                                             Sydney

                                      Brisbane
                                      Perth
                                      Melbourne
                        Bathurst

 Hobart
 Sunshine Coast
                                          Central Coast
                                          Geelong
                                          Coffs Harbour      UNITS
                                           Canberra Newcastle
Launceston
                                           Perth    Gold Coast
Dubbo

                                        Illawarra
    Adelaide
                                        Southern Highlands
    Cairns
                                        Sydney
    Townsville
                                                             Source: Herron Todd White,
                        Brisbane
                                                             Month in Review, July 2019
                        Ipswich
                        Melbourne
ABOUT UDIA
                             THE URBAN DEVELOPMENT INSTITUTE OF AUSTRALIA (UDIA)
                           IS THE PEAK BODY REPRESENTING THE URBAN DEVELOPMENT
                                                           INDUSTRY IN AUSTRALIA.

  Officially established in 1963, UDIA NSW has grown to become the leading industry body representing the interest of
                                                                                   the NSW property development sector.

     UDIA NSW aims to secure the viability and sustainability of the urban development industry for the benefit of our
          members and the communities they create by advocating for more liveable, affordable and connected cities.

  We represent the leading participants in the industry and have more than 500 member companies across the entire
        spectrum of the industry including developers, institutional investors, third party logistics providers, financiers,
  builders, suppliers, architects, engineers, lawyers, town planners, academics and state and local government bodies.
                                                                 A quarter of these members are based in regional NSW.

   UDIA NSW members are represented by an elected council of 13 leading industry practitioners who are responsible
  for the strategic direction of the Institute. UDIA NSW also has an extensive committee and regional chapter structure
                     that involves more than 300 of the development industry’s key stakeholders in policy formulation.

KEY CONTACTS
       STEVE MANN                                                ELLIOTT HALE                                  ANTHONY
       CEO                                                     GENERAL MANAGER                                 NICOLAOU
                                                                    POLICY,                                GENERAL MANAGER
                                                                   MEDIA AND                                  SALES AND
                                                                  GOVERNMENT                                  MARKETING
       smann@udiansw.com.au                                        RELATIONS

                                                                 KYLIE PRINCE                                 TOBY ADAMS
                                                               GENERAL MANAGER                             GENERAL MANAGER
                                                                  OPERATIONS                                 STRATEGY AND
                                                                                                               RESEARCH

                                               UDIA NSW OFFICE
                                               UDIA NEW SOUTH WALES
      RDMI EDITOR                              02 9262 1214

      ANGUS MANN                               LEVEL 5, 56 CLARENCE ST.
      RESEARCH OFFICER                         SYDNEY, NSW 2000

      Please direct enquiries to:              www.udiansw.com.au
      amann@udiansw.com.au
                                               udia@udiansw.com.au
Image: The Grange at Marsden Park
by Winten Property Group

                 Research Partners   Gold Sponsors   Silver Sponsors
You can also read