Vanguard's principles for investing success - Find a Society
←
→
Page content transcription
If your browser does not render page correctly, please read the page content below
Vanguard’s principles
       for investing success

Authorized by Vanguard Investments Canada Inc. for investor use.
About Vanguard
The Vanguard Group, Inc. Vanguard Investments Canada Inc.
• Founded: 1975 • Founded: December 2011
• Corporate headquarters: Valley Forge, • Headquarters: Toronto, Ontario, Canada
Pennsylvania, United States
• Total assets: $11.0 billion
• Total assets: $5.7 trillion worldwide
• Number of products: 33 ETFs listed on
• Number of products: More than 350 Toronto Stock Exchange
mutual funds and ETFs worldwide
Source: The Vanguard Group, Inc. as of March 31, 2017.
Note: All assets are in CAD.
Authorized by Vanguard Investments Canada Inc. for investor use. 2What makes us different
Our core purpose:
To take a stand for all investors, to treat them fairly
and to give them the best chance for investment success.
Client Low-cost
focus investing
Long-term
thinking
Authorized by Vanguard Investments Canada Inc. for investor use. 3Vanguard’s principles for investment success
Goals Balance
Cost Discipline
Authorized by Vanguard Investments Canada Inc. for investor use. 4Create clear, appropriate investment goals
• Recognizing constraints is essential to developing an investment plan
• A basic plan will include specific, attainable expectations about
contribution rates and monitoring
• Discouraging results often come from chasing market returns, an
unsound strategy that can seduce investors who lack well-grounded
plans for achieving their goals
• Without a plan, investors can be tempted to build a portfolio based on
transitory factors such as fund ratings—something that can amount to a
“buy high, sell low” strategy
Authorized by Vanguard Investments Canada Inc. for investor use. 5Define the goal and constraints
Example of a basic framework for an investment plan
Objective Save $1,000,000 for retirement, adjusted for inflation
Constraints 30-year horizon
Moderate tolerance for market volatility and loss; no tolerance for nontraditional risk
Current portfolio value $50,000
Monthly net income of $4,000; Monthly expenses of $3,000
Consider impact of taxes on portfolio allocations and returns
Saving or spending target Ability to contribute $5,000 in first year
Intention to raise contribution by $500 per year, to a maximum of $10,000 annually
Asset allocation target 70% allocated to diversified stock funds; 30% allocated to diversified bond funds
Rebalancing methodology Rebalance annually
Monitoring and evaluation Periodically evaluate current portfolio value relative to savings target, return expectations and
long-term objective
Adjust as needed
This example is completely hypothetical. It does not represent any real investor and should not be taken as a guide. Depending on an actual investor’s circumstances, such a plan or
investment policy statement could be expanded or consolidated. For example, many financial advisors or institutions may find value in outlining the investment strategy, i.e. specifying
whether tactical asset allocation will be employed, whether actively or passively managed funds will be used and the like.
Source: Vanguard.
Authorized by Vanguard Investments Canada Inc. for investor use. 6Without a plan, many invest bottom up
Investors tend to buy highly rated funds even as they underperform
Median performance of funds versus style benchmarks Cash flows for Morningstar-rated funds in periods after the ratings
over the 36 months following a Morningstar rating were posted
10
0.0%
Cummulative cash flows ($ billions)
Annualized 36-month fund performance
-0.5%
5-star 5
4-star
3-star
relative to benchmark
-0.7% 0
-1.0% -0.9% 2-star
-1.0% 1-star
-5
-1.5%
-1.6% -10
-2.0%
-2.0% -15
1Yr 3Yr 5Yr
-2.5%
5-star 4-star 3-star 2-star 1-star 5-star 4-star 3-star 2-star 1-star
Notes: Data cover the period from January 2002 to December 31, 2016. Morningstar changed its rating methodology during this period, but there was no material
impact on our analysis. The analysis includes all share classes of Canadian equity funds, both live and obsolete. To be included, a fund had to have a Morningstar
Rating and 36 months of continuous performance following the rating date. Fund returns are net of expenses, but not of any loads. The results are relative to the
funds’ category benchmark as defined by Russell, however similar results were achieved relative to MSCI and Standard and Poor’s indexes as well.
Sources: Data on cash flows, fund returns and ratings were provided by Morningstar. Index data to compute relative excess returns were provided by Thomson
Reuters Datastream. More information is available in the Vanguard research paper Mutual Fund Ratings and Future Performance (Philips and Kinniry, 2010).
Authorized by Vanguard Investments Canada Inc. for investor use. 7Key takeaways
• Define goals clearly
• Approach planning with a level head
• Create a detailed, specific plan
Authorized by Vanguard Investments Canada Inc. for investor use. 8Develop a suitable asset allocation using broadly diversified funds
• A diversified portfolio’s proportions of stocks, bonds and other
investment types determine most of its return as well as its volatility
• Attempting to escape volatility and near-term losses by minimizing
stock investments exposes investors to other types of risk, including
the risks of failing to outpace inflation or falling short of an objective
• Realistic return assumptions—not hopes—are essential in choosing
an allocation
• Leadership among market segments changes constantly and
rapidly, so investors must diversify both to mitigate losses and to
participate in gains
Authorized by Vanguard Investments Canada Inc. for investor use. 9The mixture of assets defines the spectrum of returns
Returns for the 95th and 5th percentiles and on average for various equity/fixed income allocations, 1901–2016
Portfolio allocation 100% 90% 80% 70% 60% 50% 40% 30% 20% 10% 0% Fixed income
0% 10% 20% 30% 40% 50% 60% 70% 80% 90% 100% Equity
Annual returns 40% 36.1%
33.0%
29.9%
30% 26.8%
23.7%
19.3% 19.3% 21.3%
20% 17.6% 16.4% 17.5%
6.8% 7.2% 7.6% 8.0% 8.3% 8.7% 8.9% Average
10% 4.7% 5.3% 5.8% 6.3%
0%
-4.5% -3.7%
-10% -4.5% -5.2% -6.7% -7.3%
-9.7% -11.3%
-20% -13.6%
-16.4%
-19.1%
-30%
For illustrative purposes only. The hypothetical portfolios do not represent the return on any particular investment.
Notes: Equities are represented by the DMS Canada Equity Index from 1901 to 1984, and the S&P/TSX Composite Index thereafter. Fixed income is represented by the DMS Canada
Bond Index from 1900 to 1984, the Citigroup World Government Bond Index from 1985 through 2001 and the Bloomberg Barclays Canadian Issues 300MM Index thereafter. Data are
through December 31, 2016.
Sources: Vanguard, using data from Morningstar, Inc. and Barclays.
Authorized by Vanguard Investments Canada Inc. for investor use. 10The importance of asset allocation
Investment outcomes are largely determined by the long-term mixture of assets in a portfolio
Percent of a portfolio's movements over time explained by:
86% Asset allocation
14% Security selection and market timing
Note: Calculations are based on monthly returns for 303 Canadian funds from January 1990 to September 2015. For details of the methodology, see the Vanguard research paper The
global case for strategic asset allocation and an examination of home bias (Scott et al., 2016).
Sources: Vanguard calculations, using data from Morningstar, Inc.
Authorized by Vanguard Investments Canada Inc. for investor use. 11Diversification can protect against catastrophic loss
The ten worst and best stocks in the S&P/TSX Index in 2008
Worst performers Return (%) Best performers Return (%)
Nortel Networks Corp. -89.99 Fording Candadian Coal Trust 135.77
Uranium One Inc. -88.45 Eldorado Gold Corp. 65.52
Teck Resources Ltd. -82.83 Celestica Inc. 51.64
Nova Chemicals Corporation -81.53 Metro Inc. 43.06
Lundin Mining Corp. -81.13 Fairfax Financial Holdings Ltd. 38.25
Opti Canada Inc. -80.66 Kinross Gold Corp. 23.46
First Quantum Minerals Ltd. -79.09 Agnico-Eagle Mines Ltd. 15.63
Sherritt International Corp. -75.70 Goldcorp Inc. 14.21
Inmet Mining Corp. -75.53 George Weston Ltd. 13.89
Ivanhoe Mines Ltd. -69.72 Open Text Corp. 13.13
Sources: FactSet and Vanguard as of December 31, 2008.
For illustrative purposes only. Please note that this example reflects the financial crisis and, in particular, the fact that the majority
of the decline in stock prices occurred in 2008.
Examples of underlying securities mentioned in this material should not be construed as a recommendation to buy, sell or hold the securities.
Authorized by Vanguard Investments Canada Inc. for investor use. 12Key takeaways
• A portfolio’s asset allocation is responsible for its risk and return
• Stocks have the greatest expected return and risk
• Avoiding stocks and their volatility means assuming additional risks
• Diversification can protect against catastrophic loss
Authorized by Vanguard Investments Canada Inc. for investor use. 13Sub-asset allocation
What Why When Risks
Remain diversified May add value Suitable for less Possible
over broad market risk-averse underperformance
but overweight investors
or underweight who are comfortable
market segment with additional
sector risk but
who do not want to
deviate significantly
from a market-cap-
weighted equity
portfolio
Authorized by Vanguard Investments Canada Inc. for investor use. 14Sub-asset allocation case study
Background Goal Solution
An investor’s Investor believes that Overweight the desired
U.S. equity portfolio a bias toward value sector using value,
has a risk profile similar or small-cap stocks small-cap and/or
to that of the broad can enhance small-cap value ETFs
U.S. stock market long-term returns
Market-like portfolio Want small-cap value tilt Buy small-cap value ETF
Authorized by Vanguard Investments Canada Inc. for investor use. 15Asset classes
Stocks Bonds Cash
Stocks represent In essence, bonds are Guaranteed Investment
shares of ownership in loans to a government Certificates (GICs),
a company. Canada or a company. Over the treasury bills and
stock funds have long term, Canada money market funds
historically provided the bond funds have are all considered cash
highest long-term provided average investments. All, or
returns – typically an annual returns of about nearly all, of the returns
average of about 8.4% 7.6% and have from cash investments
per year. generally been less come from interest.
volatile than stocks.*
* Source: Stocks are represented by the S&P/TSX Composite Index. Bonds are represented by the Citigroup World Government Bond Index from 1985 through 2001and the
Barclays Canadian Issues 300MM Index thereafter. Data are from December 31, 1985, through December 31, 2013.
Authorized by Vanguard Investments Canada Inc. for investor use. 16Stocks are risky—and so is avoiding them
• The attempt to escape market risk by investing in stable, lower-
returning assets can expose a portfolio to other longer-term risks
• Cash or short-term bonds can come with opportunity cost or
“shortfall risk”
• Over a 30-year horizon a 3% inflation rate reduces a portfolio’s real
value by 50%
• For investors with longer horizons, inflation risk may outweigh
market risk, often necessitating a sizable allocation to investments
such as stocks
Authorized by Vanguard Investments Canada Inc. for investor use. 17Diversify to manage risk
Annual returns for various investment categories ranked by performance, best to worst: 2006-2016
Canadian equity Non-Canadian equity
2006 2007 2008 2009 2010 2011 2012 2013 2014 2015 2016
S&P/TSX MSCI EAFE Index
41.46% 18.55% 12.00% 62.38% 35.10% 10.00% 28.53% 31.57% 23.73% 21.47% 38.48% Composite Index
MSCI Emerging
S&P/TSX Markets Index
32.08% 9.83% 7.10% 52.03% 17.61% 9.62% 16.00% 12.99% 14.20% 20.24% 21.08% SmallCap Index
MSCI ACWI Real
Estate Index
26.38% 5.02% 6.63% 35.05% 12.97% 9.54% 15.33% 8.54% 10.55% 19.46% 7.90%
Canadian fixed Non-Canadian fixed
17.26% 4.51% 5.73% 14.72% 12.39% 6.33% 15.28% 7.60% 9.03% 3.71% 7.74% income income
11.61% 3.96% -19.51% 13.99% 10.73% -6.15% 7.19% 4.29% 8.59% 3.65% 6.08% Bloomberg Bloomberg Barclays
Barclays Canadian Emerging Market
300MM Index USD Aggregate
9.54% 0.90% -28.78% 12.49% 6.95% -8.71% 6.55% 2.31% 7.46% 2.42% 3.73% Bond Index
Citigroup WGBI
Canada All Bloomberg Global
4.01% -1.43% -33.00% 5.04% 6.88% -9.55% 3.27% 0.62% 7.03% 1.61% 1.44% Maturities Aggregate Bond
Index (CAD-hedged)
3.54% -5.33% -36.55% 3.62% 6.18% -11.17% 2.19% -1.59% 4.12% -8.32% -0.34%
Other
2.58% -10.81% -41.44% 0.98% 5.04% -16.15% -2.23% -2.28% -2.34% -9.64% -0.40%
Bloomberg
Commodity Index
1.68% -17.48% -45.49% -1.71% 2.56% -16.43% -3.25% -3.45% -9.53% -13.31% -2.00%
Notes: Benchmarks reflect the following asset classes—for large-capitalization Canadian equity, the S&P/TSX Composite Index; for small-cap Canadian equity, the S&P/TSX
SmallCap Index; for developed international equity markets, the MSCI EAFE Index, for emerging markets, the MSCI Emerging Markets Index; for commodities, the Bloomberg
Commodity Index; for real estate, the MSCI ACWI Real Estate Index; for Canadian government fixed income, the Citigroup WGBI Canada All Maturities; for Canadian investment-
grade fixed income, the Bloomberg Barclays Canadian 300MM Index; for international fixed income, the Bloomberg Barclays Global Aggregate Bond Index (CAD-hedged); and for
emerging market fixed income, the Bloomberg Barclays Emerging Market USD Aggregate Bond Index.
Source: Vanguard illustration using data from Standard & Poor’s, MSCI, Bloomberg and Citi.
Authorized by Vanguard Investments Canada Inc. for investor use. 18Home bias
Authorized by Vanguard Investments Canada Inc. for investor use. 19Home bias—we all have it
Most country investors are far away from lowest risk equity portfolio
Risk and returns for various equity portfolios (January 1, 1988–December 31, 2011)
10%
100% AUS 100% U.S.
Average annual return
9% 100% CAN
100% U.K.
8%
100% World ex-U.K.
7%
100% World ex-CAN
6%
70% ex-Canadian assets
100% World ex-U.S.
5% 100% World ex-AUS
4%
10% 11% 12% 13% 14% 15% 16% 17% 18% 19%
Average annual standard deviation
Source: Vanguard calculations using Thomson Reuters Datastream.
Note: Domestic returns are represented by the MSCI USA Index, MSCI UK Index, MSCI Australia Index, and MSCI Canada Index. Foreign ex domestic returns are represented by
MSCI All Country World Ex-Country Indices for the US, UK and Australia. Because a comprehensive index for global equities ex Canada is not available from Thomson Reuters, we
spliced the MSCI EAFE index (CAD) with the MSCI Emerging Markets Index (CAD) and the MSCI USA Index (CAD). All returns denominated in domestic currencies.
Authorized by Vanguard Investments Canada Inc. for investor use. 20Bonds: Why go global?
Bond correlation over time is less than one
Correlation of the monthly change in each country's 10-year government bond yield to that of Canada,
Jan 1998–Nov 2013
1.00
0.75
0.6
0.6 0.6
0.5 0.5 0.5
0.50
0.4
0.4
0.3
0.3
0.25
0.1 0.1
0.00
Australia Belgium France Germany Italy Japan Netherlands South Spain Sweden UK US
Korea
Source: Vanguard, based on data from Thomson Reuters Datastream.
Authorized by Vanguard Investments Canada Inc. for investor use. 21Canadian equities account for only 4% of world capitalization
But Canada’s stock market ranks No. 4 compared with its GDP (No. 11) and population (No. 35)
Country stock market as a percentage of world market cap
Rank Country 12/31/2012 2/28/2014 Change
1 United States 45.05 49.06 4.01
2 United Kingdom 8.05 7.95 –0.10
3 Japan 6.90 7.64 0.74
4 Canada 4.26 3.58 –0.68
5 France 3.54 3.44 –0.10
6 Germany 3.03 3.27 0.24
7 Switzerland 2.93 3.17 0.24
8 Australia 3.32 2.71 –0.61
9 China 2.38 1.92 –0.46
10 Korea 2.20 1.59 –0.61
Source: Vanguard – MSCI country weights in Total World Stock Market Index.
Authorized by Vanguard Investments Canada Inc. for investor use. 22Home bias in stocks and bonds
Home bias in domestic equity markets Home bias in domestic fixed income markets
60% 40%
Market Local market
proportional Market
50% overweight
Weight in global market
allocation proportional 52%
Weight in global market
Local 30% allocation
23% market
40%
overweight
20%
30%
85%
20% 54%
10%
53%
10% 39%
84%
67% 0%
0%
-10% -10%
0% 25% 50% 75% 100% 0% 25% 50% 75% 100%
Domestic allocation to domestic equities Domestic allocation to domestic fixed income
US Equities UK Equities US Equities UK Equities
Canadian Equities Australian Equities Canadian Equities Australian Equities
Source: International Monetary Fund Coordinated Portfolio Investment Survey, Dec. 31, 2012, Barclays and Thomson Reuters Datastream.
Note: The IMF Coordinated Portfolio Investment Survey was used in conjunction with market capitalization information to determine domestic and foreign investment. The MSCI All
World All Country index is used to represent the world equity market portfolio. Country weights for domestic equities are represented by the MSCI USA Investable Market Index, the
MSCI UK Investable Market Index, the MSCI Australia Investable Market Index and the MSCI Canada Investable Market Index. The fixed income market capitalization for the world
and each individual country is provided by the Bank for International Settlements (BIS). We use market-cap data from the BIS because the data is generally more comprehensive and
covers all domestic and foreign issuances whereas data from index providers such as Barclays generally cover only the investable portions of the market. Central bank holdings of
domestic bonds were excluded from our calculations as they represent closely held or unavailable securities. The investment holdings data for a given country can be categorized as
either “foreign investment by domestic investors” or “domestic investment by domestic investors”. The sum of these equals “total investment by domestic investors”. The percentage
allocated to domestic securities divides “domestic allocation by domestic investors” by the “total investment by domestic investors”.
Authorized by Vanguard Investments Canada Inc. for investor use. 23How much should go outside the home market?
Factors affecting the foreign asset allocation decision
0% Historical risk/return Market
international allocation to international proportional
Domestic sector variation from
No deviation High deviation
world market
Domestic issuer concentration
Diverse Highly concentrated
Favour Low Domestic transaction costs High Favour
Local Global
Market High Domestic liquidity Poor Market
Advantages Domestic asset taxes Disadvantages
No Impact Other domestic risk factors? Significant risks
Additional considerations
Regulatory limits and liability matching systems
Authorized by Vanguard Investments Canada Inc. for investor use. 24Sector differences are large relative to the global economy
Canada has some major differences in sector exposure
Sector differences vs. MSCI ACWI IMI
Sectors MSCI USA IMI MSCI UK IMI MSCI Australia IMI MSCI Canada IMI
Consumer Discretionary 0.8 –2.6 –8.8 –6.6
Consumer Staples –0.4 5.2 –0.8 –5.7
Energy 0.4 6.1 –3.3 16.5
Financials –4.5 –0.1 25.8 13.7
Health Care 2.6 –2.4 –5.4 –6.8
Industrials –0.4 –2.9 –5.5 –3.8
Information Technology 5.7 –10.3 –11.8 10.9
Materials –2.6 2.5 12.6 6.3
Telecommunication Services –1.6 3.8 –1.6 –1.3
Utilities –0.1 0.7 –1.4 –1.4
Sum of absolute deviations 19.1 36.6 76.8 72.9
Yellow shading denotes deviations between 5% and 9.99%.
Red shading denotes deviations 10% or greater.
Source: Vanguard calculations based on FactSet data. Note: Data as of 12/31/2013
Authorized by Vanguard Investments Canada Inc. for investor use. 25In conclusion
Home bias is significant in Canada
and everywhere else too
What to do about it?
Diversify globally, based on local factors
Home bias exists in bonds too
Hedging is key to bringing bond volatility down
Authorized by Vanguard Investments Canada Inc. for investor use. 26Minimize cost
• Higher costs can significantly depress a portfolio’s growth over long periods
• Costs create an inevitable gap between what the markets return and what investors
actually earn—but keeping expenses down can help to narrow that gap
• Lower-cost mutual funds have tended to perform better than higher-cost funds over time
• Indexed investments can be a useful tool for cost control
Authorized by Vanguard Investments Canada Inc. for investor use. 27Why cost matters
The long-term impact of investment costs on portfolio balances
Assuming a starting balance of $100,000 and a yearly return of 6%, which is reinvested
600,000 $574,349 No costs
550,000
$532,899 0.25% annual cost
500,000
450,000
Portfolio value, $
400,000
$378,923 1.40% annual cost
350,000
300,000
250,000
200,000
150,000
100,000
5 10 15 20 25 30
Years
Note: The portfolio balances shown are hypothetical and do not reflect any particular investment. The final account balances do not reflect any taxes or penalties that might be due
upon distribution. The Management Expense Ratoio (MER) is used for the expense ratio. MER is the sum of the management expenses incurred by the fund expressed as a
percentage of the average net assets throughout the year.
Source: Vanguard calculations using data from Morningstar.
Authorized by Vanguard Investments Canada Inc. for investor use. 28Reduce cost to help improve return
Average annual returns over the ten years through 2016
10
Average annual return for ten years through 2016
9
8
7
6
5
4
3
2
1
0
Large-cap Mid-cap U.S. equity Intermediate-term Short-term
Equity Fixed income
Median fund in lowest-cost quartile
Median fund in highest-cost quartile
Notes: All Canada-domiciled mutual funds in each Morningstar category were ranked by their expense ratios as of December 31, 2016. They were then divided into four equal groups,
from the lowest-cost to the highest-cost funds. The chart shows the ten-year annualized returns for the median funds in the lowest-cost and highest-cost quartiles. Returns are net of
expenses, excluding loads and taxes. Both actively managed and index funds are included, as are all classes with at least ten years of returns.
Source: Vanguard calculations, using data from Morningstar, Inc.
Authorized by Vanguard Investments Canada Inc. for investor use. 29Indexing can help minimize cost
Asset-weighted expense ratios of active and indexed investments
Average expense ratio as of December 31, 2016
Actively managed funds Index funds Difference
Canadian equity 1.10% 0.26% 0.84
International equity 1.11% 0.42% 0.69
U.S. equity 1.37% 0.34% 1.03
Canadian fixed income 0.59% 0.33% 0.26
Notes: “Asset-weighted” means that the averages are based on the expenses incurred by each invested dollar. Thus, a fund with sizable assets will have a greater impact on the
average than a smaller fund. Analysis includes all share classes of funds available for sale in Canada.
Source: Vanguard calculations, using data from Morningstar, Inc.
Authorized by Vanguard Investments Canada Inc. for investor use. 30Low-cost indexing can improve returns
Percentage of active funds outperforming the average return of low-cost index funds
over the ten years through 2016
1 Based on funds surviving after ten years
0.9 Based on survivors plus funds closed or merged
0.8
0.7
0.6
0.5 44% 42%
0.4
32%
28%
0.3
22% 22% 20%
0.2 16% 16%
8%
0.1
0
Large-cap blend Small-cap blend International equity: International equity: Diversified U.S. fixed
Developed markts Emerging markets income
Morningstar category
Notes: Data cover the ten years ended December 31, 2016. The actively managed funds are those listed in the respective Morningstar categories.
Sources: Morningstar and Vanguard.
Authorized by Vanguard Investments Canada Inc. for investor use. 31Key takeaways
• Investors cannot control markets, but they can control what they pay to invest
• The lower your costs, the greater your share of an investment’s return
• Lower-cost investments have tended to outperform higher-cost alternatives
Authorized by Vanguard Investments Canada Inc. for investor use. 32Maintain perspective and long-term discipline
• Enforcing an asset allocation through periodic rebalancing can help
manage a portfolio’s risk
• Spontaneous departures from such an allocation can be costly
• Attempts to outguess the market rarely pay
• Chasing winners often leads to a dead end
• Simply contributing more money toward an investment goal can be a
surprisingly powerful tool
Authorized by Vanguard Investments Canada Inc. for investor use. 33Ignore the temptation to alter allocations
Market timing versus a market benchmark: A spotty record
Performance of flexible-allocation funds compared with a 60% stock/40% bond benchmark, January 1997-December 2016
0.7
0.6
0.5
0.4
0.3
0.2
0.1
0
Bull Market 1/1/97 - Bear Market 9/1/00 - Bull Market 3/1/03 - Bear Market 11/1/07 - Bull Market 3/1/09 -
8/31/00 2/28/2003 10/31/07 2/28/2009 12/31/16
Notes: The balanced benchmark consists of the MSCI US Broad Market Index (42%), the MSCI All Country World Index ex USA (18%) and the Barclays U.S. Aggregate Bond Index
(40%). Flexible-allocation funds are those defined by Morningstar as having “a largely unconstrained mandate to invest in a range of asset types.”
Source: Vanguard, using data from Morningstar.
Authorized by Vanguard Investments Canada Inc. for investor use. 34The case for discipline
The importance of maintaining discipline: Failure to rebalance can increase an investor’s exposure to risk
Changes in equity exposure for a rebalanced portfolio and a “drifting portfolio,” 2006–2016
70%
65%
Allocation to stocks
60%
55%
50% Target Allocation
Equity Allocation: Semi-annual Rebalance Portfolio
Equity Allocation: “Set and Forget Portfolio
45%
40%
2006 2007 2008 2009 2010 2011 2012 2013 2014 2015 2016
Year
Notes: The initial allocation for both portfolios is 30% Canadian equities, 30% international equities and 40% Canadian fixed income. The rebalanced portfolio is returned to this
allocation at the end of each June and December. Returns for the Canadian equity allocation are based on the S&P/TSX Composite Index. Returns for the international equity
allocation are based on the MSCI EAFE, MSCI USA and MSCI Emerging Markets Indexes allocated at their historic market weights. Returns for the fixed income allocation are based
on the Citigroup World Government Bond Index—Canada All Maturities. This hypothetical illustration does not represent the results of any particular investment.
Source: Vanguard, using data provided by Thomson Reuters Datastream.
Authorized by Vanguard Investments Canada Inc. for investor use. 35Ignore the temptation to chase last year’s winner
Fund leadership is quick to change
January 1, 2003
270 funds
December 31, 2007 81% (218) underperformed 19% (52) outperformed
December 31, 2012 29% (15) out-
71% (37) underperformed
performed
Note: The chart is based on a ranking of all actively managed Canadian equity funds covered by Morningstar traditional style categories according to their excess returns versus their
stated benchmarks as reported by Morningstar during the five years through 2007.
Sources: Vanguard and Morningstar.
Authorized by Vanguard Investments Canada Inc. for investor use. 36Market timing and performance chasing can be a drag on returns
How investors’ returns lagged their funds’ returns 2002-2016
Diversified Foreign small- Emerging Markets
Balanced International Equity U.S. Equity Emerging Markets Commodities cap/mid-cap blend Global Real Estate Alternative Taxable Bond Sector Equity Municipal Bond High Yield Bond Bond
0
Average anual difference between investor return and
-0.5 -0.33
-0.44 -0.47
-0.61 -0.62 -0.62
-1
-1.1
fund return (%)
-1.12 -1.15 -1.17
-1.5 -1.43
-2
-2.14
-2.5
-2.61
-3
Notes: The average difference is calculated based on Morningstar data for investor returns and fund returns. Morningstar Investor Return™ assumes that the change in a fund’s total
net assets during a given period is driven by both market returns and investor cash flow. To calculate investor return, the change in net assets is discounted by the fund’s investment
return to isolate the amount of the change driven by cash flow; then a proprietary model is used to calculate the rate of return that links the beginning net assets and the cash flow to
the ending net assets.
Sources: Morningstar and Vanguard calculations. Data cover the period from January 1, 2002, through December 31, 2016.
Authorized by Vanguard Investments Canada Inc. for investor use. 37Key takeaways
• Because investing evokes emotion, even sophisticated investors should
maintain long-term discipline
• Abandoning a planned investment strategy can be costly
• Often, the most significant derailer is behaviour—failure to rebalance,
the allure of market timing and the temptation to chase performance
Authorized by Vanguard Investments Canada Inc. for investor use. 38Important information
Commissions, management fees, and expenses all may be associated with investments in a Vanguard ETF ®. Investment objectives, risks, fees,
expenses, and other important information are contained in the prospectus; please read it before investing. ETFs are not guaranteed, their values
change frequently, and past performance may not be repeated. Vanguard ETFs ® are managed by Vanguard Investments Canada Inc., an indirect
wholly owned subsidiary of The Vanguard Group, Inc.
Date of publication: May 25, 2017.
The opinions expressed in this presentation are those of the individual representative and do not necessarily reflect the opinions of Vanguard Investments
Canada Inc. No implied or express recommendation, offer, or solicitation to buy or sell any security or to adopt any particular investment or portfolio strategy is
made in this material. This presentation is not research, investment and/or tax advice and it is not tailored to the needs or circumstances of any individual
investor.
Information, figures and charts are summarized for illustrative purposes only and are subject to change without notice. While this information has been
compiled from sources believed to be reliable, Vanguard Investments Canada Inc. does not guarantee the accuracy, completeness, timeliness or reliability of
this information or any results from its use. Information regarding third-party investment fund managers is solely for educational purposes.
All investments, including those that seek to track indexes, are subject to risk, including the possible loss of principal. Diversification does not ensure a profit or
protect against a loss in a declining market. While Vanguard ETFs are designed to be as diversified as the original indexes they seek to track and can provide
greater diversification than an individual investor may achieve independently, any given ETF may not be a diversified investment.
In this presentation, references to "Vanguard" are provided for convenience only and may refer to, where applicable, only The Vanguard Group, Inc., and/or
may include its affiliates, including Vanguard Investments Canada Inc.
No part of this presentation may be reproduced, distributed, disseminated or referred to, in whole or in part, in any form, including to any investor, without prior
written and express permission by Vanguard Investments Canada Inc. By participating in this presentation or by accepting any copy of the slides presented,
you agree to be bound by these terms and conditions.
© 2017 Vanguard Investments Canada Inc. All rights reserved.
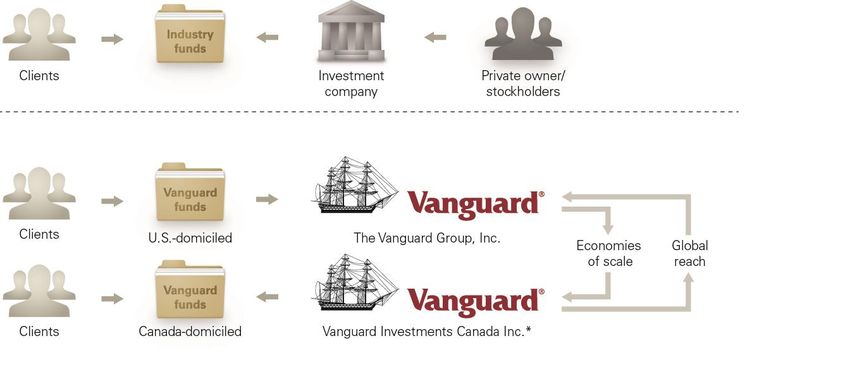
Authorized by Vanguard Investments Canada Inc. for investor use. 39Appendix: Vanguard structure
*Vanguard Investments Canada Inc. is a wholly owned indirect subsidiary of The Vanguard Group, Inc.
Authorized by Vanguard Investments Canada Inc. for investor use. 40You can also read