RECREATIONAL PROPERTY REPORT - RE/MAX 2021
←
→
Page content transcription
If your browser does not render page correctly, please read the page content below
RE/MAX 2021
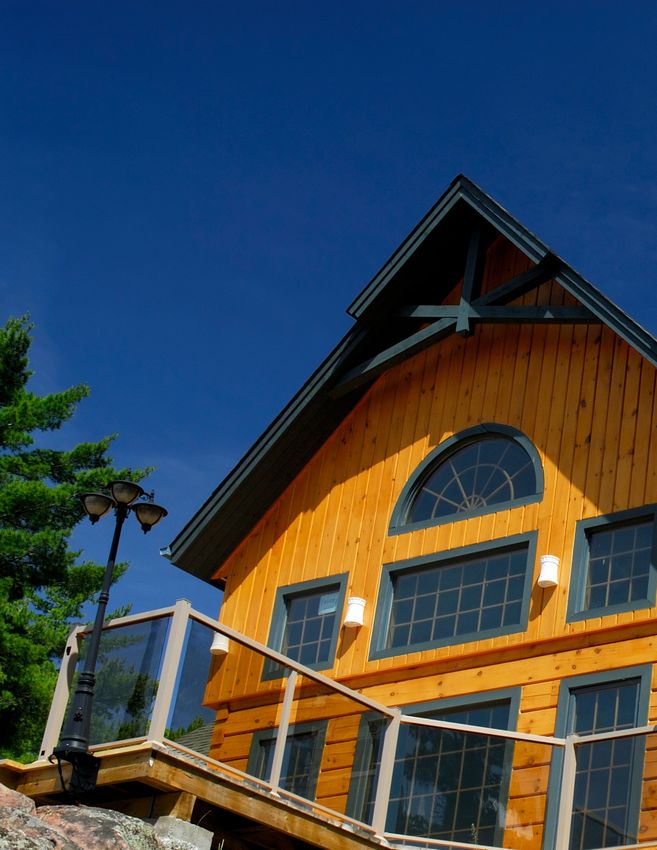
RECREATIONAL PROPERTY
REPORT
National Summary
CANADIANS OPT FOR MORE AFFORDABILITY AND                                 regions, to name but a few, are experiencing low inventory
NEW LIFESTYLE, FLOCKING TO RECREATIONAL                                  levels, bidding war and sky-high prices.
PROPERTY MARKET                                                             “There’s intense competition among buyers in Canada’s
                                                                         recreational property markets and inventory is stretched
57 per cent of markets offer properties below $500K,                     thin,” says Christopher Alexander, Chief Strategy Officer
according to RE/MAX brokers and agents                                   and Executive Vice President, RE/MAX of Ontario-Atlantic
                                                                         Canada. “But Canadians recognize that recreational
• Average sale price anticipated to rise up to 30% in some               properties remain an affordable option in such a turbulent
  recreational property markets, according to RE/MAX                     market. There are still many recreational markets across
  brokers and agents.                                                    Canada that are deemed affordable, despite the growing
                                                                         demand and rising prices.”
• 44 per cent of recreational property buyers are
  budgeting $200,000-$500,000 in the next 12 months.                     THE AFFORDABILITY OUTLOOK

• 57 per cent of Canadian recreational markets include at                According to RE/MAX brokers and agents, sellers’ market-
  least one property type within the $200K-$500K price                   like conditions are anticipated to persist for the remainder
  range                                                                  of the year in 97 per cent of regions examined in the
                                                                         report. These conditions are typically accompanied by
The red-hot demand seen in Canada’s urban centres                        rising prices, which has been a trend in 2020 that is
has migrated into recreational markets, as interest and                  expected to continue through 2021. RE/MAX brokers
activity in suburban and rural properties continues to                   report that 57 per cent of Canada’s recreational markets
grow. Despite rising demand, 57 per cent of Canadian                     include at least one property type priced in the $200,000
recreational markets still have at least one property type               -
2021 RECREATIONAL PROPERTY REPORT
ANTICIPATED ANTICIPATED
% PRICE AVERAGE
AVERAGE RECREATIONAL SALE PRICE CHANGE GROWTH SALES PRICE
PROPERTY (+/-)
MARKET For remainder of For remainder of
TYPE 2021 2021
2019- % CHANGE
2019* 2020* 2021** MAY-DEC
2021 (+/-)
ONTARIO-ATLANTIC
Prince Waterfront $675,455.00 $820,950.00 $843,975.00 25% 10% $928,372.50
Edward
County Non-Waterfront $445,085.00 $524,788.00 $674,404.00 52% 10% $741,844.40
Peterborough Waterfront $641,225.00 $807,648.00 $1,090,286.00 70% 5% $1,144,800.30
and The
Kawarthas Non-Waterfront $445,562.00 $502,419.00 $692,078.00 55% 5% $726,681.90
Waterfront $1,070,873.00 $1,310,489.00 $1,483,352.00 39% 15% $1,705,854.80
Muskoka Non-Waterfront $393,839.00 $488,878.00 $619,799.00 57% 20% $743,758.80
Condo $314,467.00 $362,364.00 $347,069.00 10% 13% $392,187.97
Waterfront $552,882.00 $712,197.00 $896,471.00 62% 15% $1,030,941.65
Haliburton
Non-Waterfront $290,721.00 $342,926.00 $512,883.00 76% 20% $615,459.60
County
Condo $382,583.00 $406,909.00 $300,000.00 -22% 13% $339,000.00
Waterfront $875,036.00 $1,165,270.00 $1,546,561.00 77% 9% $1,685,751.49
Niagara
Region Non-Waterfront $424,282.00 $564,939.00 $758,776.00 79% 7% $811,890.32
(Niagara
-On-The- Water access $506,700.00 $907,734.00 $1,317,500.00 160% 8% $1,422,900.00
Lake)
Condo $568,172.00 $476,200.00 $499,354.00 -12% 11% $554,282.94
Waterfront $410,737.00 $377,446.00 $425,805.00 4% 9% $464,127.45
Thunder Bay
Non-Waterfront $262,406.00 $276,149.00 $262,711.00 0% 12% $294,236.32
Waterfront $571,296.00 $545,237.00 $661,699.00 16% 30% $860,208.70
Non-Waterfront $246,275.00 $258,423.00 $267,595.00 9% 25% $334,493.75
Kenora
Water access $571,296.00 $545,237.00 $674,939.00 18% 25% $843,673.75
Condo $320,971.00 $255,781.00 $456,450.00 42% 32% $602,514.00
Waterfront $547,403.00 $684,142.00 $916,248.00 67% 20% $1,099,497.60
Grey Bruce
Counties
Non-Waterfront $363,939.00 $424,726.00 $580,585.00 60% 20% $696,702.00
Waterfront $365,000.00 $475,000.00 $620,000.00 70% 15% $713,000.00
Barry’s Bay
Non-Waterfront $285,000.00 $315,000.00 $325,000.00 14% 5% $341,250.00
Waterfront $917,000.00 $1,060,000.00 $1,341,000.00 46% 14% $1,528,740.00
Huronia
Non-Waterfront $436,000.00 $513,000.00 $694,000.00 59% 14% $791,160.002021 RECREATIONAL PROPERTY REPORT
ANTICIPATED ANTICIPATED
% PRICE AVERAGE
AVERAGE RECREATIONAL SALE PRICE CHANGE GROWTH SALES PRICE
PROPERTY (+/-)
MARKET For remainder of For remainder of
TYPE 2021 2021
2019- % CHANGE
2019* 2020* 2021** MAY-DEC
2021 (+/-)
Waterfront $921,796.00 $958,711.00 $1,292,877.00 40% 10% $1,422,164.70
Non-Waterfront $493,811.00 $601,947.00 $756,557.00 53% 5% $794,384.85
Grand Bend
Water access $522,551.00 $593,608.00 $780,521.00 49% 15% $897,599.15
Condo $334,957.00 $447,959.00 $567,600.00 69% 10% $624,360.00
Waterfront $1,130,131.00 $1,073,299.00 $1,205,338.00 7% 5.5% $1,271,631.59
Collingwood
(Southern Non-Waterfront $580,303.00 $736,841.00 $829,866.00 43% 6% $879,657.96
Georgian Bay
& Western Water access $1,106,074.00 $1,336,320.00 $1,130,000.00 2% 5.5% $1,192,150.00
Region)
Condo $444,747.00 $499,868.00 $494,805.00 11% 6% $524,493.30
Waterfront $592,378.00 $705,285.00 $918,436.00 55% 8.5% $1,000,000.00
Non-Waterfront $415,378.00 $494,244.00 $620,775.00 49% 12% $700,000.00
Norfolk
County
Water access $592,378.00 $705,285.00 $918,436.00 55% 8.5% $1,000,000.00
(Port Dover/
Turkey Point) Unable to Unable to
Ski-in $592,378.00 $705,285.00 $918,436.00 55%
speculate speculate
Condo $343,211.00 $634,500.00 $764,500.00 123% 4.5% $800,000.00
Port Waterfront $650,566.00 $861,336.00 $1,075,912.00 65% 20% $1,291,094.40
Colborne/
Wainfleet Non-Waterfront $368,443.00 $456,737.00 $552,913.00 50% 20% $663,495.60
Waterfront $420,500.00 $425,000.00 $723,000.00 72% 11% $800,000.00
Parry Sound Non-Waterfront $365,000.00 $365,000.00 $550,000.00 51% 6.5% $585,000.00
Condo $255,000.00 $325,000.00 $440,000.00 73% 30.5% $575,000.00
Waterfront $1,070,000.00 $1,682,360.00 $1,841,217.00 72% 10% $2,025,338.70
Non-Waterfront $520,000.00 $650,000.00 $775,000.00 49% 10% $852,500.00
Barrie (Innisfil
and Oro)
Water access $620,000.00 $800,000.00 $900,000.00 45% 10% $990,000.00
Condo N/A $553,520.00 $496,758.00 -10% 10% $553,520.00
Waterfront $830,678.00 $895,660.00 $1,149,322.00 38% 5% $1,206,788.10
Orillia Non-Waterfront $489,388.00 $591,125.00 $740,125.00 51% 0% $740,125.00
Unable to Unable to
Condo $401,696.00 $449,173.00 $587,291.00 46%
speculate speculate2021 RECREATIONAL PROPERTY REPORT
ANTICIPATED ANTICIPATED
% PRICE AVERAGE
AVERAGE RECREATIONAL SALE PRICE CHANGE GROWTH SALES PRICE
PROPERTY (+/-)
MARKET For remainder of For remainder of
TYPE 2021 2021
2019- % CHANGE
2019* 2020* 2021** MAY-DEC
2021 (+/-)
Waterfront $434,000.00 $569,000.00 $503,000.00 16% 15% $578,450.00
Rideau Lakes Non-Waterfront $275,000.00 $434,000.00 $441,000.00 60% 10% $485,100.00
Water access $205,000.00 $501,000.00 $659,000.00 221% 15% $757,850.00
Waterfront $550,000.00 $700,000.00 $750,000.00 36% 15% $862,500.00
Brock Non-Waterfront $575,000.00 $575,000.00 $625,000.00 9% 10% $687,500.00
Township
(Beaverton) Water access $590,000.00 $600,000.00 $650,000.00 10% 10% $715,000.00
Condo $425,000.00 $480,000.00 $525,000.00 24% 0% $525,000.00
Waterfront $468,106.00 $596,348.00 $709,833.00 52% 15% $816,307.95
Windsor
Essex
Non-Waterfront $315,246.00 $391,643.00 $487,822.00 55% 15% $560,995.30
(Bell River,
Lake St. Clair)
Water access $449,208.00 $623,747.00 $741,717.00 65% 15% $852,974.55
Waterfront $489,434.00 $618,814.00 $762,509.00 56% 10% $838,759.90
Thousand
Islands
Non-Waterfront $376,551.00 $433,485.00 $540,420.00 44% 10% $594,462.00
Waterfront $189,900.00 $208,706.00 $291,909.00 54% 5% $306,504.45
Sudbury,
Manitoulin, Non-Waterfront $105,471.00 $150,396.00 $212,603.00 102% 5% $223,233.15
French River
Unable to Unable to
Water access $173,905.00 $204,567.00 $487,500.00 180%
speculate speculate
Waterfront $269,950.00 $310,000.00 $334,447.00 24% 5% $351,169.35
Charlottetown
Non-Waterfront $276,472.00 $310,635.00 $350,231.00 27% 7% $374,747.17
Waterfront $320,000.00 $407,850.00 $741,650.00 132% 5% $778,732.50
St. Andrews
Non-Waterfront $158,300.00 $289,294.00 $350,900.00 122% 5% $368,445.00
Waterfront $456,515.00 $571,289.00 $698,104.00 53% 7% $746,971.28
Non-Waterfront $330,334.00 $372,225.00 $464,625.00 41% 6% $492,502.50
Halifax
Water access $442,198.00 $562,071.00 $673,560.00 52% 6% $713,973.60
Condo $275,127.00 $301,336.00 $392,362.00 43% 5.5% $413,941.91
Each RE/MAX office is independently owned and operated. The outlook for the remainder of 2021 was provided by RE/MAX Canada Brokers and Agents.
*Average sale prices listed from January 1 to December 31, 2019 and January 1 and December 31, 2020.
**Average sale prices listed are from January 1 to April 30, 2021.2021 RECREATIONAL PROPERTY REPORT
ANTICIPATED ANTICIPATED
% PRICE AVERAGE
AVERAGE RECREATIONAL SALE PRICE CHANGE GROWTH SALES PRICE
PROPERTY (+/-)
MARKET For remainder of For remainder of
TYPE 2021 2021
2019- % CHANGE
2019* 2020* 2021** MAY-DEC
2021 (+/-)
WESTERN CANADA
Unable to Unable to
Chalets $2,864,114.00 $3,264,947.00 $3,690,356.00 29%
speculate speculate
Duplex & Unable to Unable to
$1,680,231.00 $1,796,471.00 $2,244,286.00 34%
Townhouse speculate speculate
Residential &
Unable to Unable to
Flexible Use $990,917.00 $1,027,318.00 $984,034.00 -1%
Whistler speculate speculate
Condos
Restricted Use/
Unable to Unable to
Condo Hotel $373,271.00 $392,870.00 $555,277.00 49%
speculate speculate
Units
Shared Unable to Unable to
$184,181.00 $197,629.00 $200,461.00 9%
Ownership speculate speculate
Unable
Unable to
Waterfront $2,515,000.00 $1,165,000.00 to spec- 43% $1,665,000.00
speculate
Tofino ulate
Non-Waterfront $909,000.00 $1,165,000.00 $1,165,000.00 28% 8% $1,265,000.00
Waterfront $807,000.00 $1,300,000.00 $1,650,000.00 104% 12% $1,850,000.00
Ucluelet
Non-Waterfront $620,000.00 $600,000.00 $815,000.00 31% 6% $865,000.00
Waterfront $1,938,381.00 $2,260,167.00 $2,430,434.00 25% 4% $2,527,651.36
Non-Waterfront $738,026.00 $865,000.00 $997,241.00 35% 5% $1,047,103.05
Ski-in (Ski
$395,633.00 $422,855.00 $516,712.00 31% 8% $555,465.40
Central Condo)
Okanagan
Ski-in $920,969.00 $885,612.00 $1,030,500.00 12% 8% $1,107,787.50
Condo
$585,974.00 $649,026.00 $592,915.00 1% 4% $616,631.60
(Waterfront)
Condo (Non-
$417,755.00 $444,721.00 $496,998.00 19% 4% $516,877.92
Waterfront)
Waterfront $1,313,000.00 $1,650,300.00 $1,140,000.00 -13% 25% $1,425,000.00
North
Okanagan/ Non-Waterfront $523,152.00 $583,256.00 $647,515.00 24% 8% $699,316.20
Shuswap
Condo $231,158.00 $254,888.00 $291,386.00 26% 8% $314,696.88
Waterfront $700,000.00 $1,058,000.00 $1,130,000.00 61% 5% $1,186,500.00
Sylvan Lake Non-Waterfront $350,000.00 $365,000.00 $385,000.00 10% 5% $404,250.00
Condo $182,500.00 $199,000.00 $191,000.00 5% 0% $191,000.002021 RECREATIONAL PROPERTY REPORT
ANTICIPATED ANTICIPATED
% PRICE AVERAGE
AVERAGE RECREATIONAL SALE PRICE CHANGE GROWTH SALES PRICE
PROPERTY (+/-)
MARKET For remainder of For remainder of
TYPE 2021 2021
2019- % CHANGE
2019* 2020* 2021** MAY-DEC
2021 (+/-)
Non-Waterfront $1,082,930.00 $1,167,693.00 $1,360,594.00 26% 20% $1,632,712.80
Canmore
Condo $566,086.00 $599,933.00 $611,006.00 8% 15% $702,656.90
Waterfront $255,141.00 $273,308.00 $363,833.00 43% 3% $372,928.83
Interlake Non-Waterfront $218,223.00 $251,919.00 $282,845.00 30% 2% $287,087.68
Region of
Winnipeg Water access $236,697.00 $235,902.00 $290,550.00 23% 1% $293,455.50
Condo $130,221.00 $116,143.00 $110,680.00 -15% 0% $110,680.00
Each RE/MAX office is independently owned and operated. The outlook for the remainder of 2021 was provided by RE/MAX Canada Brokers and Agents.
*Average sale prices listed from January 1 to December 31, 2019 and January 1 and December 31, 2020.
**Average sale prices listed are from January 1 to April 30, 2021.Regional Market Highlights
WESTERN CANADA Tofino and Ucluelet, BC are sellers’ markets, due to
low inventory and high demand. Properties are selling
A majority of Western Canada’s recreational markets are quickly in multiple offers, with young couples driving
sellers’ markets, including Whistler, Shuswap, Canmore, most of the activity in these regions. This is expected
Tofino, Ucluelet, Central Okanagan and Interlake Region to continue for the remainder of 2021, and continued
of Manitoba. Most regions are seeing multiple offer multiple offer situations will put upward pressure on
scenarios, driving prices up for most property types. prices. More millennials are moving to these regions
Out-of-province buyers – typically from Ontario – are full-time for the recreational lifestyle and the capability
looking to Canmore in pursuit of recreation and achieve to work from home. These buyers are typically coming
greater work-life balance. With work-from-home from Lower Mainland B.C., Vancouver Island, Ontario,
conditions, demand has spiked and prices of non- Alberta, and California. Amenities that are the most
waterfront properties in Canmore have increased by 26 sought after in these regions include high-speed wifi,
per cent since 2019. Out-of-province buyers from the surfing and water activities, as well as trails for hiking.
Lower Mainland and Vancouver Island are eyeing Tofino The small community atmosphere plays a major role
and Ucluelet, as well as out-of-country buyers from in attracting both part-time and full-time buyers.
California. Both are looking to the region for the desire Anticipated price growth for recreational properties
to relocate from urban centres and for a secondary over the remainder of 2021 is an increase of 12 per cent
residence. for waterfront and 6 per cent for non-waterfront homes.
With low inventory in Manitoba’s Interlake Region,
prices of waterfront properties have increased by 43 Central Okanagan is a sellers’ market, due to low
per cent since 2019. Most activity is driven by buyers inventory and high demand. Families, couples, retirees,
from within the province, typically families, millennial out of province, and millennial buyers are all driving
couples or investors looking for an affordable option overall demand in this region. Over 40% of recent
outside of urban centres. With most buyers working buyers have been non-local which has had a huge
from home in the region, good Wi-Fi access has become impact on the property supply & demand thereby
a top priority. affecting prices. A notable trend in this region is the
decline in rental options in the market, as landlords have
Whistler, BC is currently a sellers’ market, due to low been selling to cash-in on the rising market. This region
inventory and high demand. Certain types of properties is also starting to see some push back from buyers due
are selling quickly in multiple offers and over the list to the rising prices. When it comes to the COVID-19
price, with regional in-province buyers driving most impact on Central Okanagan’s recreational property
of the activity. The majority of this region’s buyers market, buyers from the city are looking to escape and
have always come from B.C. with around 10 per cent have more indoor and outdoor space. Preferred features
coming from the U.S. and up to 10 per cent coming from for recreational homes in the region include access to
overseas, but since January 2021, more than 93 per cent the outdoor recreation opportunities for skiing, hiking,
of buyers were from the province. The market is driven biking, Okanagan lake and urban convenience.
by buyers who are interested in a lifestyle change and
desire more outdoor space. Amenities that are the most North Okanagan/Shuswap, BC is a seller’s market,
sought after in these regions include home offices, due to low inventory, especially in the single family
being slope-side, walkability, storage for recreational residential market, and high demand. Families, couples,
equipment, and proximity to outdoor amenities. As the investment buyers, speculative buyers, out of province
pandemic continues, buyers interested in recreational buyers, and millennial buyers are all driving demand in
properties in this region may start to become more this region. Buyers in this region are coming from lower
tolerant to high prices, while others are experiencing mainland and Alberta, while demand is high from local
multiple offer fatigue. buyers in the ski hill market. This region is also still
seeing activity from out of country buyers, from places
RE/MAX 2021 Recreational Property Report
Each RE/MAX office is independently owned and operated. Historical
values are sourced from CREA or local real estate board statistics. Estimates and forecasts are based on the
opinion of independent RE/MAX broker/owners and affiliates.Regional Market Highlights
such as Australia. A notable trend in this region is that major city and international airport are just one hour
lakefront homes are selling at a much more brisk pace away. Average sale price for non-waterfront properties
ahead of the usually busy spring and summer selling is projected to increase by 20 per cent, and a 15 per
period. High prices are not stopping buyers in this cent increase in sale price is projected for condos.
region, if they miss out on their first option the search
continues. Preferred features for recreational homes, The Interlake Region of Manitoba is currently a
include proximity to water, the potential to rent it sellers’ market with low inventory and high demand.
out, and the ability to renovate the current structure. Average days on market for resort property types
Anticipated price growth in the region for recreational in the region is currently 10 days, and the region is
properties over the remainder of 2021 is an increase seeing competitive offers on some property types.
of 25 per cent for waterfront and eight per cent for Listing activity has been slower than normal, and
non-waterfront homes. this is expected to continue for the remainder of the
year. Buyers driving demand in this region include
Sylvan Lake, AB is a balanced market, with a 38 per families, couples and those looking for an investment
cent sales to listing ratio in April 2021. The region is property. These buyers are typically from within
active in residential, cottage, and lakefront properties the province. The top reasons that these buyers are
but supply is slow to come on the market. Families, looking to purchase a property in this region include
millennials, couples, retirees, and out of province the lower prices compared to urban centres, potential
buyers are all driving demand in this region. Most to work from home promoting relocation, retirement
recreational property buyers are local in Central planning and purchasing a secondary residence
Alberta, or located in Edmonton or Calgary. Many for recreational/resort use. Average sale price for
of these buyers sold properties in the U.S. and are waterfront properties is anticipated to increase
looking for something closer to home. When it comes by three per cent, while prices for non-waterfront
to the COVID-19 impact on Sylvan Lake’s recreational properties is anticipated to increase by two per cent.
property market, strong demand is anticipated to
continue due to the influx of buyers the region has ONTARIO
experienced, with none of them planning to step back
due to the rising prices. COVID-19 negatively impacted All of Ontario’s recreational markets are sellers’
the market in April and May of 2020, but since then markets, with low inventory and high demand. These
it has positively impacted it. Preferred features for regions include Bancroft, Barrie-Innisfil, Haliburton,
recreational homes, include space in order to work Kenora, Muskoka, Niagara region, Parry Sound,
from home and proximity to water. Peterborough and The Kawarthas, Prince Edward
County, Sudbury and Thunder Bay to name a few.
Canmore, AB is currently a sellers’ market, the Young families, many from the GTA and Hamilton,
increased demand and low inventory are putting are now looking to Muskoka after feeling priced
upward pressure on property prices in the region. out of urban centres. This is impacting supply and
Strong price growth is anticipated for the remainder affordability in the region, with average sale price
of the year. Albertans and out-of-province buyers of waterfront properties in Muskoka anticipated to
(mostly from Ontario) are driving market activity, increase by 20 per cent this year. Prince Edward
these buyers are looking for a recreational lifestyle County is seeing an uptick in buyers with work-
to balance out their current work lifestyle. Work- from-home allowances, as well as retirees, who are
from-home allowances, retirement plans, and a considered to be driving the most market activity in
secondary residence for recreational use are the top the region.
three reasons that buyers are looking to purchase in In Niagara region, the average sale price of
Canmore. Buyers are attracted to the region due to waterfront properties reached $1,546,561 in the first
its location in the Rocky Mountains, for its proximity four months of 2021, a 77-per-cent increase from an
to both provincial and national parks, and the closest average sale price of $875,036 in 2019. Strong price
RE/MAX 2021 Recreational Property Report
Each RE/MAX office is independently owned and operated. Historical
values are sourced from CREA or local real estate board statistics. Estimates and forecasts are based on the
opinion of independent RE/MAX broker/owners and affiliates.Regional Market Highlights
growth since 2019 was also evident for Niagara’s and access to public or private green space. The
water-access properties, which increased 160 per cent, impact of COVID-19 on the market is anticipated to
from $506,700 in 2019 to $1,317,500 in 2021. Continued continue to push prospective buyers up to the region,
price growth for these property types is anticipated for where more public green space and beaches are
the remainder of the year, by nine per cent and eight available. Anticipated price growth in the region for
per cent, respectively. Families looking for a secondary recreational properties over the remainder of 2021 is
residence are the key drivers of market activity in the an increase of 15 per cent for waterfront homes, 20
region. Strong interest from this cohort is anticipated per cent for non-waterfront homes, and 13 per cent for
to continue, with Niagara’s close proximity to Crystal condos.
Beach, Port Colborne, Niagara Falls and Grimsby.
Prince Edward County, ON is a sellers’ market as
Muskoka, ON is a sellers’ market, driven by very low a result of low inventory and very strong demand.
inventory causing days on market to reduce by nearly Buyers in all categories are currently driving sales
20 per cent as compared to 2019. Young families are activity in the region, with many buyers coming
driving much of the demand in the region, especially specifically from Toronto and the Durham region,
those from the GTA and Hamilton looking for more especially in light of the pandemic. Buyers looking
affordability outside of the city. A notable trend in the to purchase recreational properties in Prince Edward
region has been First-Time homebuyers, who are County are doing so as a result of work-from-
frustrated with critical market factors such as high home allowances prompting them to relocate from
asking prices, non-conditional offer scenarios, forcing urban centres, retirement plans, or are looking for
many to drop out of their search, and take a wait-and- a secondary residence for recreational use only.
see approach in Muskoka’s market, before re-engaging. Preferred features for recreational homes in the region
When it comes to the COVID-19 impact on Muskoka’s include access to healthcare, beaches, good grocery
recreational property market, buyers from the city stores, and Wi-Fi access. Prince Edward County is
have been interested in the market because of its an attractive option for anyone hoping to escape
relative affordability and more green space. Preferred the hustle and bustle of a city, with a more relaxed
features for recreational homes in the region include lifestyle. Furthermore, a new residential development
good Wi-Fi, beach nearby, office space, and acreage. on Picton Harbour called Port Picton
Anticipated price growth in the region for recreational will bring waterfront residential units in various
properties over the remainder of 2021 is an increase of options from condos to townhouses to the region
15 per cent for waterfront and 20% for non-waterfront this year. Anticipated price growth in the region for
homes. recreational properties over the remainder of 2021 is
an increase of 10 per cent for both waterfront and
Haliburton County is a sellers’ market as a result of low non-waterfront homes.
inventory and high demand. Families and retirees are
currently driving sales activity, with a majority coming Peterborough and The Kawarthas, ON is a sellers’
from the GTA and Hamilton. Buyers looking to market as a result of low inventory and increasing
purchase recreational properties in Haliburton County demand. Buyers in all categories are driving sales
are doing so as a result of lower prices compared to activity, including families, millennials, couples,
city centres, work-from-home allowances promoting retirees, and investors. These buyers are coming from
them to relocate from urban centres, retirement plans, within the province, with the biggest group migrating
or looking for a secondary residence for recreational from the GTA. Local buyers are thought to be having
use only. Given rising prices within the market, many difficulty competing with GTA buyers when bidding
first-time home buyers have had to re-evaluate their for a home, given the increase in prices over the
buying plans. Preferred features for recreational homes past year. Buyers looking to purchase recreational
in the region include good Wi-Fi, office space, properties in Peterborough and The Kawarthas are
RE/MAX 2021 Recreational Property Report
Each RE/MAX office is independently owned and operated. Historical
values are sourced from CREA or local real estate board statistics. Estimates and forecasts are based on the
opinion of independent RE/MAX broker/owners and affiliates.Regional Market Highlights
doing so as a result of work-from-home allowances is being driven by out-of-province buyers, with
prompting them to relocate from urban centres, increased interest resulting from the pandemic and
retirement plans, or looking for a secondary residence strict lockdown measures in other parts of Canada,
for recreational use only. Preferred features for along with increased flexibility to work remotely.
recreational homes in the region include good Wi-Fi, The average sale price of waterfront properties in
space, privacy, and any kind of waterfront property. Halifax is $698,104, a 53-per-cent increase from
The impact of COVID-19 on the region is thought to 2019 ($456,515). In 2021, the average sale price of
continue over the next six months, as travel remains waterfront properties is projected to increase by
restricted and many buyers are looking to escape seven per cent.
urban centres in the summer months. Anticipated
potential price growth in the region for recreational St. Andrews, NB is also a sellers’ market. Recreational
properties over the remainder of 2021 is a possible property sales in St. Andrews is being driven by
increase of up to 5% for both waterfront and non- out-of-province buyers, thanks to the region’s lower
waterfront homes. average sale price compared to large urban centres.
Low inventory is putting an upward pressure on
Niagara Region is a sellers’ market as a result of the waterfront properties, average sale price saw an
area being rich in amenities and strong buyer demand. increase of 132 per cent since 2019, rising from
Families are currently driving sales activity in the $320,000 to $741,650. The average sale price of
region,with many coming from within the province, waterfront properties is anticipated to increase by five
primarily from the GTA and Halton. Buyers looking to per cent over the remainder of the year.
purchase recreational properties in Niagara Region
are often searching for lower prices compared to Charlottetown, PEI is a sellers’ market, driven by out-
city centres or looking for a secondary residence for of-province buyers, influenced by the notion that PEI
recreational use. Even amidst rising prices, buyers has been positioned as one of the safer places to be in
have still been active in the market, especially as it Canada, based on the number of COVID-19 cases and
pertains to waterfront properties, which are thought hospitalizations. This has put downward pressure on
to have larger lots and better value per square foot the region’s inventory, which was already struggling
compared to other recreational markets within to meet demand. Because of the size of the province,
Ontario. The trend of buying recreational properties many recreational homes can be used year-round. As
in Niagara is anticipated to continue, especially once a result, there’s a mix of true cottages purchased by
the Canada-US border returns to its regular activity. local buyers opting for an affordable second property,
Anticipated price growth in the region for recreational as well as those that have full four season capacities
properties over the remainder of 2021 is an increase of on the higher end. When it comes to the COVID-19
nine per cent for waterfront properties, seven per cent impact on Charlottetown’s recreational property
for non-waterfront homes, and 11 per cent for condos. market, strong demand is anticipated to continue due
to the influx of buyers the region has experienced
ATLANTIC CANADA as a result of the lifestyle, safety, and affordability
available. Preferred features for recreational homes
In Atlantic Canada, recreational property markets are include proximity to water, Wi-Fi access, and space.
experiencing similar conditions as local residential Anticipated price growth in the region for recreational
markets and other recreational markets nation-wide, properties over the remainder of 2021 is an increase
with low inventory and high demand putting upward of five per cent for waterfront, and seven per cent for
pressure on prices. non-waterfront.
Halifax, NS is experiencing sellers’ market conditions,
with low inventory and high demand. Market activity
RE/MAX 2021 Recreational Property Report
Each RE/MAX office is independently owned and operated. Historical
values are sourced from CREA or local real estate board statistics. Estimates and forecasts are based on the
opinion of independent RE/MAX broker/owners and affiliates.Contributors
TOFINO/UCLUELET, SUDBURY, ONTARIO WINDSOR-ESSEX, ONTARIO BARRY’S BAY, ONTARIO
BRITISH COLUMBIA (FRENCH RIVER & (BELL RIVER/LAKE ST. CLAIR) Cathy Pitts
Judy Gray MANITOULIN ISLAND) Glen Muir RE/MAX Country
RE/MAX Mid-Island Realty Cathy Gregorchuk RE/MAX Preferred Classics Ltd.
250-726-2228 RE/MAX Crown Realty Realty Ltd. 613-756-6789
705-560-5650 519-944-5955
WHISTLER & SQUAMISH, RIDEAU LAKES, ONTARIO
BRITISH COLUMBIA PARRY SOUND, ONTARIO NORFOLK COUNTY, Rob Garvin
Stef Hostetter John Sallinen ONTARIO (PORT DOVER, RE/MAX Affiliates
RE/MAX Sea to Sky RE/MAX Parry Sound- TURKEY POINT) Realty Ltd.
604-932-2300 Muskoka Realty Ltd. Darryl Swarts 613-283-2121
705-746-9336 RE/MAX Erie Shores
CENTRAL OKANAGAN, Realty Inc. KINGSTON, ONTARIO
BRITISH COLUMBIA MUSKOKA, MINDEN & 519-583-3555 (THOUSAND ISLANDS)
Jerry Redman HALIBURTON, ONTARIO Rob Colangeli
RE/MAX Professionals PORT COLBORNE & RE/MAX Finest Realty Inc.
RE/MAX Kelowna
North WAINFLEET, ONTARIO 613-389-7777
250-717-5000
Katie Rowe, 705-788-1444 Angelo & Michael Muraco
Jeff Strano, 705-457-1011 RE/MAX Niagara ST. ANDREWS, NEW
SHUSWAP, BRITISH
Realty Ltd. BRUNSWICK
COLUMBIA
COLLINGWOOD, ONTARIO 905-356-9600 Mark Gauley
Brad Marsh Blair Thompson & Chris RE/MAX Professionals
RE/MAX Shuswap McCormick NIAGARA REGION, Saint John Inc.
250-832-7051 RE/MAX Four Seasons ONTARIO (NIAGARA-ON- 506-634-8200
Realty Inc. THE-LAKE)
BANFF/CANMORE, 705-445-8500 Conrad Zurini HALIFAX, NOVA SCOTIA
ALBERTA RE/MAX Escarpment Realty Ryan Hartlen
Richard Greaves HURONIA, ONTARIO Inc. RE/MAX Nova
RE/MAX Alpine Realty Peggy Worthen 905-545-1188 902-468-3400
403-678-5890 RE/MAX Georgian Bay
Realty Ltd. BROCK TOWNSHIP & CHARLOTTETOWN,
SYLVAN LAKE, ALBERTA 705-361-3613 KAWARTHA LAKES PRINCE EDWARD ISLAND
Dale Russell (BEAVERTON), ONTARIO Mary Jane Webster
RE/MAX Real Estate Central ORILLIA, ONTARIO Marty Leeking RE/MAX Charlottetown
Alberta (Sylvan Lake) Daniel Stoutt RE/MAX Country Lakes Realty
403-887-2217 RE/MAX Orillia Realty Ltd. Realty Inc. 902-892-2000
705-325-1373 705-426-2905
LAKE WINNIPEG/LAKE OF
THE WOODS, MANITOBA BARRIE, INNISFIL & ORO, PETERBOROUGH & THE
Daphne Shepherd ONTARIO KAWARTHAS, ONTARIO
RE/MAX Encore Realty Rick Laferriere & Ellie John Hope & Winnie
204-886-2000 Haringa Norman
RE/MAX Hallmark Chay RE/MAX Eastern Realty Inc.
KENORA, ONTARIO Realty 705-292-9551
Karen Redden 705-722-7100
RE/MAX Northwest Realty BELLEVILLE & PRINCE
807-468-4573 GREY BRUCE COUNTIES EDWARD COUNTY,
Brian Wardell & ONTARIO
Greg Kirby Kathy Dimaline Sean McKinney
RE/MAX First Choice RE/MAX Grey Bruce RE/MAX Quinte Ltd.
Realty Ltd. Realty Inc. 613-969-9907
807-344-5700 519-793-3444
BANCROFT REGION,
THUNDER BAY, ONTARIO GRAND BEND, ONTARIO ONTARIO
Mario Tegola Doug & Mark Pedlar Victoria Parlette
RE/MAX First Choice RE/MAX Bluewater RE/MAX Country
Realty Ltd. Realty Inc. Classics Ltd.
807-473-7206 519-238-5700 613-332-0444
RE/MAX 2021 Recreational Property Report
Each RE/MAX office is independently owned and operated. Historical
values are sourced from CREA or local real estate board statistics. Estimates and forecasts are based on the
opinion of independent RE/MAX broker/owners and affiliates.About this report
The RE/MAX 2021 Recreational Property Report includes of words such as “believe,” “intend,” “expect,” “estimate,”
data and insights from RE/MAX brokerages. RE/MAX “plan,” “outlook,” “project” and other similar words and
brokers and agents are surveyed on market activity and expressions that predict or indicate future events or
local developments. Average sale price prediction range trends that are not statements of historical matters. These
is reflective of all property types in a region and varies forward-looking statements include statements regarding
depending on the region. housing market conditions and the Company’s results of
operations, performance and growth. Forward-looking
Regional summaries with additional broker insights can be statements should not be read as guarantees of future
found at RE/MAX.ca. performance or results. Forward-looking statements are
based on information available at the time those statements
About Leger are made and/or management’s good faith belief as of that
time with respect to future events and are subject to risks
Leger is the largest Canadian-owned full-service market and uncertainties that could cause actual performance
research firm. An online survey of 1,548 Canadians was or results to differ materially from those expressed in or
completed between April 23-25, 2021 using Leger’s online suggested by the forward-looking statements. These risks
panel. Leger’s online panel has approximately 400,000 and uncertainties include (1) the global COVID-19 pandemic,
members nationally and has a retention rate of 90 per cent. which has impacted the Company and continues to pose
A probability sample of the same size would yield a margin significant and widespread risks to the Company’s business,
of error of +/- 2.51 per cent, 19 times out of 20. the Company’s ability to successfully close the anticipated
reacquisition and to integrate the reacquired regions into its
About the RE/MAX Network business, (3) changes in the real estate market or interest
rates and availability of financing, (4) changes in business
RE/MAX was founded in 1973 by Dave and Gail Liniger, with and economic activity in general, (5) the Company’s ability
an innovative, entrepreneurial culture affording its agents and to attract and retain quality franchisees, (6) the Company’s
franchisees the flexibility to operate their businesses with franchisees’ ability to recruit and retain real estate agents
great independence. Over 125,000 agents provide RE/MAX and mortgage loan originators, (7) changes in laws and
a global reach of more than 110 countries and territories. RE/ regulations, (8) the Company’s ability to enhance, market,
MAX is Canada’s leading real estate organization with more and protect the RE/MAX and Motto Mortgage brands, (9)
than 20,000 Sales Associates and over 900 independently- the Company’s ability to implement its technology initiatives,
owned and operated offices nationwide. RE/MAX, LLC, one and (10) fluctuations in foreign currency exchange rates,
of the world’s leading franchisors of real estate brokerage and those risks and uncertainties described in the sections
services, is a subsidiary of RE/MAX Holdings, Inc. (NYSE: entitled “Risk Factors” and “Management’s Discussion and
RMAX). With a passion for the communities in which its Analysis of Financial Condition and Results of Operations” in
agents live and work, RE/MAX is proud to have raised the most recent Annual Report on Form 10-K and Quarterly
millions of dollars for Children’s Miracle Network Hospitals® Reports on Form 10-Q filed with the Securities and Exchange
and other charities. For more information about RE/MAX, Commission (“SEC”) and similar disclosures in subsequent
to search home listings or find an agent in your community, periodic and current reports filed with the SEC, which are
please visit www.remax.ca. available on the investor relations page of the Company’s
website at www.remax.com and on the SEC website at www.
Forward looking statements sec.gov. Readers are cautioned not to place undue reliance
on forward-looking statements, which speak only as of the
This report includes “forward-looking statements” within date on which they are made. Except as required by law,
the meaning of the “safe harbor” provisions of the United the Company does not intend, and undertakes no duty, to
States Private Securities Litigation Reform Act of 1995. update this information to reflect future events
Forward-looking statements may be identified by the use or circumstances.
RE/MAX 2021 Recreational Property Report
Each RE/MAX office is independently owned and operated. Historical
values are sourced from CREA or local real estate board statistics. Estimates and forecasts are based on the
opinion of independent RE/MAX broker/owners and affiliates.You can also read